


- Getting Started
- Administration Guide
-
User Guide
- An Introduction to Wyn Enterprise
- Document Portal for End Users
- Data Governance and Modeling
- Working-with-Resources
- Working with Reports
- Working with Dashboards
- View and Manage Documents
- Understanding Wyn Analytical Expressions
- Section 508 Compliance
- Developer Guide
Create a Cached Dataset
The Cached Dataset executes a preset query and caches the data in the server to provide high performance data analysis and interactivity. While creating a dataset, you need to establish a relationship between the data in two tables that determines how the data appears in the result set.
Union operation between tables combines data as:
Union Operation | Description |
|---|---|
Union | Removes any duplicate rows. |
Union All | Retains the duplicate rows. |
Join operation between tables combines data as:
Join Operation | Description |
|---|---|
Inner Join | Matches rows from Table1 with rows in Table2, and allows the user to retrieve records that show a relationship in both the tables. Inner join produces a set of data that matches both Table1 and Table2. |
Left Join | Allows users to select rows that match from both the left and right tables, plus all the rows from the left table (table 1). This means only those rows from table2 that intersect with table1, appear in the result set. |
Right Join | Allows users to select rows that match from both the left and right tables, plus all the rows from the right table (table 2). This means that only those rows from table 1 that intersect with table 2, appear in the result set. |
Full Join | Allows users to select rows that match from both the tables along with the rows that do not match any row in the other table. |
Create Cached Dataset
Follow the below steps to create a cached dataset for a dashboard. These steps are also applicable in case of a cached dataset for a report.
On the Resource Portal, navigate to Create (+) > Prepare Data of the Dashboard section.
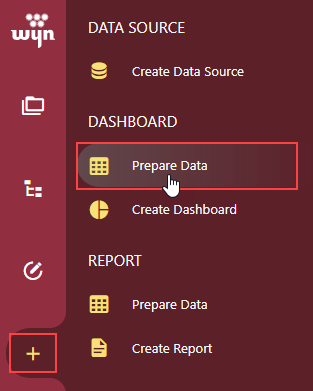
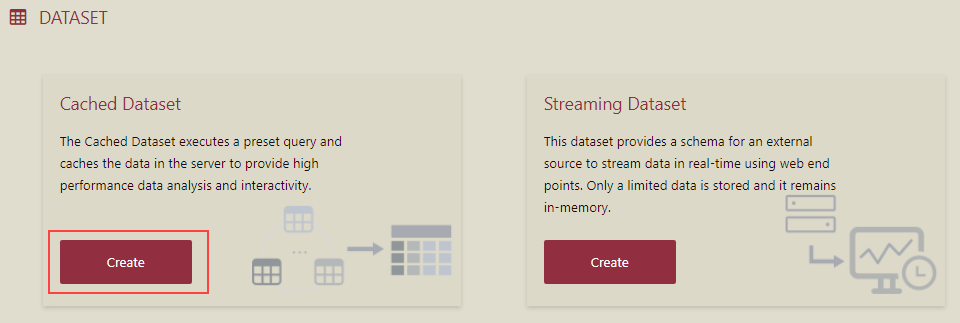
To create a cached dataset for the dashboard, click the Create button as shown.
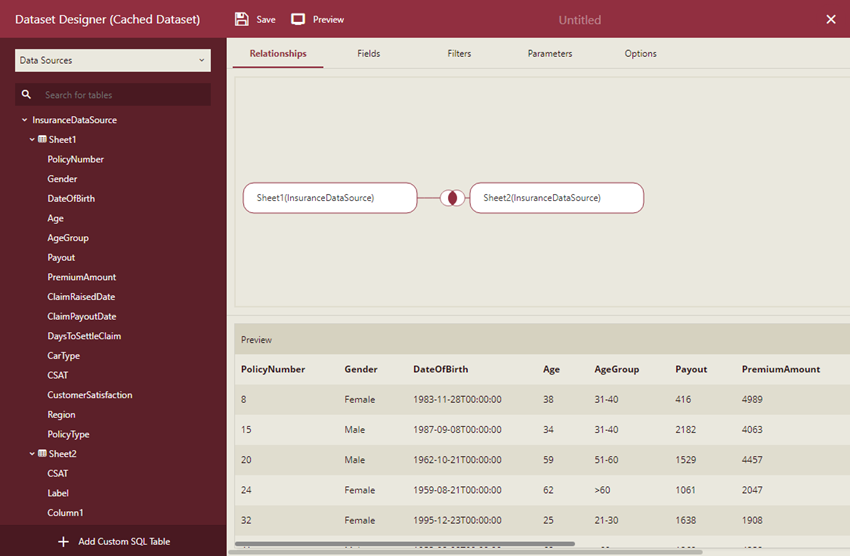
In the Dataset Designer (Cached Dataset) window, select the data source, say InsuranceDataSource from the available data sources, and click OK. You see the tree view of the selected data source and the data tables and fields contained in the data source.
Define Relationship
Drop a Table (Sheet1) on Relationships. You can view the data in the added table by selecting Preview. You can add single or multiple tables from the data source.
Let us add another table (Sheet2). While you are dropping the second table, define and set the relationship to either Union or Join.
In our case, let the relation be Join.
You see a join condition is already defined. You can modify the condition as required. Note that the condition field type should be correct.
Let us keep the default join condition, which is Inner Join: CSAT of Sheet 1 matches CSAT of Sheet2.
Preview the final data set by selecting Preview.
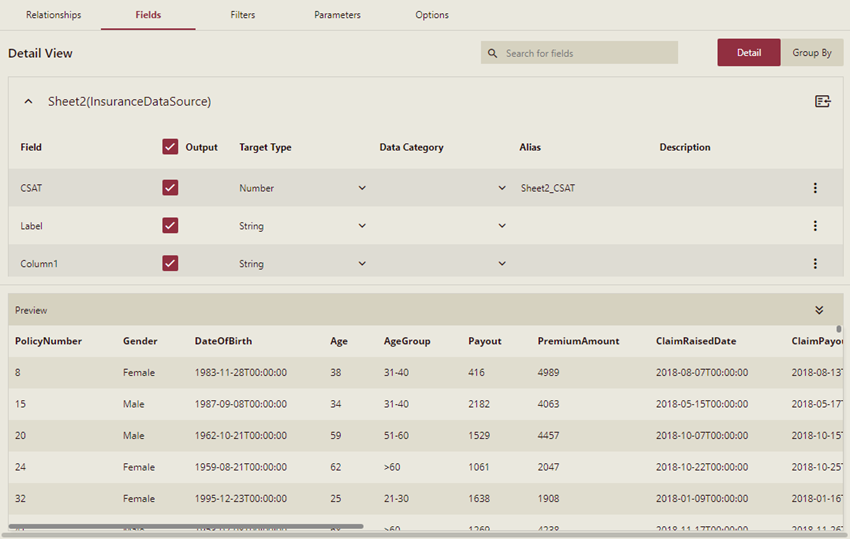
Edit Fields
Go to the Fields tab. Here, you can modify the field format, include or exclude a field from the final dataset, set data category and aliases, or add descriptions for the fields. Also, you can add SQL Expression, Calculated, or Category fields.
Note: Data category is used to give visualization hints related to the attribute type when generating a smart scenario through the Visualization Wizard. Different data types have different possible values. For example, the string data type supports these values: Geography (Region), Image URL, or Image Binary. The numeric data type supports these values: Currency, Geography (Latitude), or Geography (Longitude).
Click Preview.
Add Filters
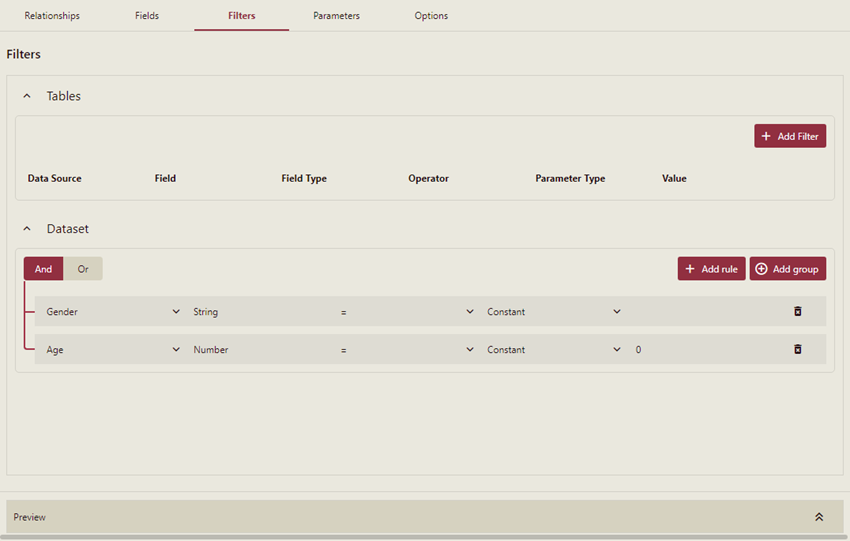
In the Filters tab, you can add data filtering conditions to the source data table or to the final dataset depending on your requirements. Fill-in the filter details in the lower section of the Filters tab as shown below. Note that the Value field is disabled since we have not yet added the Parameters.
Let us add the parameters that will be later specified in the Value field.
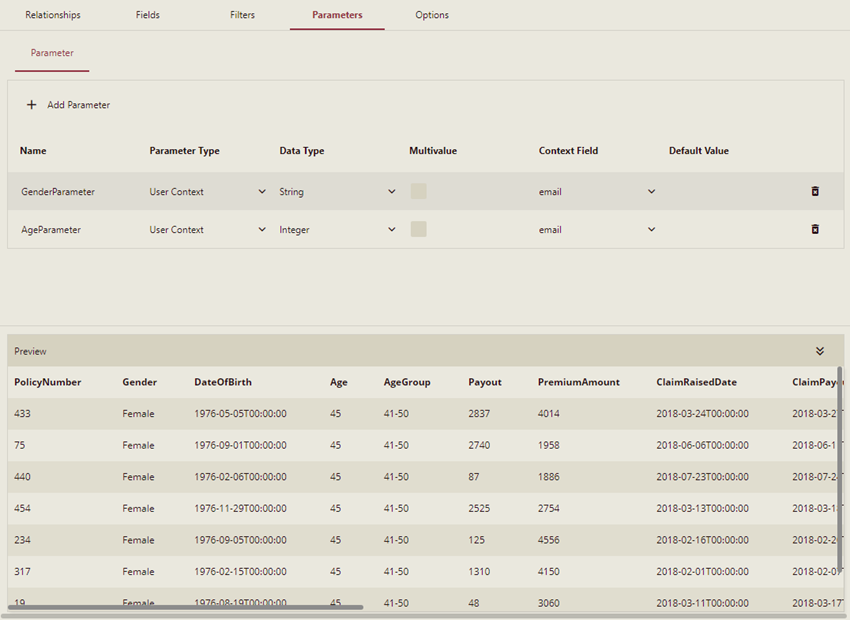
Add Parameters
Fill-in the details to add a dataset parameter. The added parameters can be multivalue. You can choose the following as Parameter types:
User Context - choose from the user context (claims) in the Value field and select the data type. This parameter is applicable to the specified tenant.
Organization Context - choose from the organization schema added by admin, in the Value field, and select the data type. This parameter is applicable to the specified group of users.
Constant - select the data type and specify its default value.
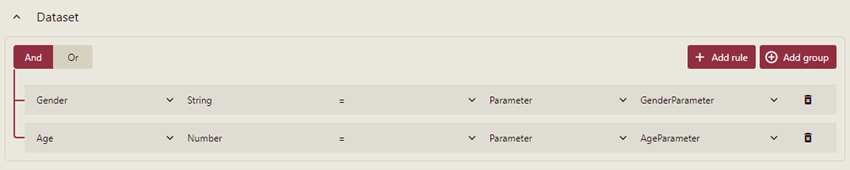
Go back to the Filters tab and set the added parameters in the Value fields as shown below.
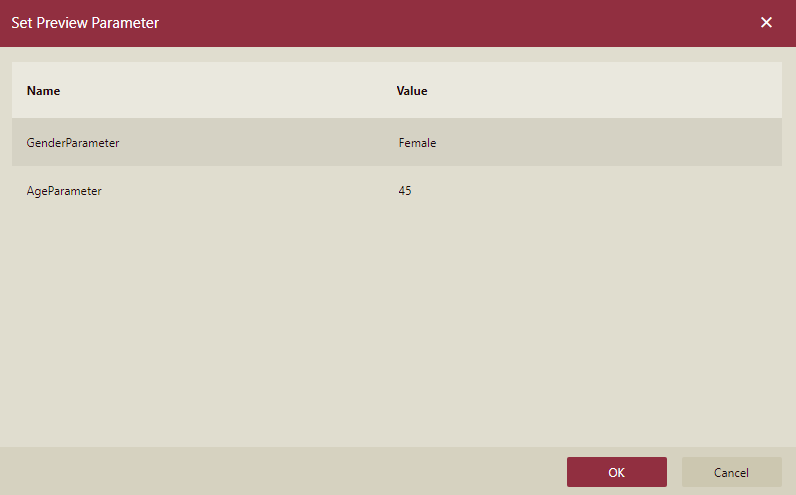
Enter the parameter values in the Set Preview Parameter dialog. For example, enter 'Female' for GenderParameter and '45' for AgeParameter, and then click OK.
Click Preview to view the dataset.
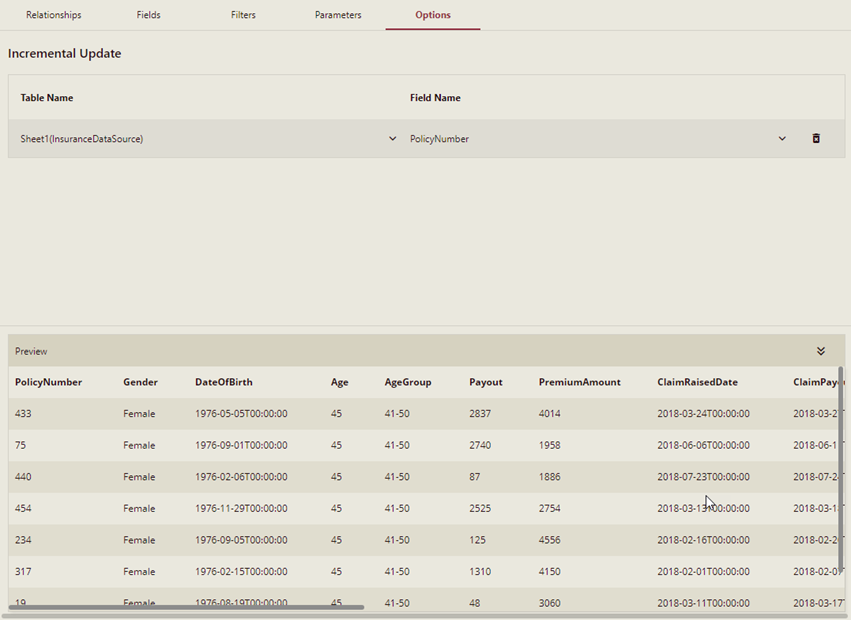
Add Options
Use this tab to add an option to configure the incremental update setting for a dataset. Click the Add button to add a field as an incremental update setting.
Select the Table Name and Field which need to use the incremental update setting. Note that an incremental update occurs only on a single database.
Click Preview to fetch for any incremental data rows in the dataset.
Finally, click Save, enter the name of the dataset, specify the category and enter a comment, and click Save to save the dataset.
You can view the added dataset in the Categories tab of the Resource Portal.
Note: To add custom table in the cached dataset, you can refer the Add Custom Table topic.