Creating Custom Visualization
You can take advantage of custom visualization possibilities, provided by Wyn Enterprise, that meets your unique visualization demands. To do that, you must first create a custom visualization project and then add it as your visualization plugin on WynDashboards.
The steps to work with custom visuals are as follows:
Install the build tools package from the WynEnterprise npm library globally.
npm install @wynenterprise/wyn-visual-tools -gCreate a custom visual project and install the dependencies.
wyn-visual-tools initProvide the name of the visual in the command prompt.
Start the developer server.
wyn-visual-tools developThe developer server starts on the localhost. You can specify the port by option '-p'. The default port is 3000. See the folder structure of the custom visual project here.
Note: The Administrator should enable the developer mode. In the Admin Portal > Dashboards Settings, set Enable Developer Mode to True.
To open the Dashboard Designer, go to Document Portal > Create Dashboard.
From Custom Visualization, drag-drop the 'Dev Tools' scenario onto the design area.
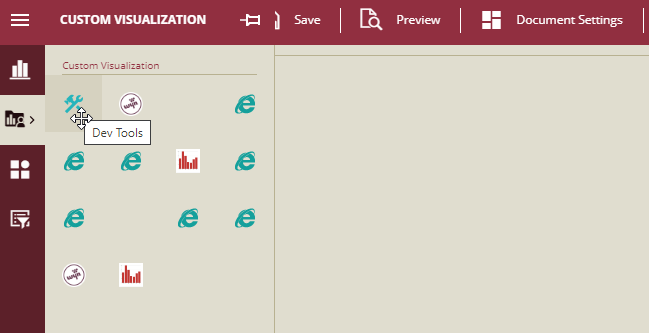
Modify the meta-information for the custom visual in the visual.json file such as its unique ID, name, display name, icon, description, etc.
Edit the configuration details about the data binding, inspector, and action bar, etc. in the capabilities.json file.
Add i18n resource to the i18nResources folder. This step is optional.
Add the images to the assets folder. This step is optional.
Develop the custom visual using visual API. We suggest developing it by 'Typescript' and 'Less'. The workflow is already available to make it easy to build.
Click the Refresh button on the action bar to refresh the scenario and load the custom visual.
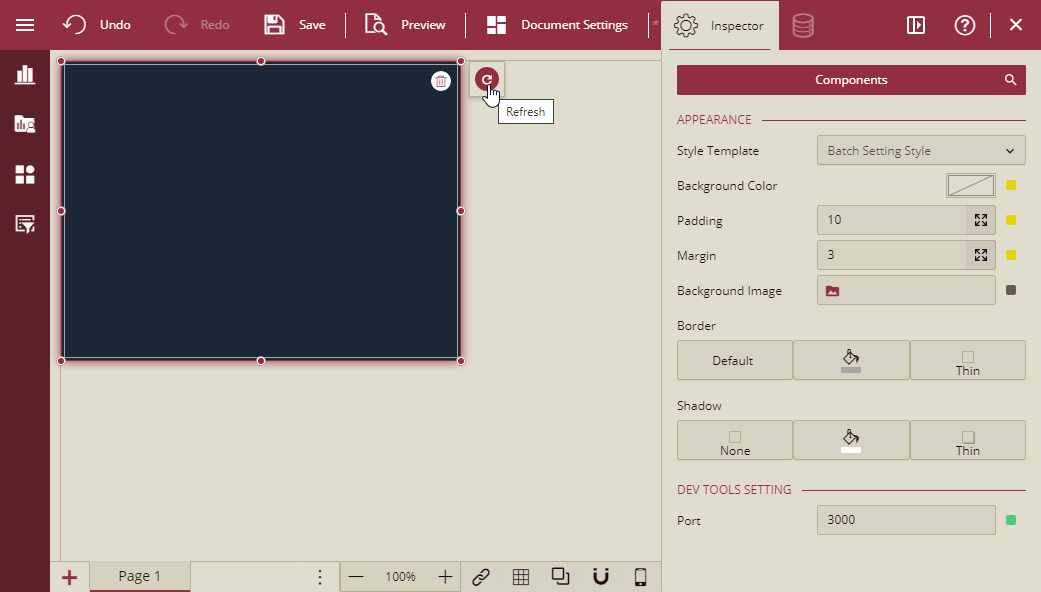
A port can be specified if it is necessary from the Inspector tab on the right side of the designer.
Update the version number in the package.json file each time you modify the custom visual. This helps in differentiating the old and new versions of the visual.
Pack the visual by using build tools to get a .viz file on your project root. Run the following command in the folder where your custom visual source is located.
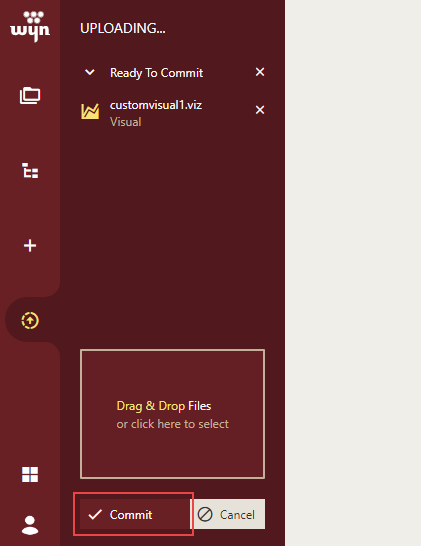
wyn-visual-tools packageUpload the .viz file to the Resource Portal.
The .viz file is now successfully uploaded to the server.
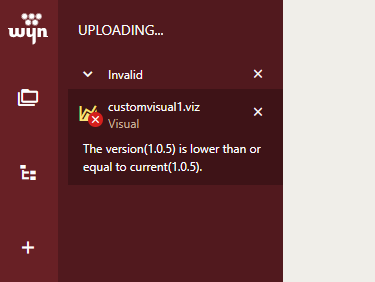
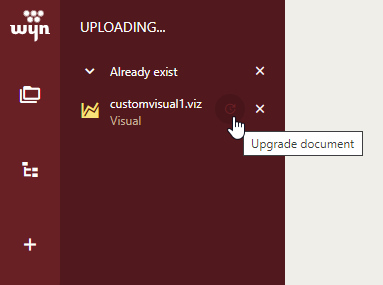
If you upload a .viz file whose version number is equal to or less than that of the existing file on the server, it will display an error.
If you upload a .viz file whose version number is greater than that of the existing file on the server, it will upgrade the visual.
Finally, open the Dashboard Designer to use the uploaded custom visual in your dashboard.
Go to this link for samples on custom visualizations for Wyn Dashboards.
Custom Visual Project
The folder structure of the custom visual project is as follows:
assets: This folder is for assets. At present, only image is supported. The image used by definition will be encoded to base64 string.
i18nResources: This folder is for the 'i18n' file.
src/visual.ts: The entrance of your visual.
style: The 'Less' code.
visual.json: Provide some meta info about this visual.
id: The unique ID for the custom visual.
name: The name of custom visual.
displayName: The display name in dashboard designer.
icon: The icon for the custom visual available in assets.
description: The description of the visual.
externalJs/externalCss: The external javascript/css code.
assets: The name of the image, which is the only asset supported.
configuration: Some parameters for visual run time. Can be modified after uploading on Resource Portal.
capabilities.json: Contains information about the configuration - data binding, properties on inspector tab, and action bar.
dataBinding: Describes the aggregation of the visual.
options: Describes the properties of the visual.
actions: Describes the action bar of the visual.
analysis: Describes the analysis panel of the visual.


