-
Interactive DashboardsCreate interactive BI dashboards with dynamic visuals.
-
End-User BI ReportsCreate and deploy enterprise BI reports for use in any vertical.
-
Wyn AlertsSet up always-on threshold notifications and alerts.
-
Localization SupportChange titles, labels, text explanations, and more.
-
Wyn ArchitectureA lightweight server offers flexible deployment.
-
 Wyn Enterprise 7.1 is ReleasedThis release emphasizes Wyn document embedding and enhanced analytical express...
 -
 Choosing an Embedded BI Solution for SaaS ProvidersAdding BI features to your applications will improve your products, better serve your customers, and more. But where to start? In this guide, we discuss the many options.
-
Visual GalleryInteractive sample dashboards and reports.
-
BlogExplore Wyn, BI trends, and more.
-
WebinarsDiscover live and on-demand webinars.
-
Customer SuccessVisualize operational efficiency and streamline manufacturing processes.
-
Knowledge BaseGet quick answers with articles and guides.
-
VideosVideo tutorials, trends and best practices.
-
WhitepapersDetailed reports on the latest trends in BI.
-
 Choosing an Embedded BI Solution for SaaS ProvidersAdding BI features to your applications will impr...
 -

- Getting Started
- Administration Guide
-
User Guide
- An Introduction to Wyn Enterprise
- Document Portal for End Users
- Data Governance and Modeling
- View and Manage Documents
- Working with Resources
- Working with Reports
- Working with Dashboards
- Working with Notebooks
- Wyn Analytical Expressions
- Section 508 Compliance
- Subscribe to RSS Feed for Wyn Builds Site
- Developer Guide
Demo Dashboards
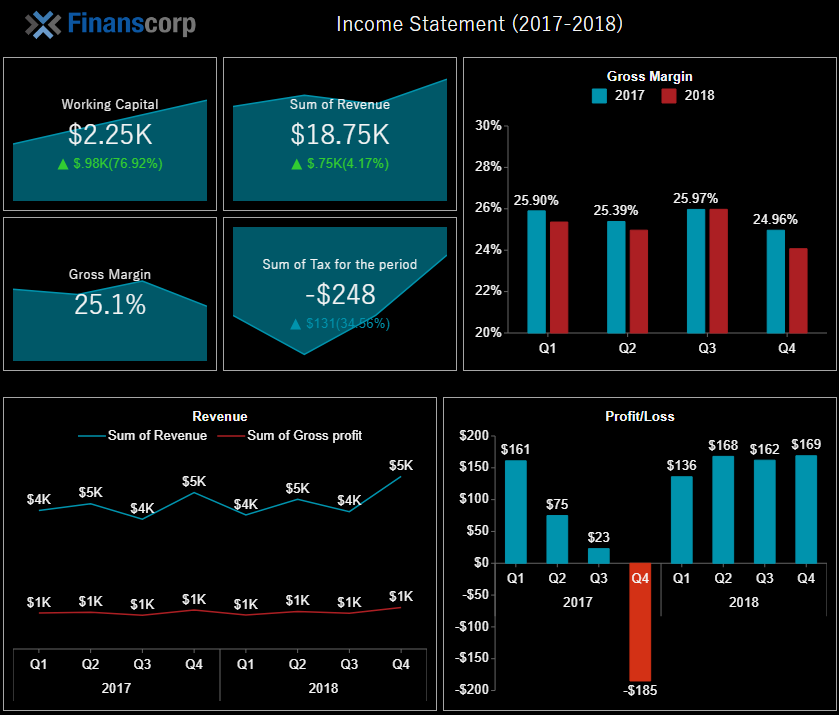
Income Statement Dashboard
The Income Statement dashboard provides information about the financial KPIs to track and monitor the company's revenue sales, profits, and expenses in real-time and also lets you focus on the important areas that need immediate attention. Have a look at the following income statement dashboard showcasing the company insights on liquidity, sales revenue, costs, and expenses. This dashboard centers around the four important KPIs - working capital, sum of revenue vs planned revenue, gross margin, and sum of tax for the period. With the help of KPI charts, you get a quick glance over these company's insights. The gross margin indicates the financial health of the company; higher the gross margin more closer is a company to achieve a healthy net profit. While, the profit loss helps the user to evaluate the business's net profit.
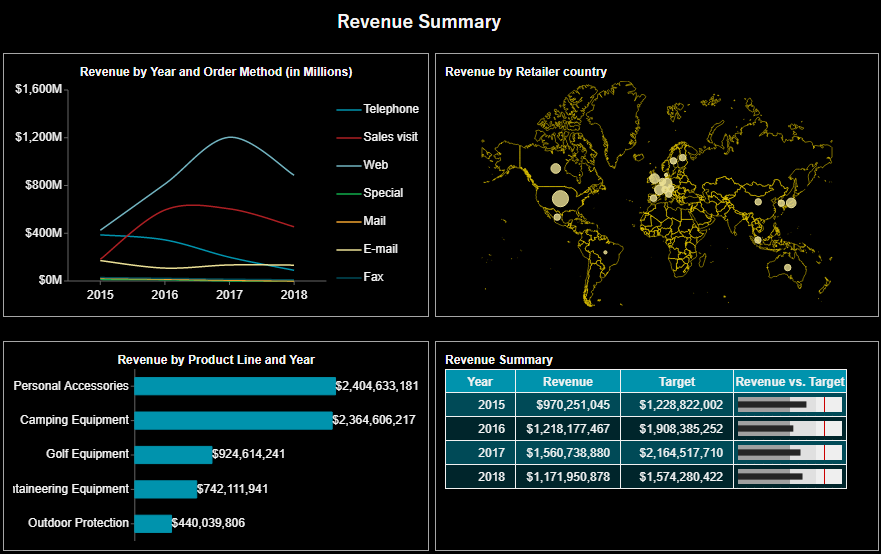
Revenue Summary Dashboard
Revenue Summary Dashboards are generally used by the organizations and companies to help the executives and CFOs to track and analyze the revenue performance. The main functionalities of the revenue summary dashboard is to display the trend in the company's total revenue and the other major categories of revenue like order type, product sales, etc. Have a look at the following revenue summary dashboard. The line chart displays the trend in revenue by the different order method types like web, sales visit, telephone, e-mail, fax, mail, and special. The map chart highlights the revenue by retailer companies; larger the bubble size larger is the revenue for that specific country. The horizontal bar graph indicates the revenue by different product lines, that is, personal accessories, camping equipment, golf equipment, mountaineering equipment, and outdoor protection. The pivot chart compares the revenue and target figures.
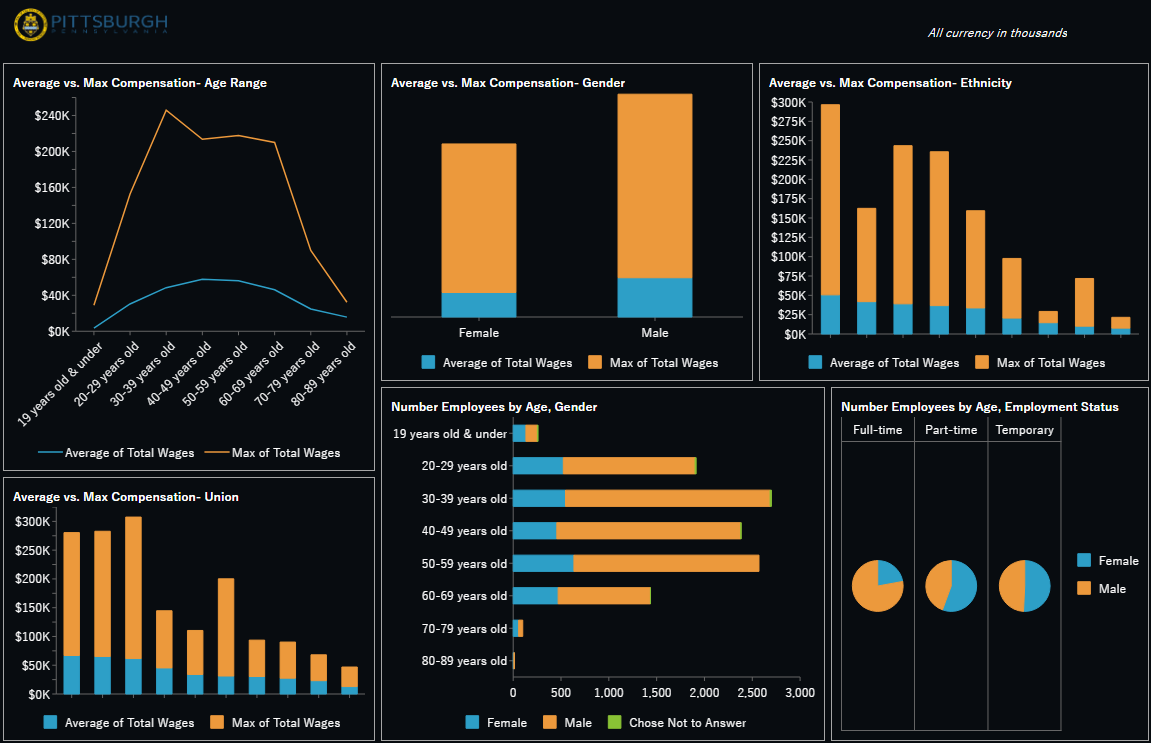
Employee Demographics Dashboard
Employee Demographics (Payroll) Dashboard is considered as an HR dashboard that helps the Human Resource team to track and analyze the HR KPIs. It is essential for HR executives to deeply analyze the demographic details of an employee to maintain a diverse workforce. The demographic details include information on employees' gender, age, ethnicity, and employment status. Have a look at the following employee demographics dashboard.