-
Interactive DashboardsCreate interactive BI dashboards with dynamic visuals.
-
End-User BI ReportsCreate and deploy enterprise BI reports for use in any vertical.
-
Wyn AlertsSet up always-on threshold notifications and alerts.
-
Localization SupportChange titles, labels, text explanations, and more.
-
Wyn ArchitectureA lightweight server offers flexible deployment.
-
 Wyn Enterprise 7.1 is ReleasedThis release emphasizes Wyn document embedding and enhanced analytical express...
 -
 Choosing an Embedded BI Solution for SaaS ProvidersAdding BI features to your applications will improve your products, better serve your customers, and more. But where to start? In this guide, we discuss the many options.
-
Visual GalleryInteractive sample dashboards and reports.
-
BlogExplore Wyn, BI trends, and more.
-
WebinarsDiscover live and on-demand webinars.
-
Customer SuccessVisualize operational efficiency and streamline manufacturing processes.
-
Knowledge BaseGet quick answers with articles and guides.
-
VideosVideo tutorials, trends and best practices.
-
WhitepapersDetailed reports on the latest trends in BI.
-
 Choosing an Embedded BI Solution for SaaS ProvidersAdding BI features to your applications will impr...
 -

- Getting Started
- Administration Guide
-
User Guide
- An Introduction to Wyn Enterprise
- Document Portal for End Users
- Data Governance and Modeling
- View and Manage Documents
- Working with Resources
- Working with Reports
- Working with Dashboards
- Working with Notebooks
- Wyn Analytical Expressions
- Section 508 Compliance
- Subscribe to RSS Feed for Wyn Builds Site
- Developer Guide
Data Flow Designer
Starting with Wyn Enterprise 9.0, using the Data Flow Designer, you can create Data Flows where you can perform transformations on the data fetched from operational systems which helps reduce the load on these systems. A Data Flow is a graph of ETL Commands (Extract, Transform and Load) that starts with one or more Input Sources, connected to ETL commands which transform the data and ends with one or more Output Targets.
Using the Data Flow Designer, you can visually design a data flow where data is loaded from data sources and passed through transformation commands. You can access these data flows directly from a cached data model to create entities in the data model from the output targets. You can also execute the data flow from the resource portal which generates data files for each output in the data flow. These data files can be loaded in direct data models or cached datasets as well as in reports.
Create a Data Flow
Data flows can be created in the Resource Portal. Click the Create (+) menu in the side navigation bar and choose Data Flow. The Data Flow Designer opens and looks as shown in the following screenshot:
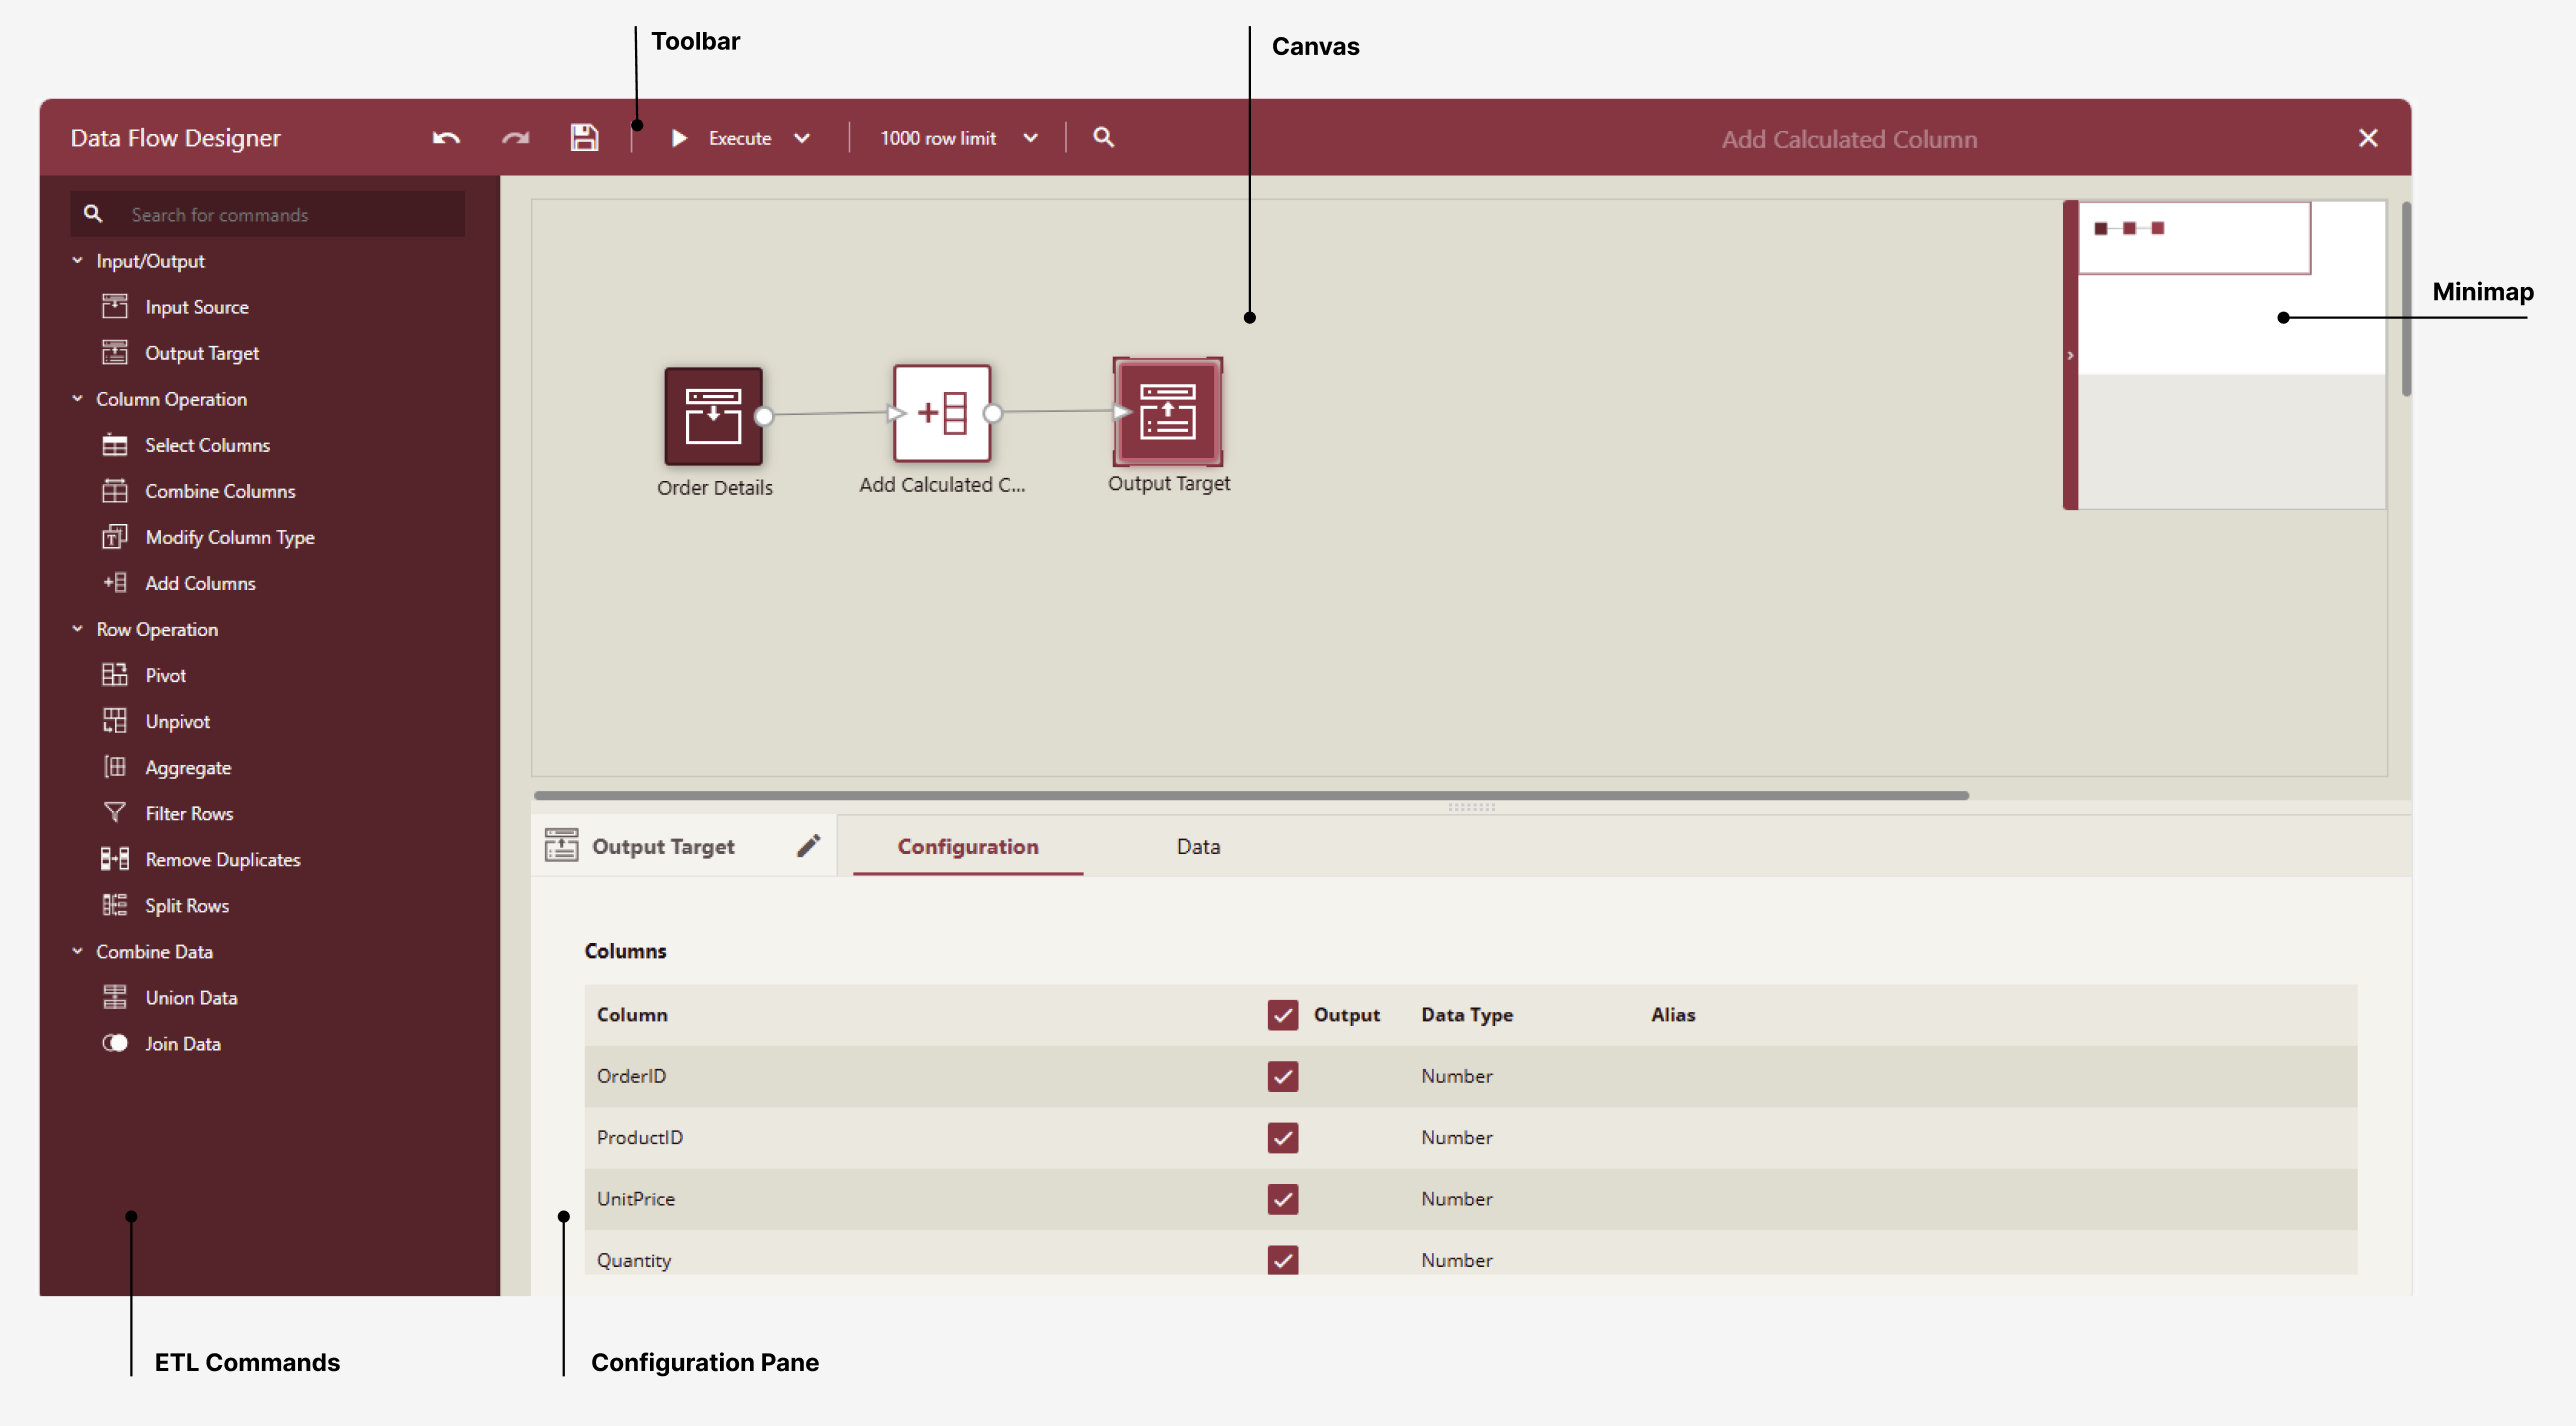
The Data Flow Designer is a drag-and-drop designer where you drag commands from the ETL Commands pane to the canvas and connect them to form a data flow or pipeline. A Data Flow consists of one or more Input Sources connected to transformation commands and must end with one or more Output Target. One data flow file can contain many flows or pipelines starting with an input and ending with a target output. You connect the output of one or more commands with an arrow to the input of another transformation command to form a flow. Each ETL command must be configured and given a name. The result sets of the Output Target(s) are the result sets of the flow that can be cached as Data Files. The data flow cannot be validated or saved unless it has at least one Output Target.
If you click anywhere on the canvas and drag around one or more commands, a context menu appears that allows you to remove the selected command(s) or duplicate them.
The Data Flow designer consists of the following elements:
Command Pane: The commands pane contains the transformation commands that you can drag and drop on the Data Flow canvas.
Toolbar: The toolbar has buttons to undo, redo, save, execute, and search for commands in the data flow. You can execute the flow on all the rows in the input sources, or for speed during design by setting a limit on the number of rows fetched. There is also a search box to search for used commands by name; the first match will open the configuration of the found command.
The Save button is enabled only when the ETL flow is valid. One common reason for a data flow not to be valid is a missing Output Target.
Canvas: To design a data flow, you drop ETL commands from the Command Pane to the ETL canvas and connect them to form a transformation flow. When you select a command, its configuration pane gets displayed, where you can change its settings. To remove a command or a connector, hover over it and click the Recycle Bin button. A yellow icon with an exclamation mark will appear on an ETL command if it is not properly configured.
MiniMap is a miniature map of the flow, which helps you control the visible part of a large data flow. You can move the rectangle area in the minimap to control which part of the data flow is visible on the canvas.
Configuration Pane: When an ETL command is selected on the canvas, its configuration pane is displayed, where you can change its settings. The configuration pane differs from one command to the other, but all commands have a name that you can change and a Data tab that displays the result set, which is the output of the selected command.
The configuration panel for all ETL commands has one configuration tab that is different for each command, but all commands can be renamed and their outputs can be previewed in the Data tab.
Execute a Data Flow
As you design your data flow, you can click the Execute button in the toolbar and check the results of the pipeline in the output target(s). By default, the flow will fetch the first 1000 rows for each Input Source, but you can increase or remove the row limit in the toolbar.
You can use the data flow directly in a cached data model. If you need to use the data flow results in a direct data model or cached dataset, navigate to the data flow in the resource portal and choose "Execute Workflow..." to generate a data file for each output target in the data flow. You can view these flows in the Resource portal by navigating to Document Types -> Data File. The files will be named after the Output Target commands with the name of originating data flow appended in brackets. Make sure you name your output targets appropriately.