- Getting Started
- Administration Guide
- User Guide
- Developer Guide
Data Binding in Reports
The connection between a report and a dataset is known as data binding. When you connect a report to a dataset, the report extracts the information from the data source to display the required data.
With the help of the Data panel, you can connect your report to the desired dataset. The Data panel categorizes the data sources into server, new based on model entity, and new based on server data source. In this article, you will learn about the types of datasets available in the Wyn report designer, steps to connect a report to a dataset, and the different ways to manage a dataset in a report.
Types of Datasets
This section elaborates about the different types of datasets supported in Wyn Enterprise:
Server: Datasets that are created using the report dataset designer and can be shared across many different reports. You can add this dataset type when you want to use the dataset in more than one report.
New Based on Model Entity: Datasets created from a data model. These datasets are used to create ad-hoc reports. For information on creating a model entity, see this topic.
New Based on Server Data Source: Datasets that are defined in the report itself and are used only by that report. This means you are embedding a dataset in a report. To use such a dataset type in a report, you should have prior knowledge of SQL.
To Bind a Dataset to a Report
The following sections describe the different ways to bind a dataset to a report in Wyn Enterprise.
Method 1: Using Server
Consider a scenario where you want to use a dataset already available on the Wyn Server. Such a dataset type is extremely useful for non-technical users since configuring the dataset requires no SQL queries, parameters, or other related data options.
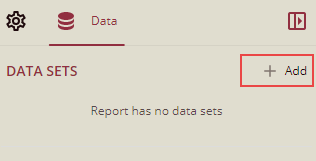
In the Report Designer, go to the Data panel and click Add.
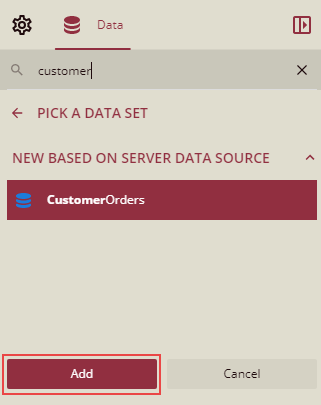
Select a suitable dataset listed under the Server category such as 'Customer Orders', and then click the Add button.
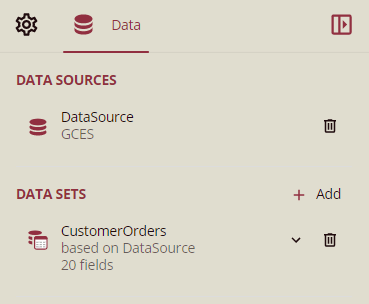
The 'CustomerOrders' dataset is now added to your report.
Method 2: Using New Based on Model Entity
Let's suppose, you want to create an ad hoc report for real-time data visualization and exploration. This is only possible when you bind a report to a model entity. A data model helps to transform the technical data structures from database tables and views into real-world entities, attributes, and relationships. It also helps to improve the readability of the data.
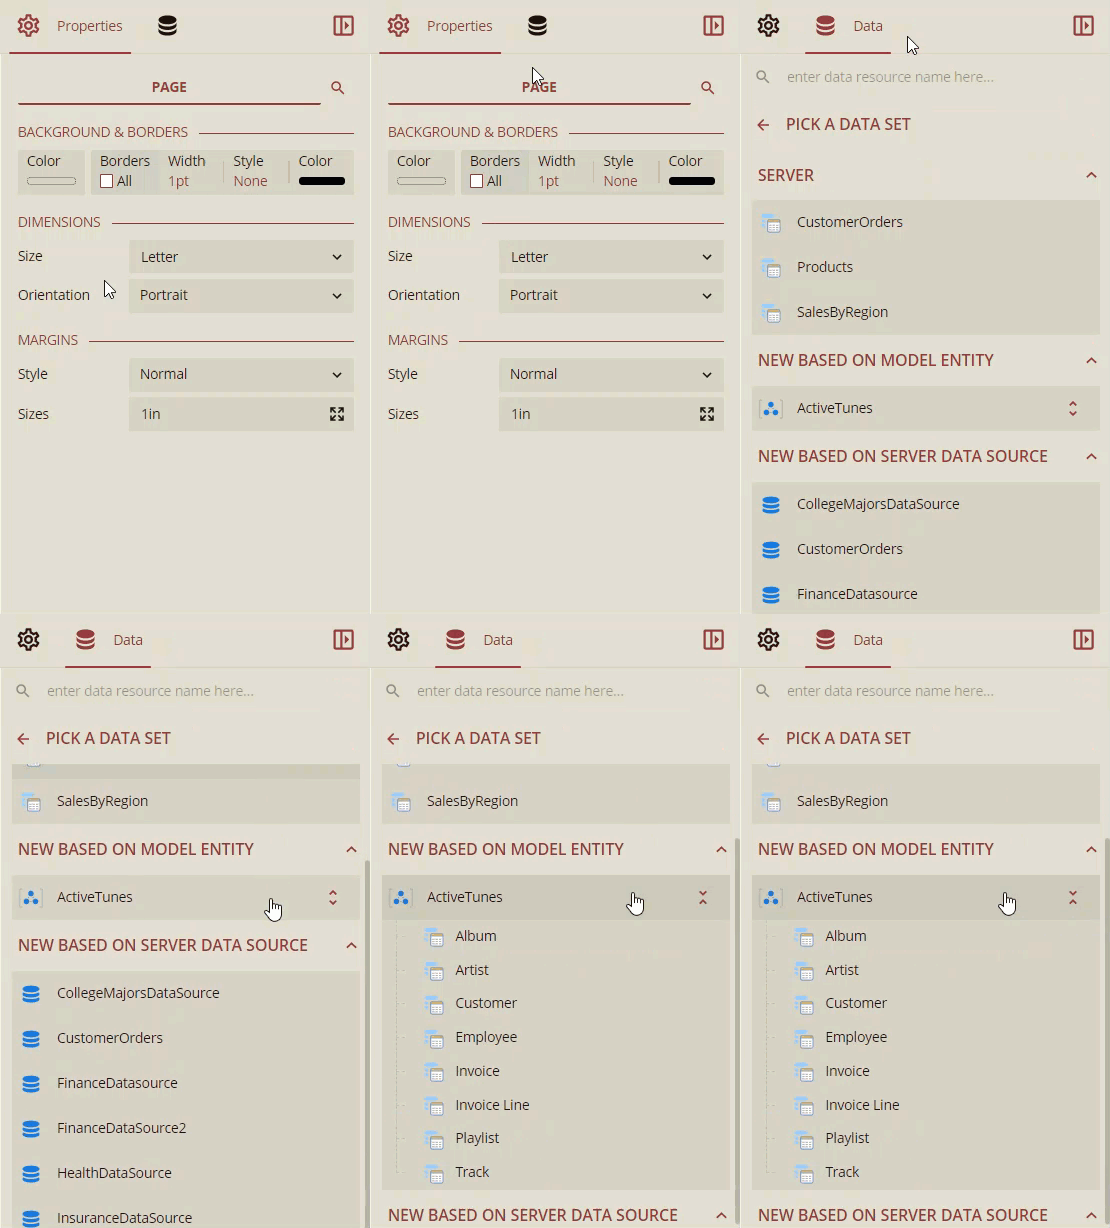
In the Report Designer, go to the Data panel and click Add.

Select a suitable model listed under the New Based on Model Entity category such as 'ActiveTunes'. A list of available entities in the model is displayed on selection.
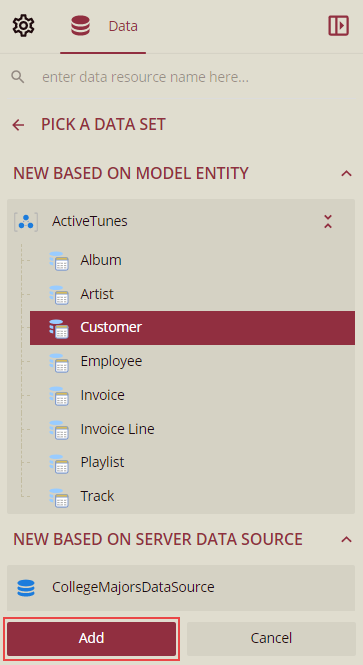
From the list, choose a model entity, say 'Customer' and then click the Add button to proceed further.
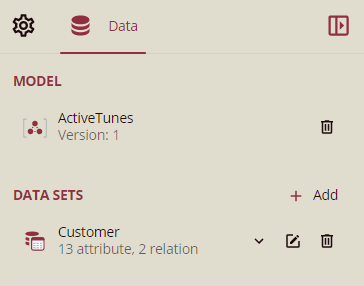
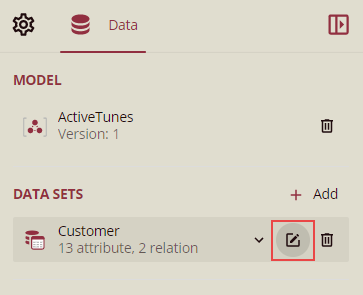
 The 'Customer' model entity is now added to your report.
Method 3: Using New Based on Server Data Source
Let's say, you want to fetch data from a data source to be used only in one report. Apart from this, you want to configure its related data options such as fields, parameters, and filters to display only the required information in the report.
In the Report Designer, go to the Data panel and click Add.

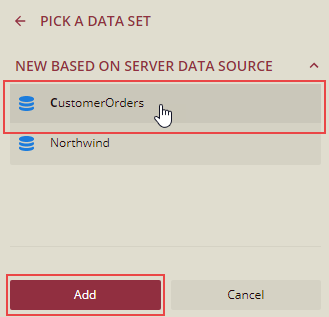
Select a suitable dataset listed under the New Based on Server Data Source category such as 'Customer Orders', and then click the Add button.
In the Edit Data Set dialog that appears, provide the query, field, and other settings for the chosen dataset as shown in the next steps.
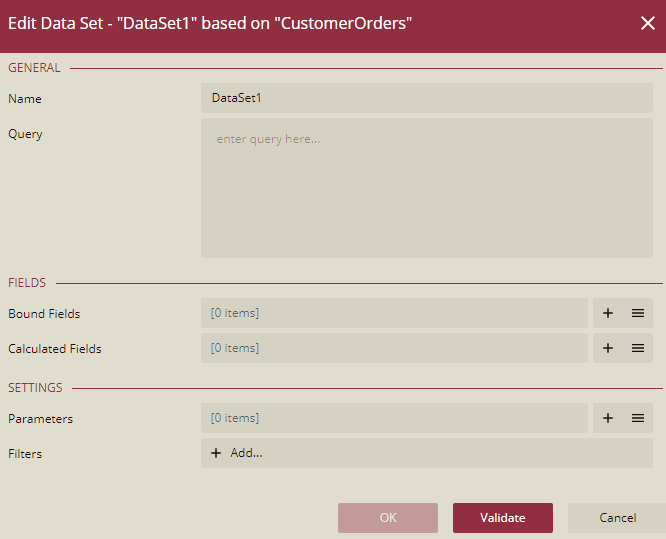
Enter the name of the dataset in the Name field such as 'CustomerOrdersDataset'. By default, this field is set to 'Dataset1'. Note that the dataset name should not contain any empty spaces or special characters ('-', '/', '@', etc).
In the Query field, write an SQL query to extract the data from the data source.
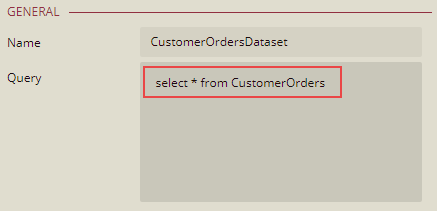
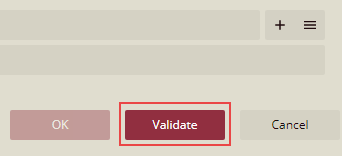
Click the Validate button to verify the SQL statement.
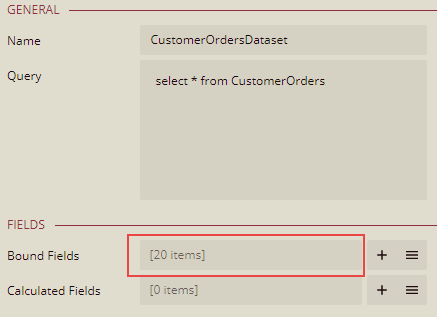
If the SQL query is successfully validated, you will see a count of queried fields against the Bound Fields field.
Click the Show Items button
 to view the entire list of bound fields in the dataset. Here, field names are the names given to the fields in a dataset, while the data fields are the original names of the fields in the database, which should not be modified or renamed.
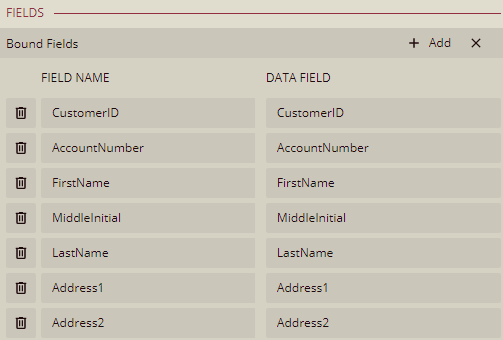
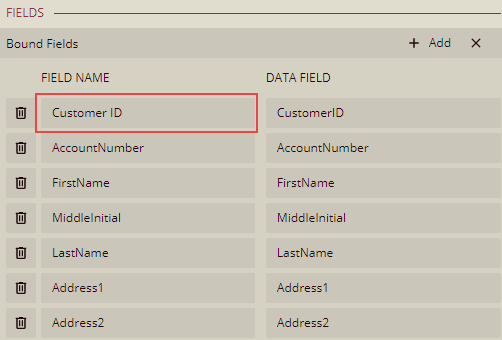
By default, field names show the same names as the data fields. You can modify a field name by simply replacing its old name with the new name as shown below.
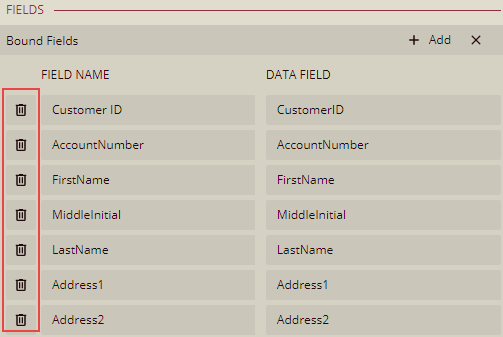
To delete a field, click the Delete icon
 adjacent to the field name in the list. Note that, deleting a field here will not affect the actual data stored in the data source.
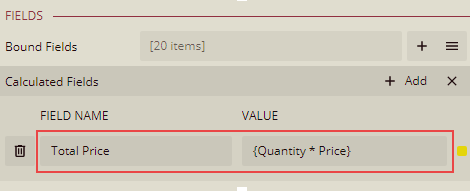
Add a calculated field in the dataset to create a new field by applying some calculations to the existing data. You can add a calculated field using the Add button
 . For example, in the below dialog, we have created a new calculated field 'Total Price' to determine the total product cost for a customer.
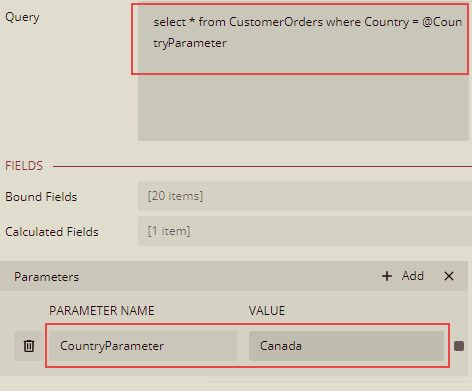
In the Parameters field, you can add report parameters and then use the 'where' clause in the SQL query to filter the data. For example, create a parameter namely 'Country' and set its value to 'Canada', and then update the SQL statement accordingly to filter the data based on the parameter value as shown.
To display only relevant data in the report, use filtering in the dataset. The Filters field is especially useful when you have a data source like XML that does not support query parameters.

Finally, click the Validate button to verify the dataset definition, and then the OK button to proceed further.
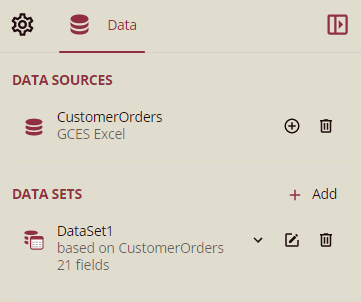
The dataset is now added to the report.
To Manage a Dataset in a Report
This section describes the different ways to manage a dataset in the report designer.
Edit a Dataset: Modify the existing details for a dataset by changing its name, parameter value(s), field name(s), filter value(s), and so on.
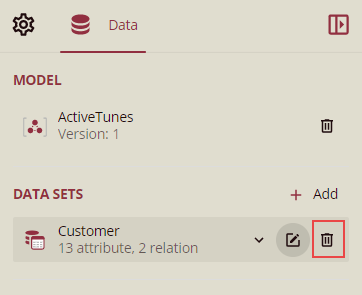
Delete a Dataset: Removes the bound dataset from the report.
