


Common
The common dashboard settings let you configure the maximum aggregated data points, enable the developer mode in the dashboard designer, and allow certified custom visuals to run in iframe or div. To set the common dashboard settings, navigate to Dashboard > Common on the Admin Portal.
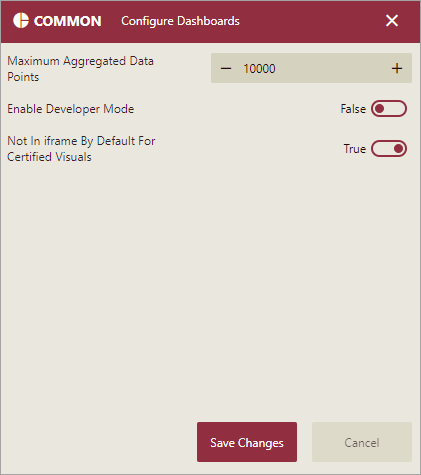
Configure Common Dashboard Settings
The common dashboard settings and their descriptions are given in the following table.
Setting | Description |
|---|---|
Maximum Aggregated Data Points | Defines the maximum aggregated data points when the dashboard backend calculates the aggregation data. The default value is 10,000. The minimum value is 1. |
Enable Developer Mode | Controls the visibility of the Developer Tools, used to debug the custom visualization files in the dashboard designer. |
Not in iframe By Default For Certified Visuals | Lets you specify whether to run the certified visuals in an iframe or div. When you set this option to 'True', the default value for the Run In Iframe option on the Visualization interface changes to 'False' if the visual is certified. However, the default value for the Run In Iframe option remains 'True' if the visual is not certified. |