- Getting Started
- Administration Guide
- User Guide
- Developer Guide
Use Cases
Case 1: Actual Sale Profit
Requirement
In this case, we will calculate the actual sales profit using the category name as a dimension. The formula for calculating the actual sales profit is:
(SaleAmount*(1-Discount)-UnitPrice)*QuantitySteps for creating a dashboard
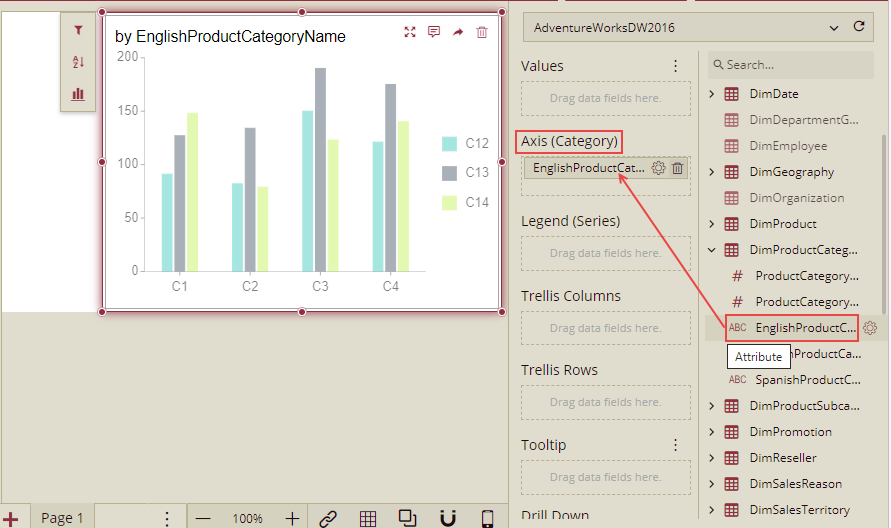
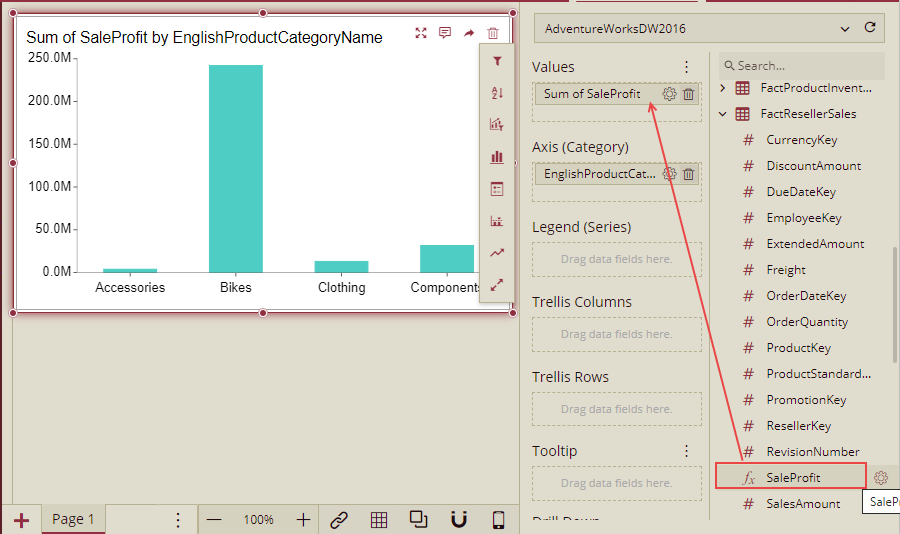
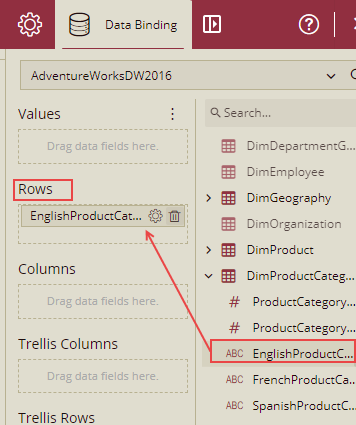
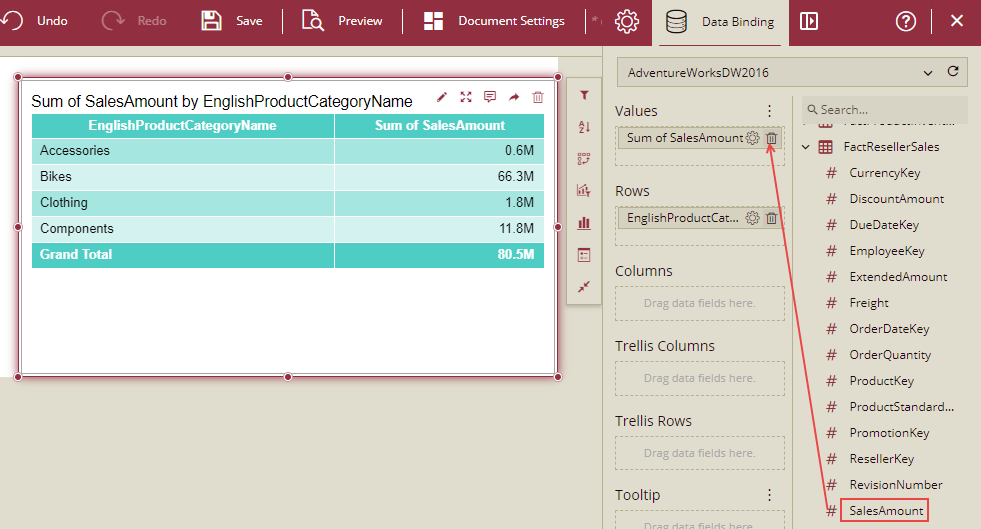
1.Drag a Column chart and drag the English Product category name to Axis.
2. Add a calculated column on Table 'FactResllerSales'.
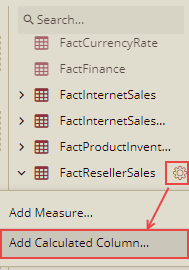
3. Input the expression given below and save it as SaleProfit. So the name of the Calculated Column will be SaleProfit.
('FactResellerSales'[SalesAmount]*(1-'DimPromotion'[DiscountPct])-'FactResellerSales'[UnitPrice])*'FactResellerSales'[OrderQuantity]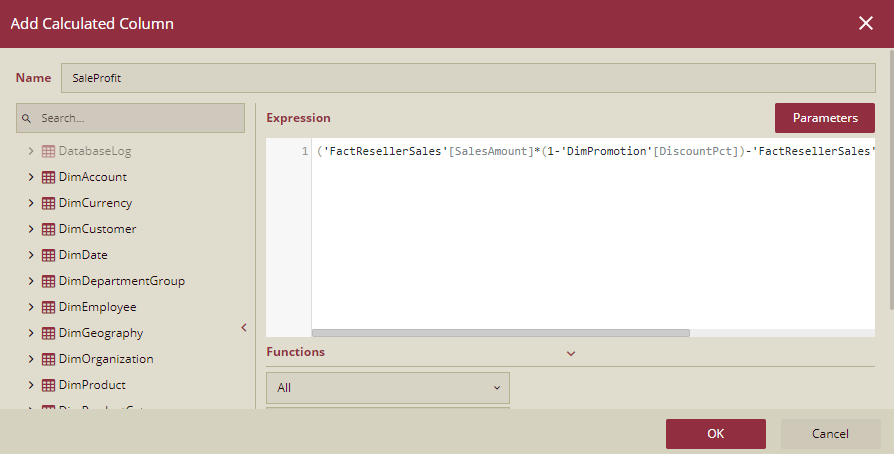
4. Drag the calculated column SaleProfit to the Values. Aggregation Method chooses sum.
Explanation
('FactResellerSales'[SalesAmount]*(1-'DimPromotion'[DiscountPct])-'FactResellerSales'[UnitPrice])*'FactResellerSales'[OrderQuantity]The calculated column above is a special column. We can use it as a normal column. It can be dragged to the dimension, values, filters, sort, etc.
The whole WAX is below for this dashboard request.
EVALUATE
SUMMARIZE(
    CALCULATETABLE(
        SELECTATTRIBUTES(
            'DimProductCategory'[EnglishProductCategoryName]
        )
    ),
    'DimProductCategory'[EnglishProductCategoryName],
    "FactResellerSales_SaleProfit_SUMX",
    CALCULATE(
        SUMX(
            CALCULATETABLE(
                ADDCOLUMNS(
                    SELECTATTRIBUTES(
                        FactResellerSales,
                        'DimProductCategory'[EnglishProductCategoryName]
                    ),
                    "FactResellerSales_SaleProfit",
                    (
                        (
                            (
                                'FactResellerSales'[SalesAmount]
                                -
                                (
                                    1
                                    -
                                    'DimPromotion'[DiscountPct]
                                )
                            )
                            -
                            'FactResellerSales'[UnitPrice]
                        )
                        *
                        'FactResellerSales'[OrderQuantity]
                    )
                )
            ),
            [FactResellerSales_SaleProfit]
        )
    )
)
Case 2: Transaction Analysis per Customer
Requirement
Per customer transaction refers to the average amount of goods purchased by each customer. The formula used is:
Sum(SaleAmount)/Count(CustomerID)In this case, we will analyze the Sum(SaleAmount)/Count(CustomerID) in each category.
Steps for creating a dashboard
1. Drag a Column chart and drag the English category name to Axis.

2. Add a measure on the table 'FactInternetSales'.
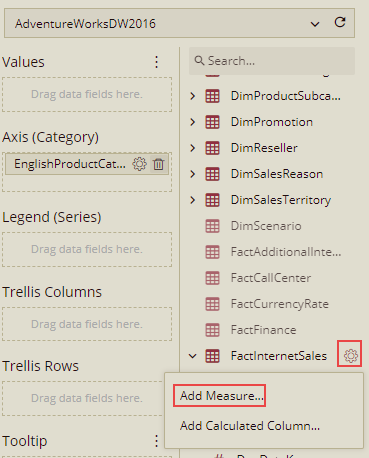
3. Input the expression given below and save it as MeasurePCT. So the name of the Measure will be MeasurePCT.
Sum('FactInternetSales'[SalesAmount])/count('FactInternetSales'[CustomerKey])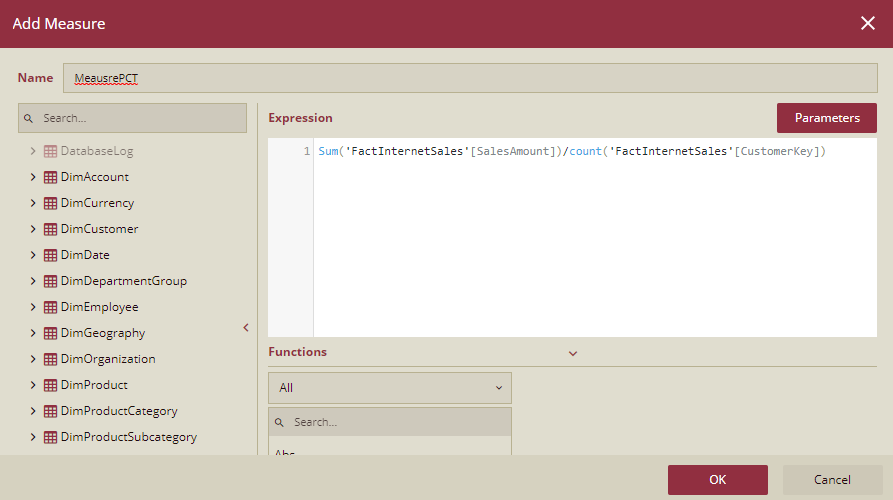
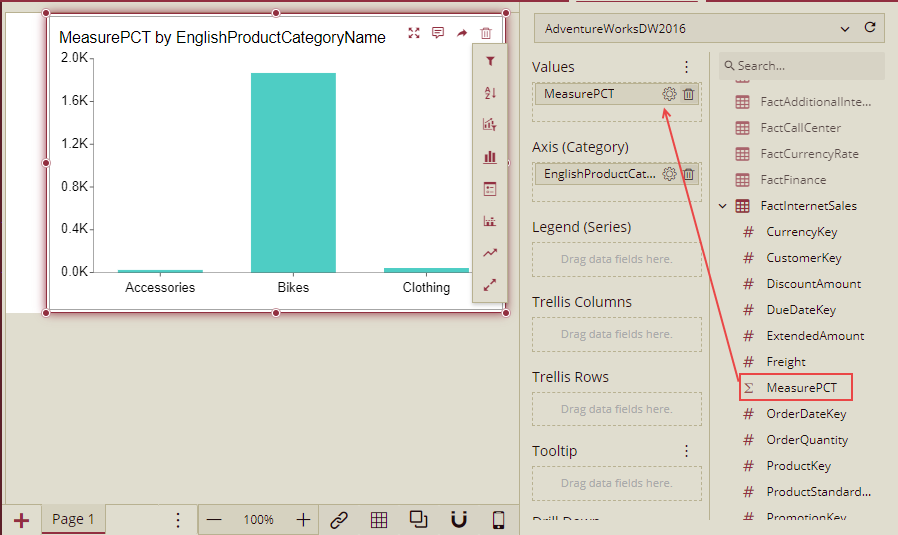
4. Drag the Measure MeasurePCT to the Values.
Explanation
sum('FactInternetSales'[SalesAmount])/count('FactInternetSales'[CustomerKey])The WAX above here is a measure. Measure, in this case, is the arithmetic operation of aggregation functions. The measure could be used directly. It does not allow to choose aggregation options or quick function options.
The whole WAX is below for this dashboard request.
EVALUATE
SELECTCOLUMNS(
    SUMMARIZE(
        CALCULATETABLE(
            SELECTATTRIBUTES(
                'DimProductCategory'[EnglishProductCategoryName]
            )
        ),
        'DimProductCategory'[EnglishProductCategoryName],
        "FactInternetSales_MeasurePCT",
        CALCULATE(
            (
                sum('FactInternetSales'[SalesAmount])
                /
                count('FactInternetSales'[CustomerKey])
            )
        ),
        "DimProductCategory_EnglishProductCategoryName_Order_null",
        CALCULATE(
            ROWNUMBERW(
                CALCULATETABLE(
                    DISTINCT(
                        SELECTATTRIBUTES(
                            DimProductCategory,
                            'DimProductCategory'[EnglishProductCategoryName]
                        )
                    )
                ),
                OrderBy(
                    'DimProductCategory'[EnglishProductCategoryName]
                )
            )
        )
    ),
    "DimProductCategory_EnglishProductCategoryName",
    'DimProductCategory'[EnglishProductCategoryName],
    "DimProductCategory_EnglishProductCategoryName_Order_null",
    [DimProductCategory_EnglishProductCategoryName_Order_null],
    "FactInternetSales_MeasurePCT",
    [FactInternetSales_MeasurePCT]
)
Case 3: Categorize fields based on calculations
Requirement
Add a new category field based on the calculation results.
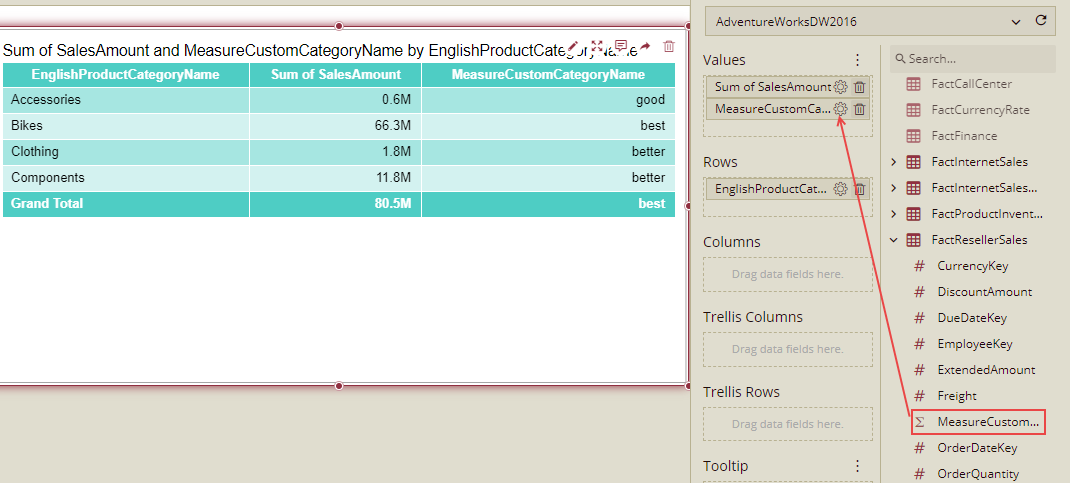
For example, if the sales amount < 1000000, the field value is 'good', if 12000000>sales amount >=1000000, the field value is 'better', if the sales amount >=12000000, the field value is 'best'.
Steps for creating a dashboard
1. Add a pivot table and bind fields in rows and values. Here we will drag the English category name to Rows.
2. From the FactResellerSales table drag SaleAmount to Values.
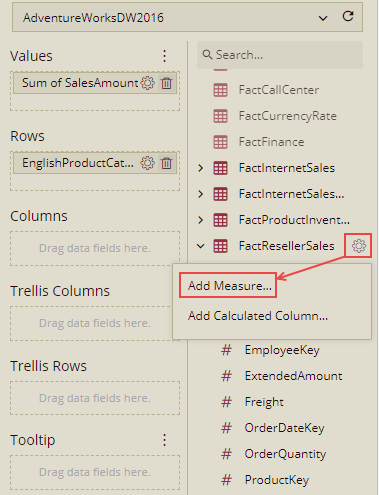
3. Add a Measure on Table 'FactResellerSales'.
4. Input the expression given below and save it as MeasureCustomCategoryName. So, the name of the Measure will be MeasureCustomCategoryName.
switch(true,sum('FactResellerSales'[SalesAmount]) < 1000000,"good",sum('FactResellerSales'[SalesAmount])>=1000000 && sum('FactResellerSales'[SalesAmount]) <12000000 ,"better",sum('FactResellerSales'[SalesAmount]) >=12000000,"best")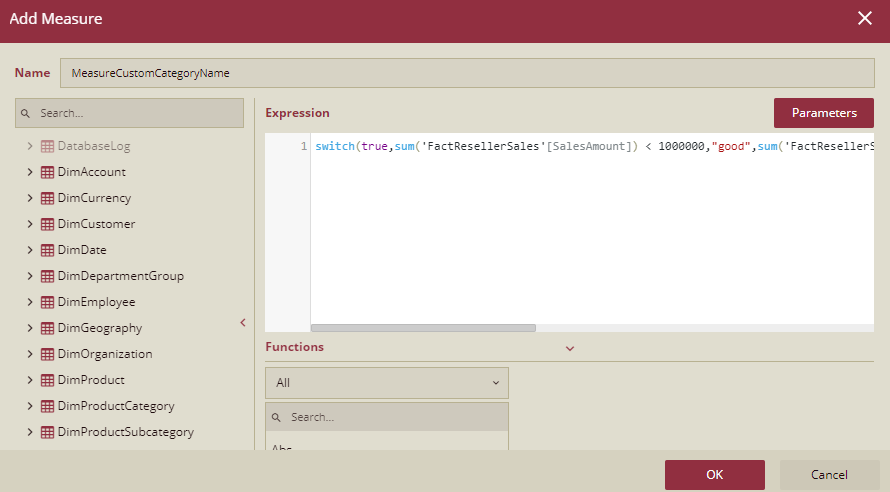
5. Drag the measure MeasureCustomCategoryName above to Values.
Explanation
switch(true,sum('FactResellerSales'[SalesAmount]) < 1000000,"good",sum('FactResellerSales'[SalesAmount])>=1000000 && sum('FactResellerSales'[SalesAmount]) <12000000 ,"better",sum('FactResellerSales'[SalesAmount]) >=12000000,"best")The WAX above is a measure. This uses the Switch function to implement this case, or you can use If function to do the same thing.
The Whole WAX is below:
EVALUATE
SELECTCOLUMNS(
    SUMMARIZE(
        CALCULATETABLE(
            SELECTATTRIBUTES(
                'DimProductCategory'[EnglishProductCategoryName]
            )
        ),
        'DimProductCategory'[EnglishProductCategoryName],
        "FactResellerSales_ MeasureCustomCategoryName _SUMX",
        CALCULATE(
            switch(
                True,
                (
                    sum(
                        'FactResellerSales'[SalesAmount]
                    )
                    <
                    1000000
                ),
                "good",
                (
                    (
                        sum(
                            'FactResellerSales'[SalesAmount]
                        )
                        >=
                        1000000
                    )
                    &&
                    (
                        sum(
                            'FactResellerSales'[SalesAmount]
                        )
                        <
                        12000000
                    )
                ),
                "better",
                (
                    sum(
                        'FactResellerSales'[SalesAmount]
                    )
                    >=
                    12000000
                ),
                "best"
            )
        ),
        "FactResellerSales_SalesAmount_SUMX",
        CALCULATE(
            SUMX(
                CALCULATETABLE(
                    SELECTATTRIBUTES(
                        FactResellerSales,
                        'DimProductCategory'[EnglishProductCategoryName],
                        'FactResellerSales'[SalesAmount]
                    )
                ),
                'FactResellerSales'[SalesAmount]
            )
        ),
        "DimProductCategory_EnglishProductCategoryName_Order_null",
        CALCULATE(
            ROWNUMBERW(
                CALCULATETABLE(
                    DISTINCT(
                        SELECTATTRIBUTES(
                            DimProductCategory,
                            'DimProductCategory'[EnglishProductCategoryName]
                        )
                    )
                ),
                OrderBy(
                    'DimProductCategory'[EnglishProductCategoryName]
                )
            )
        )
    ),
    "DimProductCategory_EnglishProductCategoryName",
    'DimProductCategory'[EnglishProductCategoryName],
    "DimProductCategory_EnglishProductCategoryName_Order_null",
    [DimProductCategory_EnglishProductCategoryName_Order_null],
    "FactResellerSales_ MeasureCustomCategoryName _SUMX",
    [FactResellerSales_ MeasureCustomCategoryName _SUMX],
    "FactResellerSales_SalesAmount_SUMX",
    [FactResellerSales_SalesAmount_SUMX]
)
Case 4: Cumulative Analysis
Requirement
Cumulative Analysis is generally used to do cumulative calculations.
Like:
Analysis of cumulative sales rate from Jan to Dec, or till present.
This year's sales completion rate, which is Sum(Cost) / Sum (Budget) for the whole year.
The sales completion rate until now, the result is Sum(Cost) / Sum (Budget) until now.
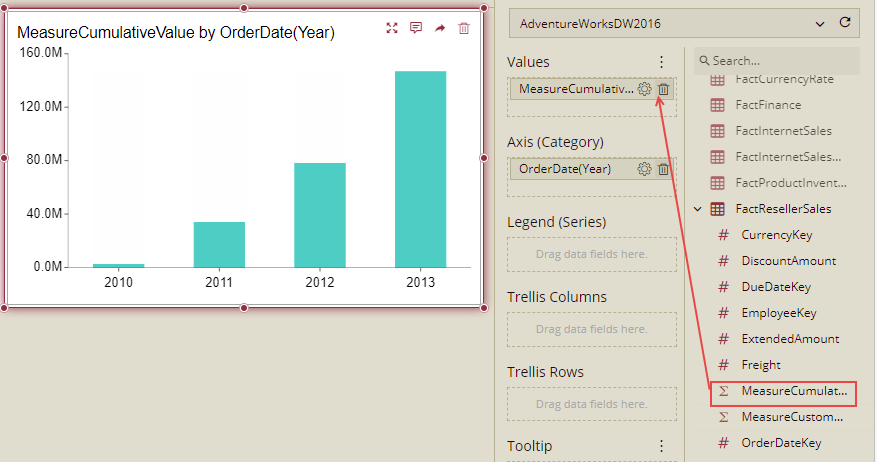
In this case, the cumulative value is the sum(SaleAmount), dimension is the year.
Steps for creating a dashboard
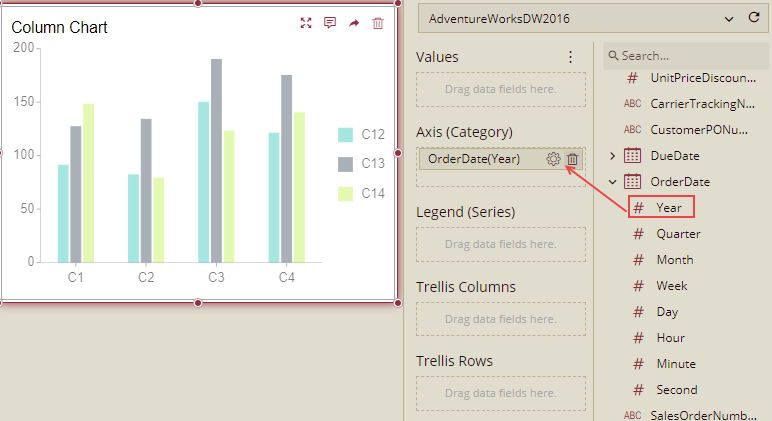
1. Drag a chart, drag OrderDate(Year) to the Axis.
2. Add a Measure on the table 'FactResllerSales'.
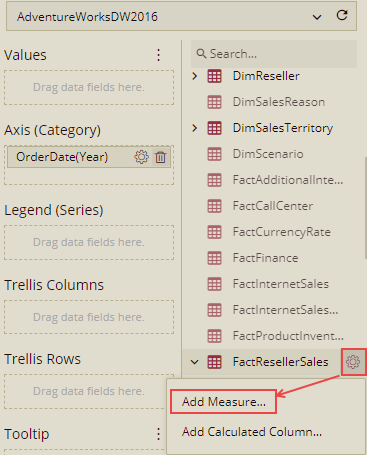
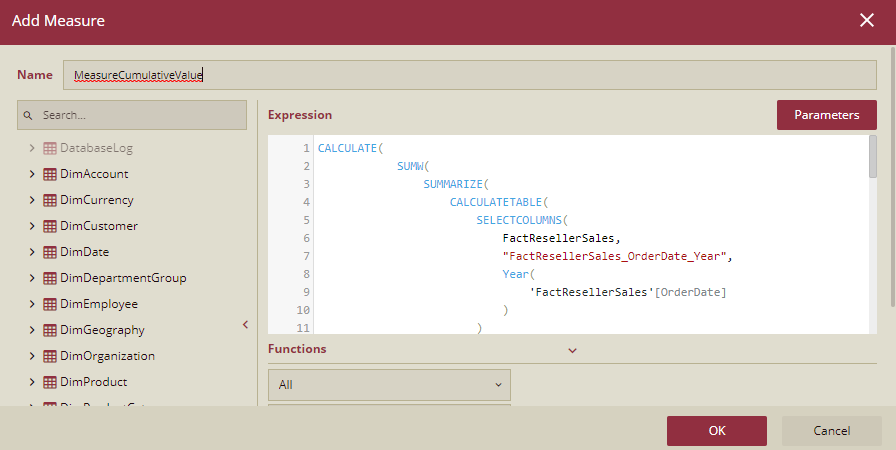
3. Input the expression given below and save it as MeasureCumulativeValue. So, the name of the Measure will be MeasureCumulativeValue.
CALCULATE(
            SUMW(
                SUMMARIZE(
                    CALCULATETABLE(
                        SELECTCOLUMNS(
                            FactResellerSales,
                            "FactResellerSales_OrderDate_Year",
                            Year(
                                'FactResellerSales'[OrderDate]
                            )
                        )
                    ),
                    [FactResellerSales_OrderDate_Year],
                    "FactResellerSales_SalesAmount_SUMX",
                    CALCULATE(
                        SUMX(
                            CALCULATETABLE(
                                ADDCOLUMNS(
                                    SELECTATTRIBUTES(
                                        FactResellerSales,
                                        'FactResellerSales'[SalesAmount]
                                    ),
                                    "FactResellerSales_OrderDate_Year",
                                    Year(
                                        'FactResellerSales'[OrderDate]
                                    )
                                )
                            ),
                            'FactResellerSales'[SalesAmount]
                        )
                    ),
                    "FactResellerSales_OrderDate_Year_Order_null",
                    CALCULATE(
                        ROWNUMBERW(
                            CALCULATETABLE(
                                DISTINCT(
                                    SELECTCOLUMNS(
                                        FactResellerSales,
                                        "FactResellerSales_OrderDate_Year",
                                        Year(
                                            'FactResellerSales'[OrderDate]
                                        )
                                    )
                                )
                            ),
                            OrderBy(
                                [FactResellerSales_OrderDate_Year]
                            )
                        )
                    )
                ),
                [FactResellerSales_SalesAmount_SUMX],
                OrderBy(
                    [FactResellerSales_OrderDate_Year_Order_null]
                )
            )
        )
4. Drag the measure MeasureCumulativeValue to Values.
Explanation
CALCULATE(
        SUMW(
            SUMMARIZE(
                CALCULATETABLE(
                    SELECTCOLUMNS(
                        FactResellerSales,
                        "FactResellerSales_OrderDate_Year",
                        Year(
                            'FactResellerSales'[OrderDate]
                        )
                    )
                ),
                [FactResellerSales_OrderDate_Year],
                "FactResellerSales_SalesAmount_SUMX",
                CALCULATE(
                    SUMX(
                        CALCULATETABLE(
                            ADDCOLUMNS(
                                SELECTATTRIBUTES(
                                    FactResellerSales,
                                    'FactResellerSales'[SalesAmount]
                                ),
                                "FactResellerSales_OrderDate_Year",
                                Year(
                                    'FactResellerSales'[OrderDate]
                                )
                            )
                        ),
                        'FactResellerSales'[SalesAmount]
                    )
                ),
                "FactResellerSales_OrderDate_Year_Order_null",
                CALCULATE(
                    ROWNUMBERW(
                        CALCULATETABLE(
                            DISTINCT(
                                SELECTCOLUMNS(
                                    FactResellerSales,
                                    "FactResellerSales_OrderDate_Year",
                                    Year(
                                        'FactResellerSales'[OrderDate]
                                    )
                                )
                            )
                        ),
                        OrderBy(
                            [FactResellerSales_OrderDate_Year]
                        )
                    )
                )
            ),
            [FactResellerSales_SalesAmount_SUMX],
            OrderBy(
                [FactResellerSales_OrderDate_Year_Order_null]
            )
        )
    )
Let us start with the outermost CALCULATE function.
The first parameter is required, and the filter is optional. In this case, we can remove calculate function.
Second, the SUMW function syntax is below:
SUMW(, [,PARTITIONBY([,[expression] [,...]])] [,ORDERBY( [(ASC|DESC)] [, [(ASC|DESC)] [,...] ] )] [,(ROWS|RANGE)( ((UNBOUNDED|) (PRECEDING|FOLLOWING) | CURRENT ROW) [,((UNBOUNDED|) (PRECEDING|FOLLOWING) | CURRENT ROW)])])
In this case, the optional clause is only order by sub-function.
Consider that:
Parameter <table>
The first parameter, <table>, is required. It can be a table or a table function, and the return value is a table. This parameter is very important and must contain columns of dimensions (for grouping), and values (which need to be calculated in the window function).
In the current case, a table is a function. We can see that it contains two values ("FactResellerSales_SalesAmount_SUMX", "FactResellerSales_orderDate_Year_Order_null") that need to be calculated in the window function, grouped by column (Year(OrderDate)).
The structure is as follows:
We can see that we use summarize function to generate a table. The first parameter is also a table (using table function), the second parameter is the dimension (need to group by), and the third, etc. parameter is the name and expression pair. The dimension name must follow the rule: if no need to extract datetime, the name is "tableName_columnName", if it needs to extract datetime, the name is "tableName_columnName_Type", and the type here could be year , month, day, hour, minute, second. The dimension name is case-insensitive.
Parameter <expression>
The second parameter <expression> is required. Here it could be an "unqualified" name which is from the first parameter <table>.
Parameter <OrderBy> clause
This parameter is optional. But if we want to calculate the cumulative value, this parameter is needed. This is also an "unqualified" name which is from the first parameter <table>.
The whole WAX is below:
EVALUATE
SELECTCOLUMNS(
SUMMARIZE(
CALCULATETABLE(
SELECTCOLUMNS(
FactResellerSales,
"FactResellerSales_OrderDate_Year",
Year(
'FactResellerSales'[OrderDate]
)
)
),
[FactResellerSales_OrderDate_Year],
"FactResellerSales_MeasureCumulativeValue_SUMX",
CALCULATE(
CALCULATE(
SUMW(
SUMMARIZE(
CALCULATETABLE(
SELECTCOLUMNS(
FactResellerSales,
"FactResellerSales_OrderDate_Year",
Year(
'FactResellerSales'[OrderDate]
)
)
),
[FactResellerSales_OrderDate_Year],
"FactResellerSales_SalesAmount_SUMX",
CALCULATE(
SUMX(
CALCULATETABLE(
ADDCOLUMNS(
SELECTATTRIBUTES(
FactResellerSales,
'FactResellerSales'[SalesAmount]
),
"FactResellerSales_OrderDate_Year",
Year(
'FactResellerSales'[OrderDate]
)
)
),
'FactResellerSales'[SalesAmount]
)
),
"FactResellerSales_OrderDate_Year_Order_null",
CALCULATE(
ROWNUMBERW(
CALCULATETABLE(
DISTINCT(
SELECTCOLUMNS(
FactResellerSales,
"FactResellerSales_OrderDate_Year",
Year(
'FactResellerSales'[OrderDate]
)
)
)
),
ORDERBY(
[FactResellerSales_OrderDate_Year]
)
)
)
),
[FactResellerSales_SalesAmount_SUMX],
ORDERBY(
[FactResellerSales_OrderDate_Year_Order_null]
)
)
)
),
"FactResellerSales_OrderDate_Year_Order_Auto",
CALCULATE(
ROWNUMBERW(
CALCULATETABLE(
DISTINCT(
SELECTCOLUMNS(
FactResellerSales,
"FactResellerSales_OrderDate_Year",
Year(
'FactResellerSales'[OrderDate]
)
)
)
),
OrderBy(
[FactResellerSales_OrderDate_Year]
)
)
)
),
"FactResellerSales_OrderDate_Year",
[FactResellerSales_OrderDate_Year],
"FactResellerSales_OrderDate_Year_Order_Auto",
[FactResellerSales_OrderDate_Year_Order_Auto],
"FactResellerSales_MeasureCumulativeValue_SUMX",
[FactResellerSales_MeasureCumulativeValue_SUMX]
)
Case 5: RFM Model and Customer Value Analysis
Requirement
For most retail and sales industries, in addition to sales data analysis, another thing to pay attention to is customer value. It is important to build an RFM model by WAX function, based on R, F, M values, users can statistics the proportion of members and the proportion of member consumption.
The RFM model is used to analyze customer value, and it includes three key metrics:
R (Recency), the interval between the most recent consumption
F (Frequency), consumption frequency
M (Monetary), the amount of consumption
In general, the shorter the interval, frequency, and amount of the last purchase, the greater the customer value.
In fact, when analyzing all customer data, if the R, F, and M values are calculated for each customer, it cannot clearly and intuitively reflect the rules, so we group customers according to R, F, and M values.
First, select each customer and calculate the values for the three metrics above.
Secondly, from the above results, look at the average of the three indicators.
Third, group each customer.
If the R value < the average R value, it belongs to R↑ and we mark it as R_UP, otherwise it belongs to R↓ and we mark it as R_DOWN; The logic of F and M values is similar. If the F value > the average F value, it belongs to F↑ and we mark it as F_UP, otherwise it belongs to F↓ and we mark it as F_DOWN; If the M value > the average M value, it belongs to M↑, which we mark as M_UP, otherwise it belongs to M↓, and we mark it as M_DOWN;
R ↓ F ↓ M ↓ R ↑ F ↑ M ↑ Any combination between R ↓ F ↑ M ↑ is 8 groups, which are mapped to the business definition as follows:
R↑F↑M↑: Important value customers
R↑F↑M↓: General value customers
R↑F↓M↑: An important development customer
R↑F↓M↓: General development customers
R↓F↑M↑: Important to keep customers
R↓F↑M↓: Generally keep customers
R↓F↓M↑: Important customer retention
R↓F↓M↓: General customer retention
Then based on this group and average, users can do more complex analytics and dashboards like membership classification, membership percentage, membership consumption percentage.
Steps for creating a dashboard
1. Drag a pivot table and drag FirstName to Rows.
2. Add 3 measures (R, F, M) on the table 'FactInternetSales'.
Input the expression given below and save it as R. So, the name of the Measure will be R.
IF(
(
MAXX(
ADDCOLUMNS(
SELECTATTRIBUTES(
'DimCustomer'[FirstName]
),
"DATEDIFFvalue",
DATEDIFF(
'FactInternetSales'[OrderDate],
MAXX(
All(
'FactInternetSales'
),
'FactInternetSales'[OrderDate]
),
DAY
)
),
[DATEDIFFvalue]
)
<=
CALCULATE(
AVERAGEX(
SUMMARIZECOLUMNS(
'DimCustomer'[FirstName],
"DATEDIFFMAX",
MAXX(
ADDCOLUMNS(
SELECTATTRIBUTES(
'DimCustomer'[FirstName]
),
"DATEDIFFvalue",
DATEDIFF(
'FactInternetSales'[OrderDate],
MAXX(
All(
'FactInternetSales'
),
'FactInternetSales'[OrderDate]
),
DAY
)
),
[DATEDIFFvalue]
)
),
[DATEDIFFMAX]
),
removefilters('DimCustomer'[FirstName])
)
),
"R_Down",
"R_Up"
)
Input the expression given below and save it as F. So, the name of the Measure will be F.
if(
COUNTX('FactInternetSales',1)
<=
calculate(averagex(
SUMMARIZE('FactInternetSales','DimCustomer'[FirstName], "countValue",COUNTX('FactInternetSales',1)),
[countValue]
),
removefilters('DimCustomer'[FirstName])
),
"F_Down",
"F_Up"
)
Input the expression given below and save it as M. So, the name of the Measure will be M.
if( averagex('FactInternetSales','FactInternetSales'[SalesAmount]) <= averagex(All('FactInternetSales'),'FactInternetSales'[SalesAmount]),"M_Down","M_Up")
2. Drag 3 measures to Values.
Explanation
R:
IF(
(
MAXX(
ADDCOLUMNS(
SELECTATTRIBUTES(
'DimCustomer'[FirstName]
),
"DATEDIFFvalue",
DATEDIFF(
'FactInternetSales'[OrderDate],
MAXX(
All(
'FactInternetSales'
),
'FactInternetSales'[OrderDate]
),
DAY
)
),
[DATEDIFFvalue]
)
<=
CALCULATE(
AVERAGEX(
SUMMARIZECOLUMNS(
'DimCustomer'[FirstName],
"DATEDIFFMAX",
MAXX(
ADDCOLUMNS(
SELECTATTRIBUTES(
'DimCustomer'[FirstName]
),
"DATEDIFFvalue",
DATEDIFF(
'FactInternetSales'[OrderDate],
MAXX(
All(
'FactInternetSales'
),
'FactInternetSales'[OrderDate]
),
DAY
)
),
[DATEDIFFvalue]
)
),
[DATEDIFFMAX]
),
removefilters('DimCustomer'[FirstName])
)
),
"R_Down",
"R_Up"
)
The above is a little complex. In this case we can see that it uses the If function to compare two functions. One is Max, the other one is Average.
The first parameter for Max is a table manipulation function.
Let's explain one by one.
F:
if(
COUNTX('FactInternetSales',1)
<=
calculate(averagex(
SUMMARIZE('FactInternetSales','DimCustomer'[FirstName], "countValue",COUNTX('FactInternetSales',1)),
[countValue]
),
removefilters('DimCustomer'[FirstName])
),
"F_Down",
"F_Up"
)
The above one is very similar to the first one. The difference is that this one uses the removefilters function and uses a table manipulation function for the aggregation function.
Removefilters function in Wyn could only remove dimensions, it cannot remove the filter.
Also, we can change COUNTX('FactInternetSales',1) to COUNTROWS('FactInternetSales')
M:
if( averagex('FactInternetSales','FactInternetSales'[SalesAmount]) <= averagex(All('FactInternetSales'),'FactInternetSales'[SalesAmount]),"M_Down","M_Up")
The above is a measure, we can see that it uses the If function. The first parameter uses a conditional operator, and each side is an aggregation function.
The whole WAX is below:
EVALUATE
SELECTCOLUMNS(
SUMMARIZE(
CALCULATETABLE(
SELECTATTRIBUTES(
'DimCustomer'[FirstName]
)
),
'DimCustomer'[FirstName],
"FactInternetSales_M_SUMX",
CALCULATE(
if(
(
averagex(
'FactInternetSales',
'FactInternetSales'[SalesAmount]
)
<=
averagex(
All(
'FactInternetSales'
),
'FactInternetSales'[SalesAmount]
)
),
"M_Down",
"M_Up"
)
),
"FactInternetSales_F_SUMX",
CALCULATE(
if(
(
COUNTX(
'FactInternetSales',
1
)
<=
calculate(
averagex(
SUMMARIZE(
'FactInternetSales',
'DimCustomer'[FirstName],
"countValue",
COUNTX(
'FactInternetSales',
1
)
),
[countValue]
),
removefilters(
'DimCustomer'[FirstName]
)
)
),
"F_Down",
"F_Up"
)
),
"FactInternetSales_R_SUMX",
CALCULATE(
IF(
(
MAXX(
ADDCOLUMNS(
SELECTATTRIBUTES(
'DimCustomer'[FirstName]
),
"DATEDIFFvalue",
DATEDIFF(
'FactInternetSales'[OrderDate],
MAXX(
All(
'FactInternetSales'
),
'FactInternetSales'[OrderDate]
),
DAY
)
),
[DATEDIFFvalue]
)
<=
CALCULATE(
AVERAGEX(
SUMMARIZECOLUMNS(
'DimCustomer'[FirstName],
"DATEDIFFMAX",
MAXX(
ADDCOLUMNS(
SELECTATTRIBUTES(
'DimCustomer'[FirstName]
),
"DATEDIFFvalue",
DATEDIFF(
'FactInternetSales'[OrderDate],
MAXX(
All(
'FactInternetSales'
),
'FactInternetSales'[OrderDate]
),
DAY
)
),
[DATEDIFFvalue]
)
),
[DATEDIFFMAX]
),
removefilters(
'DimCustomer'[FirstName]
)
)
),
"R_Down",
"R_Up"
)
),
"DimCustomer_FirstName_Order_null",
CALCULATE(
ROWNUMBERW(
CALCULATETABLE(
DISTINCT(
SELECTATTRIBUTES(
DimCustomer,
'DimCustomer'[FirstName]
)
)
),
OrderBy(
'DimCustomer'[FirstName]
)
)
)
),
"DimCustomer_FirstName",
'DimCustomer'[FirstName],
"DimCustomer_FirstName_Order_null",
[DimCustomer_FirstName_Order_null],
"FactInternetSales_M_SUMX",
[FactInternetSales_M_SUMX],
"FactInternetSales_F_SUMX",
[FactInternetSales_F_SUMX],
"FactInternetSales_R_SUMX",
[FactInternetSales_R_SUMX]
)
Case 6: Correlation analysis
Requirement
In most sales data analysis, the user wants to perform correlation analysis, such as the data analysis of purchasing product A and product B at the same time, including sales amount, sales quantity, percentage of sales, even the association of other more complex conditions, such as customer type, signing time, delivery time, etc., to discover the connection between different products, to match recommendations and sales to promote sales.
In this example, we will take the correlation analysis based on purchased products.
Steps for creating a dashboard
1. Drag a Pivot table and drag Product Name to Rows.
2. Add a measure on the table 'FactInternetSales'.
3. Input the expression given below and save it as Value. So, the name of the Measure will be Value.
countx('FactInternetSales','FactInternetSales'[SalesAmount])
This expression will give the count of the number of rows having non-blank values in the column SalesAmount.
4. Input the expression given below and save it as AllValue. So, the name of the Measure will be AllValue.
CALCULATE(
COUNTX(
SELECTATTRIBUTES(
'FactInternetSales',
'DimCustomer'[CustomerKey],
'DimProduct'[EnglishProductName],
'FactInternetSales'[SalesAmount]
),
'FactInternetSales'[SalesAmount]
),
summarize(
FILTER(
SUMMARIZECOLUMNS(
'DimCustomer'[CustomerKey],
'DimProduct'[EnglishProductName],
"SalesOrderNameCount",
CALCULATE(
DISTINCTCOUNTX(
SELECTATTRIBUTES(
'FactInternetSales',
'DimCustomer'[CustomerKey],
'DimProduct'[EnglishProductName]
),
'DimProduct'[EnglishProductName]
),
REMOVEFILTERS('DimProduct'[EnglishProductName])
),
"NameCount",
CALCULATE(DISTINCTCOUNTX(ALL('DimProduct'), 'DimProduct'[EnglishProductName]))
),
[SalesOrderNameCount] =[NameCount]
),
'DimCustomer'[CustomerKey]
)
)
5. Drag both the measures to the Values.
Case 7: Pareto analysis
Requirement
For most sales and retail industries, it is common for a small number of products to contribute most of the value.
For example, product A sells 10 percent of the total, but the sales are 80 percent of the total sales. So, users want to analyze and find this 10% of products to maximize the use of resources in daily marketing and management.
In order to find the best-selling products, users want to calculate the cumulative sales and cumulative percentage for each product.
According to the cumulative ratio, the products are divided into several types, such as general sales: '0~70%', good sales: 70~90%, excellent sales: 90%~100%.
In addition, this analysis may be based on different latitudes, such as different regions or different years.
Steps for creating a dashboard
1. Drag a Pivot table and drag Product Name to Rows, SaleAmount to Values.
2. Add a measure in table 'CorrelationAnalysis', and add the following expression as below. Name the measure as MeasureRange:
SWITCH(
TRUE,
sum('CorrelationAnalysis'[SaleAmount]) < 10000, "less than 10k",
sum('CorrelationAnalysis'[SaleAmount]) >= 10000 && sum('CorrelationAnalysis'[SaleAmount]) < 30000, "10k-30k",
sum('CorrelationAnalysis'[SaleAmount]) >= 30000 && sum ('CorrelationAnalysis'[SaleAmount]) < 50000, "30k-50k",
sum('CorrelationAnalysis'[SaleAmount]) >= 50000 && sum('CorrelationAnalysis'[SaleAmount]) < 100000, "50k-100k",
sum('CorrelationAnalysis'[SaleAmount]) >= 100000, "greater than 100k"
)
3. Bind the MeasureRange to Values.
Case 8: Difference analysis for any time period
Requirement
In smart electricity consumption, the electricity consumption record of each meter is collected by frequency.
For example, the collection frequency is every 10 minutes (possibly in seconds, minutes, and hours). During the analysis, it is necessary to calculate the electricity consumption in this time range (end-time electricity consumption minus start-time electricity consumption), which will be displayed according to different dimensions such as hour, day, month, and year.
An example of the original statistics is as follows, which is counted every ten minutes.
The actual electricity consumption for each time period needs to be subtracted from the current row of data from the next row.
Steps for creating a dashboard
1. Drag a Data table.
2. Add a data column in the table 'Electricity'.
3. Add the following expression as below. Name the column as Actual Electricity Consumption.
LEADW(
null,
'Electricity'[Electricity Value],
PARTITIONBY(
'Electricity'[Device ID]
),
ORDERBY(
'Electricity'[Collection DateTime]
)
)
-
'Electricity'[Electricity Value]
4. Binding the Actual Electricity Consumption to Columns, it can be seen that each row gets the value of the next row minus the current row.
In this way, the electricity consumption of each 10 minutes is obtained.
The below example is a subtraction analysis for current Year.
1. Drag a chart and drag a CollectionDateTime(Day) or CollectionDateTime(Month) or CollectionDateTime(Hour) to the Axis.
2. Add 3 measures in the table.
The first measure is CurrentDayElectricity and the expression is as below:
CALCULATE(
sumx(
ADDCOLUMNS(
SELECTATTRIBUTES(
'Electricity'[Electricity Value]
),
"Electricity_Collection DateTime_Hour",
HOUR(
'Electricity'[Collection DateTime]
),
"subtractValue",
CALCULATE(
LEADW(
ADDCOLUMNS(
SELECTATTRIBUTES(
'Electricity'[Electricity Value],
'Electricity'[Collection DateTime]
),
"Electricity_Collection DateTime_Hour",
HOUR(
'Electricity'[Collection DateTime]
)
),
'Electricity'[Electricity Value],
PARTITIONBY(
[Electricity_Collection DateTime_Hour]
),
ORDERBY(
'Electricity'[Collection DateTime]
)
)
-
'Electricity'[Electricity Value]
)
),
[subtractValue]
),
YEAR('Electricity'[Collection DateTime])=YEAR(TODAY()) && MONTH('Electricity'[Collection DateTime])=MONTH(TODAY()) && DAY('Electricity'[Collection DateTime])=DAY(TODAY())
)
The second measure is CurrentMonthElectricity and the expression is as below:
CALCULATE(
sumx(
ADDCOLUMNS(
SELECTATTRIBUTES(
'Electricity'[Electricity Value]
),
"Electricity_Collection DateTime_Day",
DAY(
'Electricity'[Collection DateTime]
),
"subtractValue",
CALCULATE(
LEADW(
ADDCOLUMNS(
SELECTATTRIBUTES(
'Electricity'[Electricity Value],
'Electricity'[Collection DateTime]
),
"Electricity_Collection DateTime_Day",
DAY(
'Electricity'[Collection DateTime]
)
),
'Electricity'[Electricity Value],
PARTITIONBY(
[Electricity_Collection DateTime_Day]
),
ORDERBY(
'Electricity'[Collection DateTime]
)
)
-
'Electricity'[Electricity Value]
)
),
[subtractValue]
),
YEAR('Electricity'[Collection DateTime])=YEAR(TODAY()) && MONTH('Electricity'[Collection DateTime])=MONTH(TODAY())
)
The third measure is CurrentYearElectricity and the expression is as below:
CALCULATE(
sumx(
ADDCOLUMNS(
SELECTATTRIBUTES(
'Electricity'[Electricity Value]
),
"Electricity_Collection DateTime_Month",
MONTH(
'Electricity'[Collection DateTime]
),
"subtractValue",
CALCULATE(
LEADW(
ADDCOLUMNS(
SELECTATTRIBUTES(
'Electricity'[Electricity Value],
'Electricity'[Collection DateTime]
),
"Electricity_Collection DateTime_Month",
MONTH(
'Electricity'[Collection DateTime]
)
),
'Electricity'[Electricity Value],
PARTITIONBY(
[Electricity_Collection DateTime_Month]
),
ORDERBY(
'Electricity'[Collection DateTime]
)
)
-
'Electricity'[Electricity Value]
)
),
[subtractValue]
),
YEAR('Electricity'[Collection DateTime])=YEAR(TODAY())
)
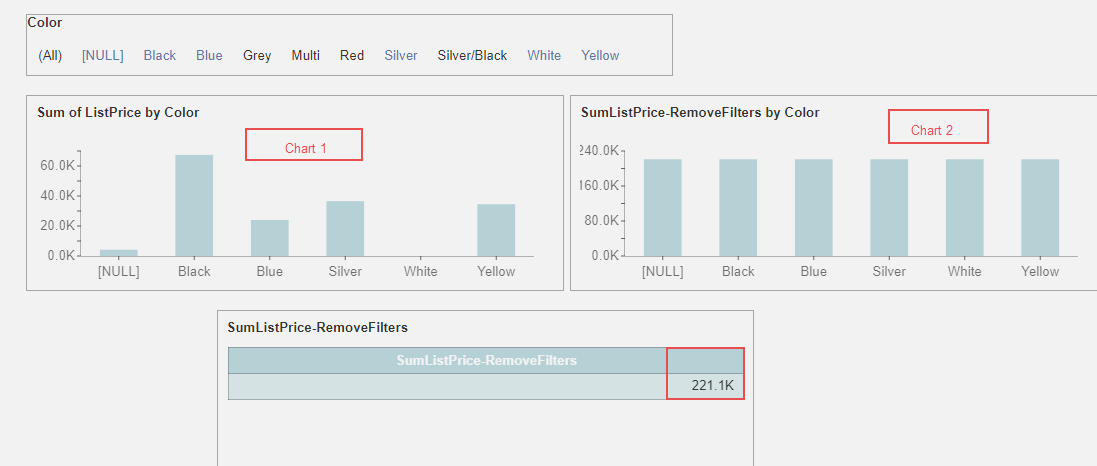
3. Drag the measure CurrentYearElectricity to Values.Case 9: Calculating the sum of the list price of the products based on the colors
Requirement
In this case, we will calculate the sum of the list price based on the products and their colors.
Steps for creating a dashboard
1. Drag a label slicer and bind it to the dataset and drag the Color to Columns.
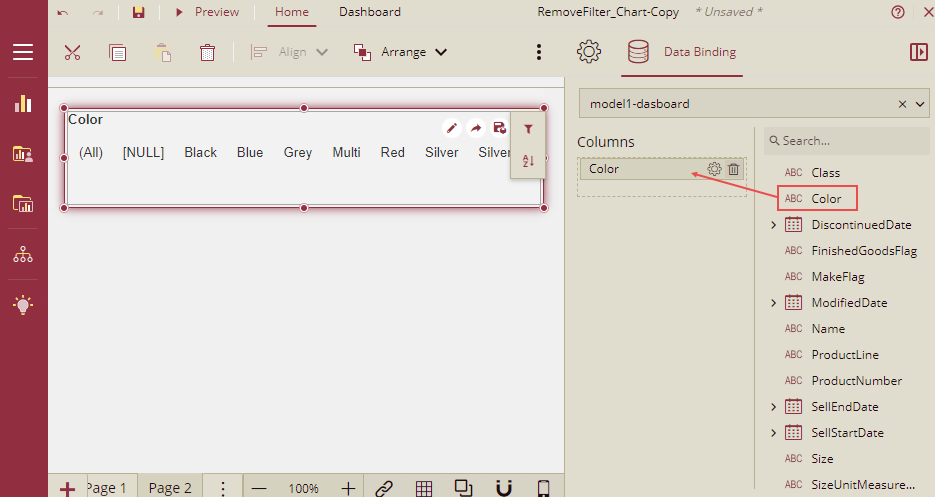
2. Drag a column chart and bind it to the dataset and drag the ListPrice to Values and Color to Axis.
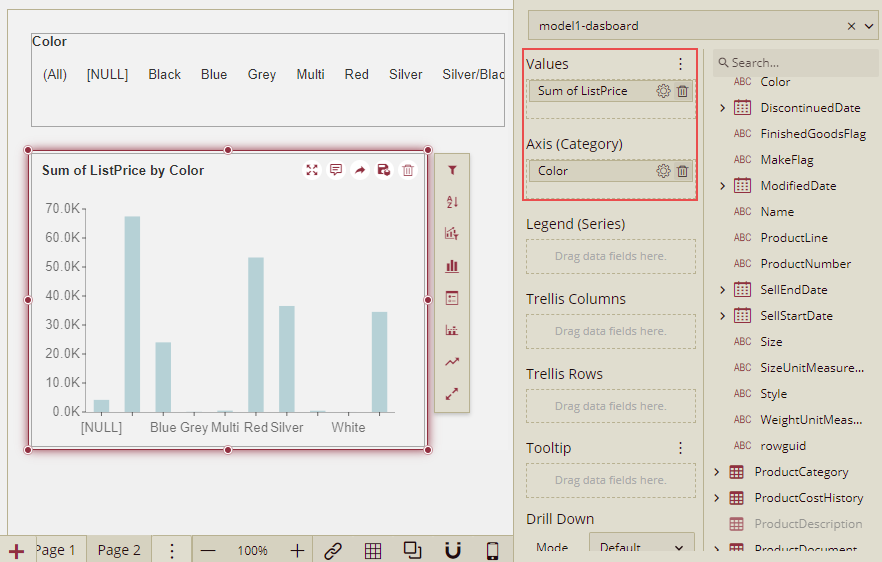
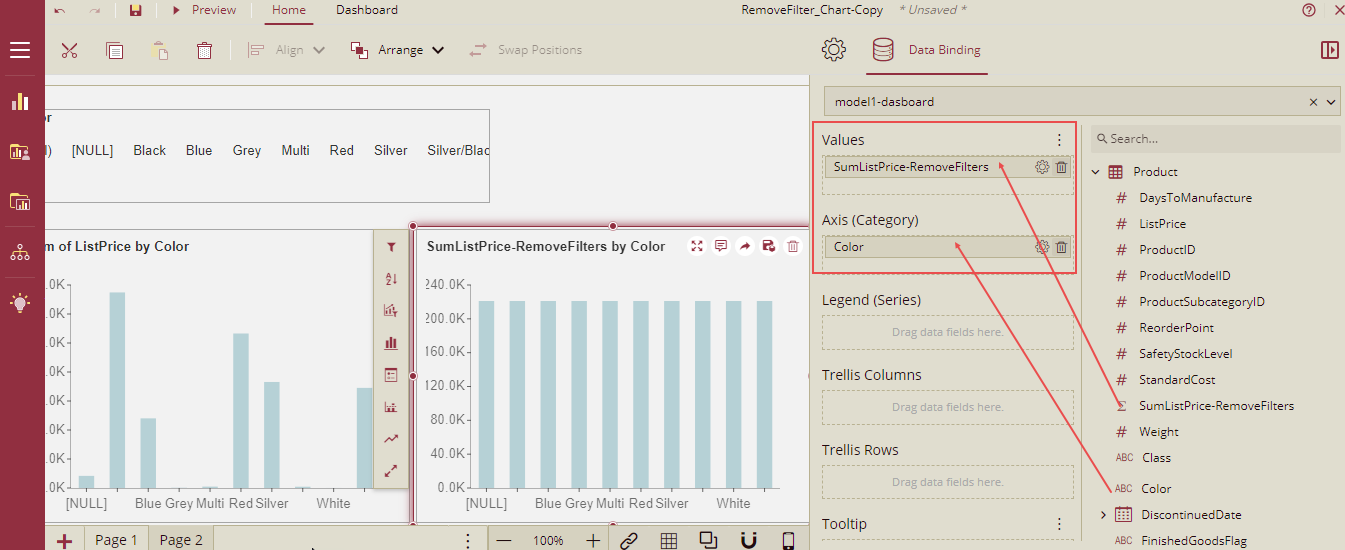
3. Drag another column chart and bind it to the dataset. Add a measure and name it SumListPrice-RemoveFilters and add the expression as given below.
CALCULATE (
SUMX ('Product', 'Product'[ListPrice] ),
REMOVEFILTERS('Product'[Color])
)
4. Drag the measure SumListPrice-RemoveFilters to Values and Color to Axis.
5. Drag a Pivot table, and bind it to the dataset. Drag the measure SumListPrice-RemoveFilters to Values.
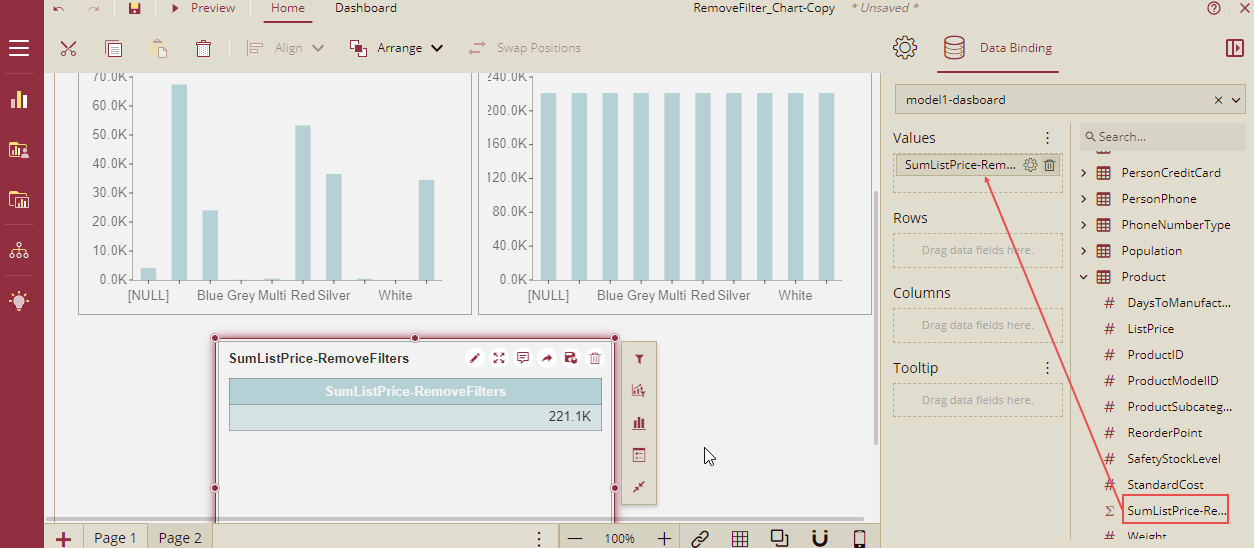
6. Now preview the dashboard and click All in the slicer. The sum of ListPrice for all the products for all the colors is displayed in both the column charts and in the pivot table as well.
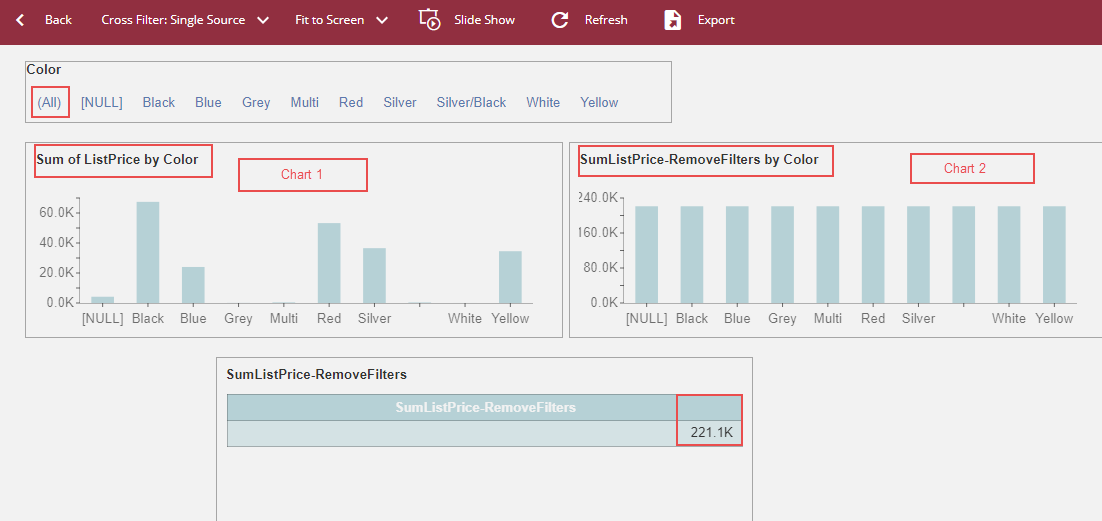
7. Now select only a few colors on the slicer (NULL, Black, Blue, Silver, White, and Yellow). The value for the Sum of ListPrice on the Chart 1 will be shown only for the selected colors on the slicers, but for Chart 2 and Pivot table, it will be calculated for all the colors as RemoveFilters function is applied in the measure SumListPrice-RemoveFilters ( used in Chart 2 and Pivot table) and it will remove all the filters. So, Chart 2 and Pivot table, will show the sum of ListPrice for all the colors and it will ignore any values selected in the slicer.