- Getting Started
- Administration Guide
-
User Guide
- An Introduction to Wyn Enterprise
- Document Portal for End Users
- Data Governance and Modeling
- Working with Resources
- Working with Reports
- Working with Dashboards
- View and Manage Documents
-
Understanding Wyn Analytical Expressions
- Syntax
- Measures and Calculated Columns
- Operators
- Functions
- Statements
-
Use Cases
- Use Case 1 - Actual Sales Profit
- Use Case 2 - Transaction Analysis per Customer
- Use Case 3 - Categorize fields based on calculations
- Use Case 4 - Cumulative Analysis
- Use Case 5 - RFM Model and Customer Value Analysis
- Use Case 6 - Correlation analysis
- Use Case 7 - Pareto analysis
- Use Case 8 - Difference analysis for any time period
- Use Case 9 - Sum by Product
- Best Practices
- Limitations
- Glossary
- Case...when Syntax
- Section 508 Compliance
- Subscribe to RSS Feed for Wyn Builds Site
- Developer Guide
Use Case 9 - Sum by Product
Case 9: Calculating the sum of the list price of the products based on the colors
Requirement
In this case, we will calculate the sum of the list price based on the products and their colors.
Steps for creating a dashboard
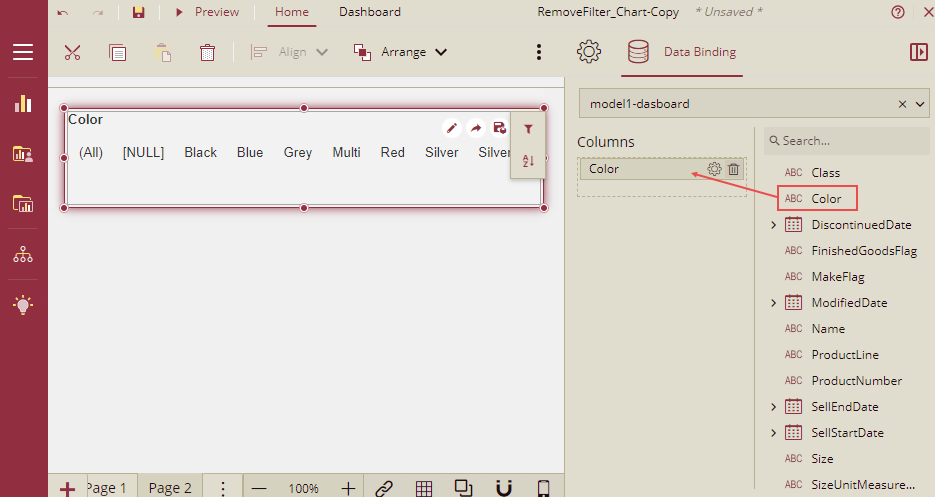
1. Drag a label slicer and bind it to the dataset and drag the Color to Columns.
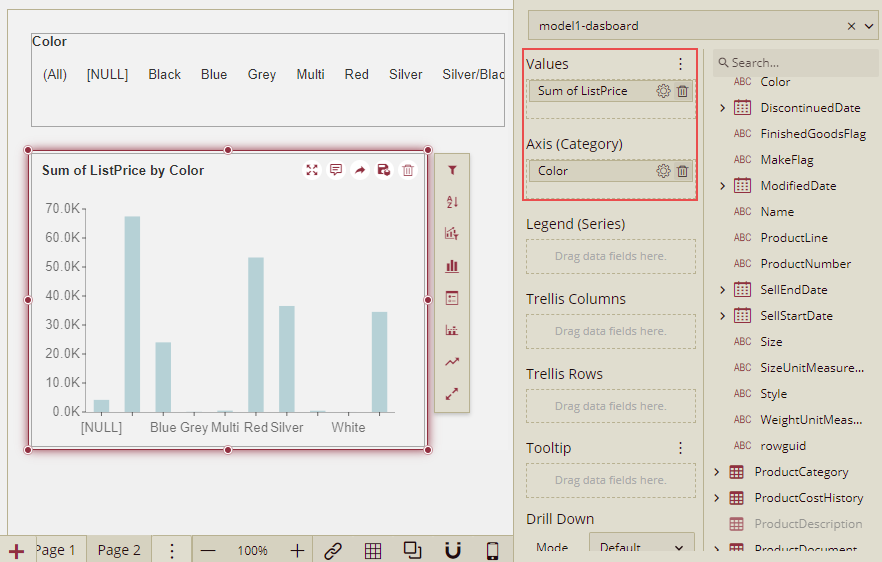
2. Drag a column chart and bind it to the dataset and drag the ListPrice to Values and Color to Axis.
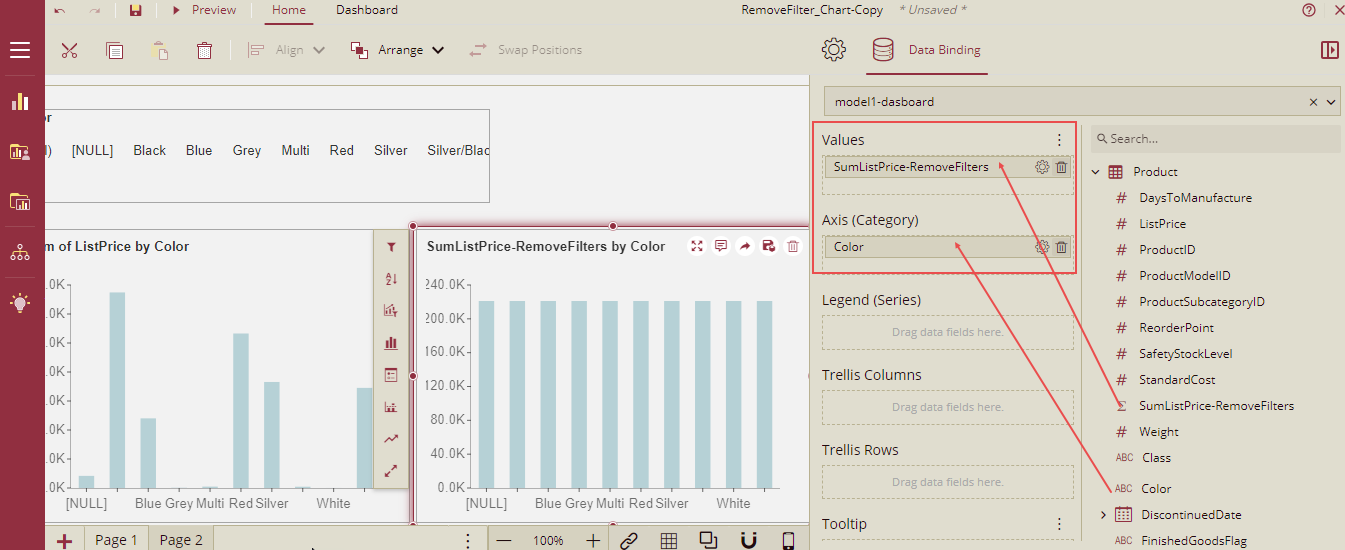
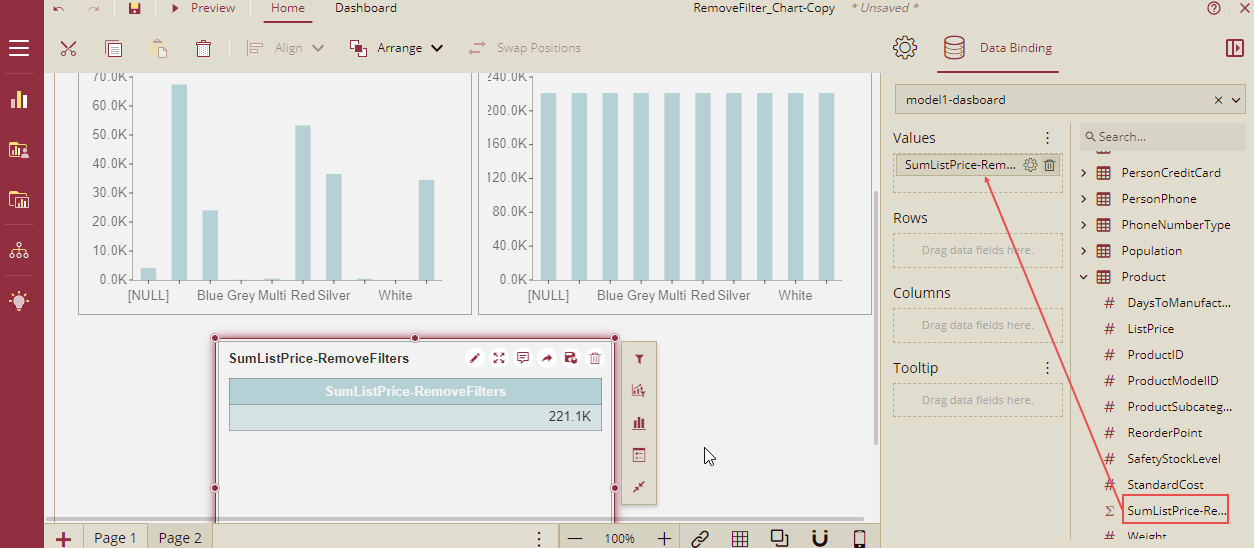
3. Drag another column chart and bind it to the dataset. Add a measure and name it SumListPrice-RemoveFilters and add the expression as given below.
CALCULATE (
SUMX ('Product', 'Product'[ListPrice] ),
REMOVEFILTERS('Product'[Color])
)
4. Drag the measure SumListPrice-RemoveFilters to Values and Color to Axis.
5. Drag a Pivot table, and bind it to the dataset. Drag the measure SumListPrice-RemoveFilters to Values.
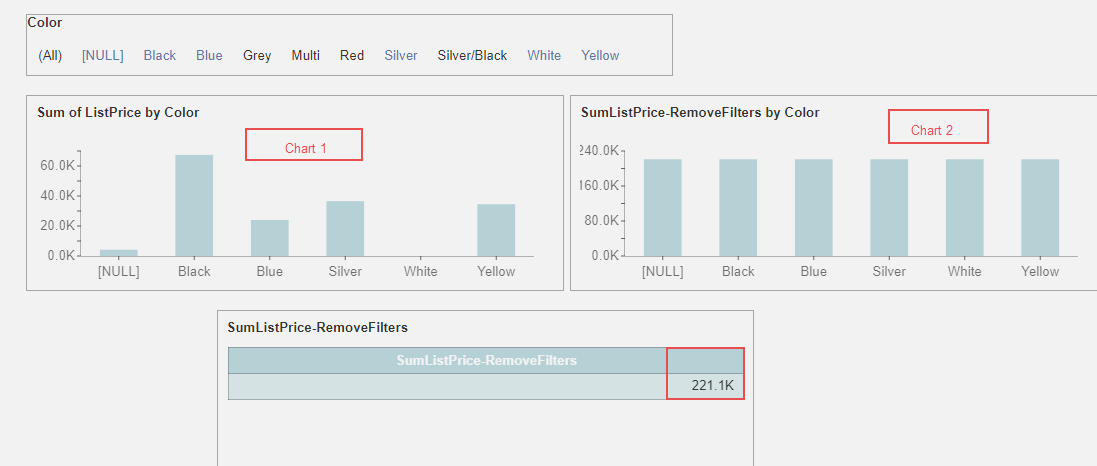
6. Now preview the dashboard and click All in the slicer. The sum of ListPrice for all the products for all the colors is displayed in both the column charts and in the pivot table as well.
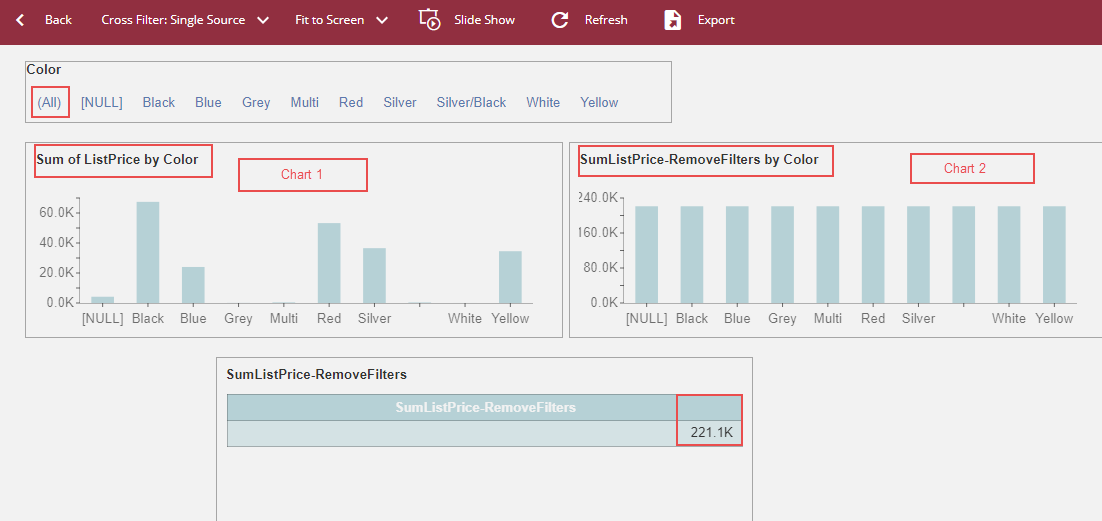
7. Now select only a few colors on the slicer (NULL, Black, Blue, Silver, White, and Yellow). The value for the Sum of ListPrice on the Chart 1 will be shown only for the selected colors on the slicers, but for Chart 2 and Pivot table, it will be calculated for all the colors as RemoveFilters function is applied in the measure SumListPrice-RemoveFilters ( used in Chart 2 and Pivot table) and it will remove all the filters. So, Chart 2 and Pivot table, will show the sum of ListPrice for all the colors and it will ignore any values selected in the slicer.