-
Interactive DashboardsCreate interactive BI dashboards with dynamic visuals.
-
End-User BI ReportsCreate and deploy enterprise BI reports for use in any vertical.
-
Wyn AlertsSet up always-on threshold notifications and alerts.
-
Localization SupportChange titles, labels, text explanations, and more.
-
Wyn ArchitectureA lightweight server offers flexible deployment.
-
 Wyn Enterprise 7.1 is ReleasedThis release emphasizes Wyn document embedding and enhanced analytical express...
 -
 Choosing an Embedded BI Solution for SaaS ProvidersAdding BI features to your applications will improve your products, better serve your customers, and more. But where to start? In this guide, we discuss the many options.
-
Visual GalleryInteractive sample dashboards and reports.
-
BlogExplore Wyn, BI trends, and more.
-
WebinarsDiscover live and on-demand webinars.
-
Customer SuccessVisualize operational efficiency and streamline manufacturing processes.
-
Knowledge BaseGet quick answers with articles and guides.
-
VideosVideo tutorials, trends and best practices.
-
WhitepapersDetailed reports on the latest trends in BI.
-
 Choosing an Embedded BI Solution for SaaS ProvidersAdding BI features to your applications will impr...
 -

- Getting Started
- Administration Guide
-
User Guide
- An Introduction to Wyn Enterprise
- Document Portal for End Users
- Data Governance and Modeling
- View and Manage Documents
- Working with Resources
- Working with Reports
- Working with Dashboards
- Working with Notebooks
- Wyn Analytical Expressions
- Section 508 Compliance
- Subscribe to RSS Feed for Wyn Builds Site
- Developer Guide
Area Map
Area Map Overview
An Area Map visualizes aggregated values across geographic regions by filling predefined areas—such as countries, states, or provinces—with color. Each area’s appearance reflects the data bound to it, making the map well suited for comparing regional distribution, intensity, or variation at a glance. In Wyn notebooks, the Area Map focuses on region-based encoding rather than point-based markers, emphasizing spatial patterns across defined boundaries.
This article covers the settings that are specific to maps and area rendering: Map Setting and Area Style. Other property groups—such as Animation, Interaction, Tooltip, Title, Drill Down Setting, Layout, and Appearance—behave consistently across visualizations and are documented elsewhere.
Data Binding
You can configure these bindings in the Data Binding Panel on the right side of the dashboard designer. At minimum, the Area Map requires the Region binding. The Color binding is typically used to drive the main visualization, while Tooltip is optional for added context.
Region
Bind a geographic field (e.g., country, state, county, or city) to define the areas displayed on the map. This slot is required for the Area Map to function.
Color
Bind a measure (such as sales, population, or density) to control the shading of each region. Higher or lower values are represented with stronger or lighter color intensity, making it easy to identify patterns and trends across regions.
Tooltip
Bind additional fields to display extra information when hovering over a region. Tooltips allow you to provide more context without adding clutter to the visual.
You can customize the appearance of the Area Map using the Inspector Panel on the right side of the dashboard designer.
Map Setting
Map Setting controls the overall behavior and presentation of the map canvas, including how the map is displayed, navigated, and initially framed.
Scenario Name
Scenario Name defines how the map appears in the Explorer tab. This name is for identification and organization only and does not affect how the map renders or behaves. You can rename the scenario at any time to better reflect its purpose or the data it represents.
Show Base Map
Show Base Map is enabled by default. When set to True, the full base map is displayed, including areas that do not have associated data. When set to False, only the geographic areas that are bound to data appear on the map. All other regions are hidden, allowing the visualization to focus exclusively on areas with values.
Base Map Type
Base Map Type determines the underlying map source. By default, Area Maps use OpenStreetMap. You can also select Custom to apply a custom GIS base style. Choosing Custom enables the Custom GIS Base Styles property, where you can select from available custom map styles.
Custom GIS base styles are managed through the Resource Portal. To use a custom map, upload the GIS base style there, then return to the Area Map settings to select it from the dropdown.
Scroll to Zoom
Scroll to Zoom controls whether users can zoom the map using the mouse wheel or trackpad scrolling. When set to True, scrolling zooms the map in or out. Setting it to False disables scroll-based zooming, which can be useful when you want to prevent accidental zoom changes during navigation.
Tilt Angle
Tilt Angle allows you to tilt the map for a pseudo‑3D perspective. You can tilt the map up to approximately 60 degrees, with the northern portion of the map tilting downward toward the viewer. This setting affects only the visual perspective and does not change the underlying data or area boundaries.
Display Area
Display Area defines the initial viewport of the map. Three options are available:
Auto: Wyn automatically determines the optimal view, typically showing just enough of the map to include all relevant areas.
By Area: The map view is determined by the geographic areas bound to the Region field in the Data Binding tab. When selected, the Area dropdown is populated with the regions derived from the bound data (for example, specific countries if Countries are bound to Region).
By Longitude & Latitude: The map view is explicitly controlled using geographic coordinates. This option enables additional properties for Zoom Level, Longitude, and Latitude, each adjustable with a slider to precisely position and scale the map.
Area Style
Area Style controls how geographic regions are visually rendered, including color encoding, background appearance, and borders.
Color Preference
Color Preference determines how colors are assigned to areas. Two options are available: Gradient and Palette.
Gradient
When Color Preference is set to Gradient, color intensity reflects numeric variation across regions. Two additional properties become available: Fill Mode and Fill Color.
Fill Mode defines how the gradient is applied:
Continuous
Values are mapped along a smooth color continuum, transitioning from lighter to darker shades based on magnitude.
Grouped
Values are divided into discrete ranges, with each range assigned a distinct color step within the gradient.
Continuous
When Fill Mode is set to Continuous, Fill Color lets you choose between a 2 Colors or 3 Colors gradient. You can also enable Custom to define your own colors, creating a personalized gradient transition.
Grouped
When Fill Mode is set to Grouped, additional properties appear to control how value ranges are calculated and displayed.
Group Number
Specifies how many value groups the data is divided into.
Divide Equally
Enabled by default. When set to True, the data range is divided into evenly sized segments. When set to False, you can manually control how values are segmented.
For example, with five groups and equal division enabled, the default breakpoints occur at 20%, 40%, 60%, and 80% of the value range.
Range Mode
Available when Divide Equally is set to True. Range Mode determines how grouped value ranges are defined. Two options are available:
Percentage
Divides the full data range into equal percentage-based segments based on the Group Number. This reflects the default grouped gradient behavior.
Absolute
Allows you to define explicit numeric ranges for each group. The number of groups corresponds to the Group Number setting. For each group (for example, Group 1, Group 2, and so on), the following fields are available:
Minimum Value: The lower bound of the range
Maximum Value: The upper bound of the range
Label: A custom label displayed in the legend for that range
This mode lets you map specific value thresholds to color groups rather than relying on percentage-based segmentation.
Fill Color
Defines the colors used for each group. Colors are applied to discrete value ranges rather than as a continuous transition.
In Gradient mode, the legend displays value ranges, visually indicating how colors correspond to data magnitude.
Palette
When Color Preference is set to Palette, areas are colored using a set of distinct colors rather than a numeric gradient. In this mode, the legend lists individual values derived from the data bound to the Color field, with each value represented by a separate color.
Two dependent properties are available:
Maintain Color Assignments
Disabled by default. When set to True, the Palette option is replaced with Color Assignments. Selecting Manage… lets you assign specific colors to individual values, ensuring consistent coloring across the map.
Palette
Available when Maintain Color Assignments is set to False. You can select a palette generated by the dashboard theme, choose a standard palette, or create a custom palette. Colors are automatically assigned from the selected palette.
Enable Background
Enable Background controls the appearance of areas on the map that are not filled by data. When set to True, the Background Color property becomes available, allowing you to choose a custom color and adjust its opacity using the color picker. By default, the background is partially transparent.
When Enable Background is set to False, non-data areas revert to the default gray appearance.
Border Width
Border Width controls the thickness of the lines separating geographic areas, such as borders between countries or regions. Increasing the width makes boundaries more prominent, while reducing it creates a subtler separation.
Border Color
Border Color defines the color of area boundaries. You can select any color using the color picker and adjust its opacity to control how strongly borders stand out against the filled areas and background.
Data Labels for Maps
Data labels allow you to display textual information directly on the colored areas of an Area Map. When enabled, labels appear only for regions that have data.
To show data labels, toggle Show Data Label to True. You can control what information appears in each label using the following options:
Show Location: Displays the geographic name of the area (for example, the country or region).
Show Measure: Displays the numeric value associated with the area, based on the measure used for color encoding.
You can enable either option individually or show both location and measure together.
The Display Mode property controls how labels are placed on the map:
Smart: Displays as many labels as possible while minimizing overlap and visual clutter.
All: Displays all labels, even if they overlap or crowd the map.
Finally, Data Label Font Setting lets you customize the appearance of the labels. You can configure the font family, size, color, weight, and style (such as italic) to ensure labels remain readable and consistent with your overall design.
These Map Setting and Area Style options give you precise control over how Area Maps are displayed and styled, allowing you to tailor both the geographic context and the visual encoding of regional data.
Minimum Required Bindings
At minimum, the Area Map requires the Region binding.
The Color binding is typically used to drive the main visualization, while Tooltip is optional for added context.
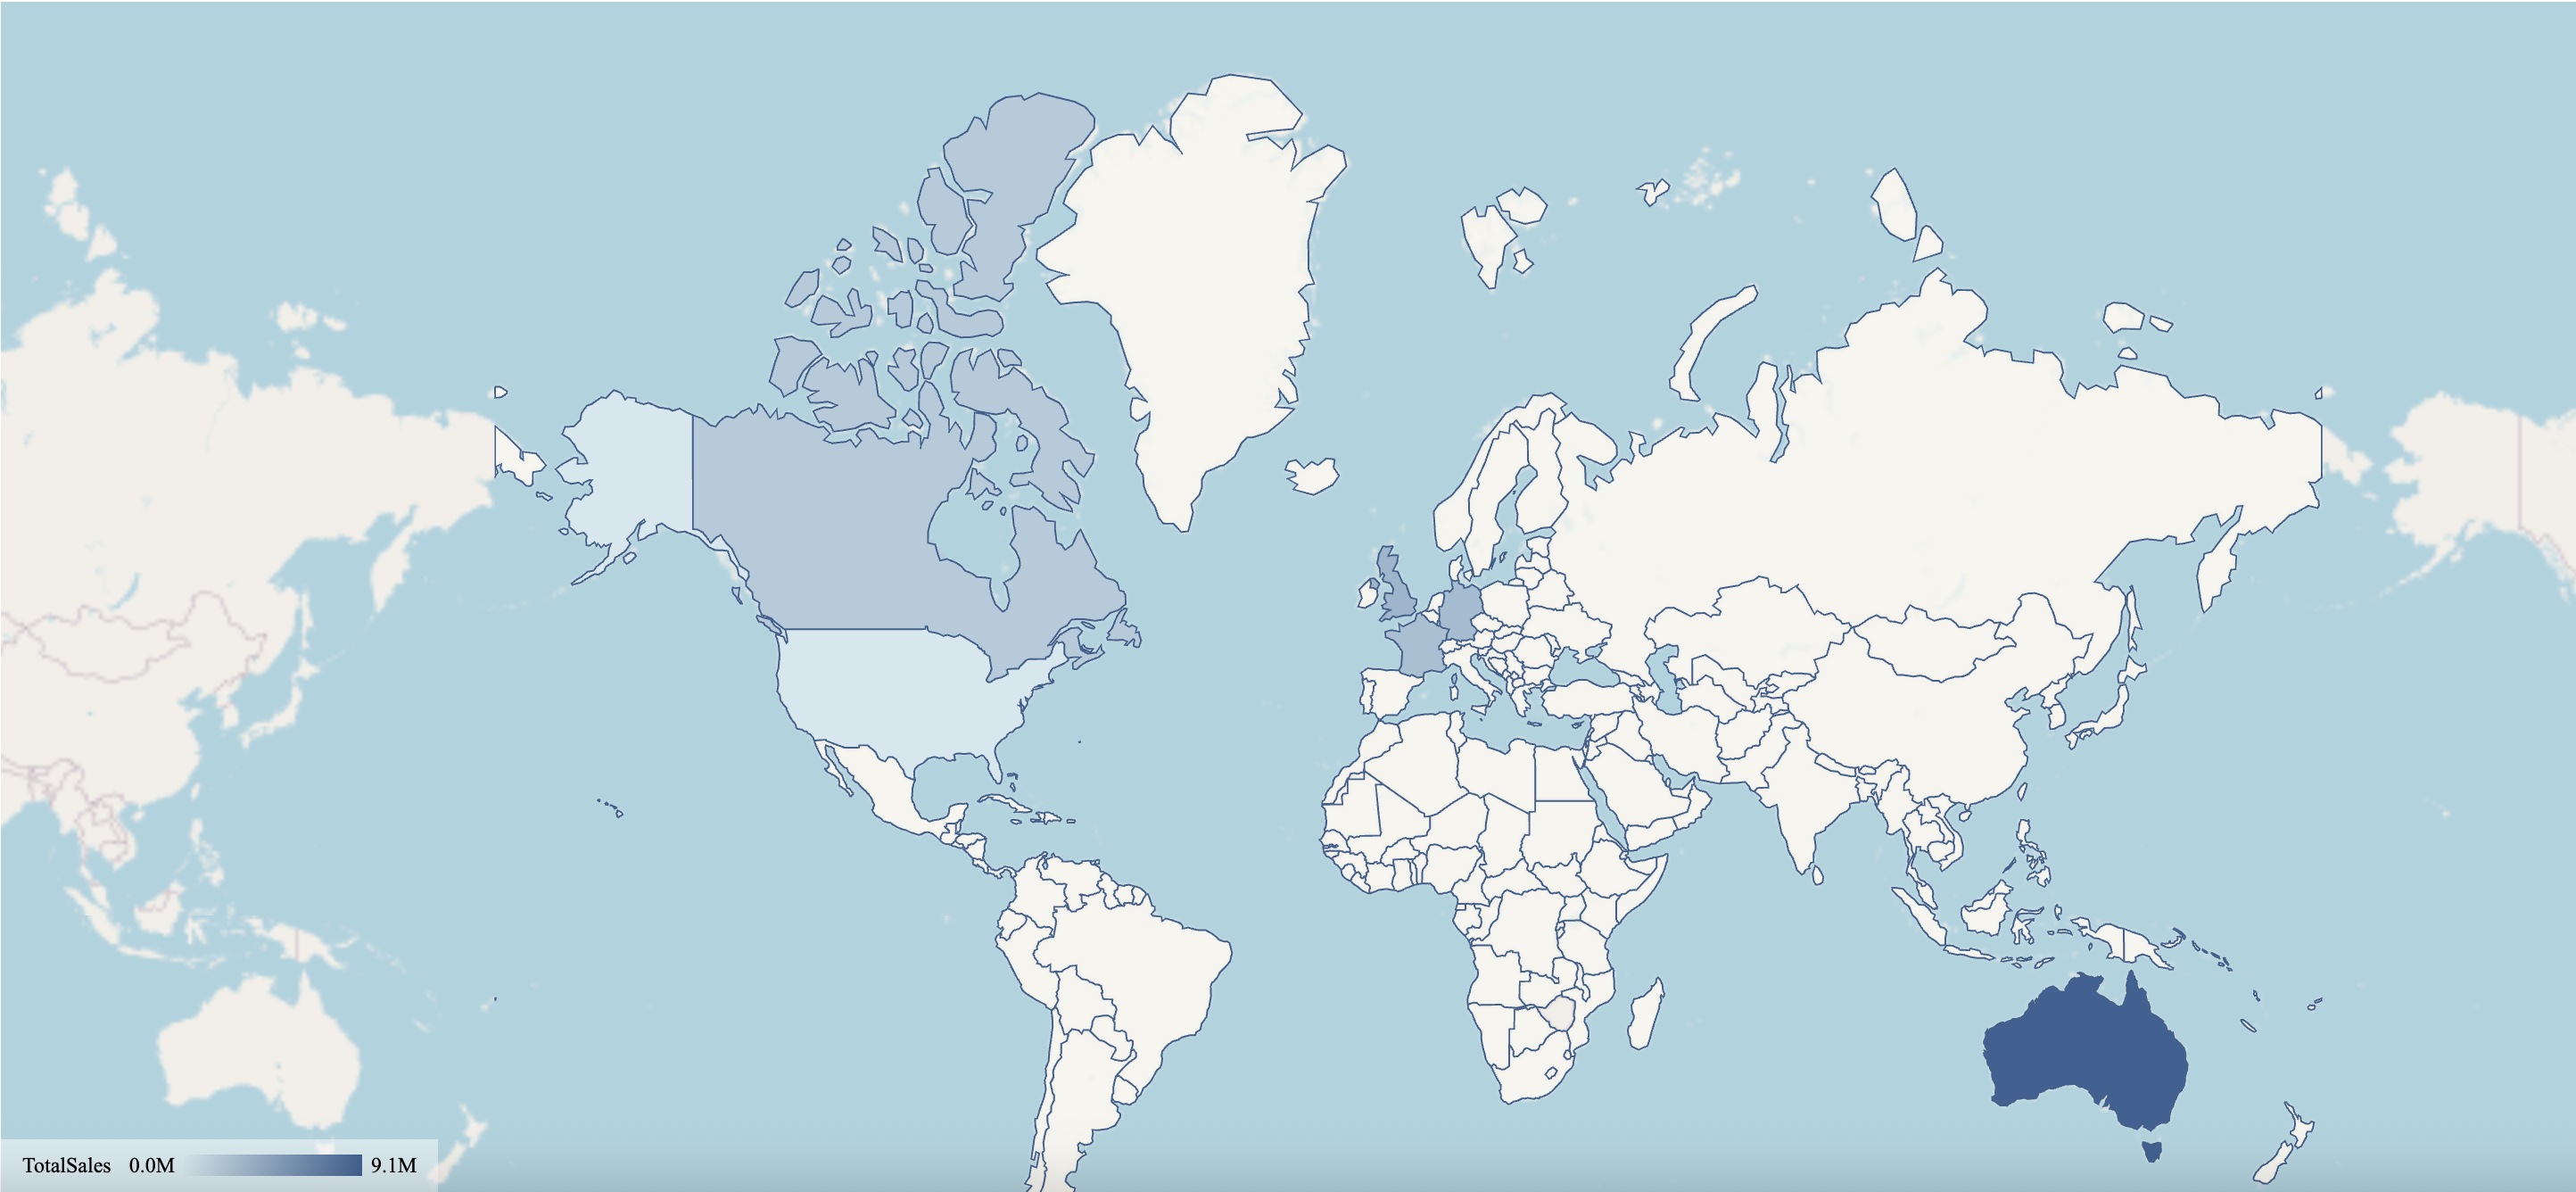
The following map has been created using this native query dataset from the AdventureWorks Data Warehouse:
SELECT
    st.SalesTerritoryRegion AS Region,
    SUM(fact.SalesAmount) AS TotalSales
FROM
    dbo.FactInternetSales fact
INNER JOIN
    dbo.DimSalesTerritory st
    ON fact.SalesTerritoryKey = st.SalesTerritoryKey
GROUP BY
    st.SalesTerritoryRegion
ORDER BY
    TotalSales DESC;