-
Interactive DashboardsCreate interactive BI dashboards with dynamic visuals.
-
End-User BI ReportsCreate and deploy enterprise BI reports for use in any vertical.
-
Wyn AlertsSet up always-on threshold notifications and alerts.
-
Localization SupportChange titles, labels, text explanations, and more.
-
Wyn ArchitectureA lightweight server offers flexible deployment.
-
 Wyn Enterprise 7.1 is ReleasedThis release emphasizes Wyn document embedding and enhanced analytical express...
 -
 Choosing an Embedded BI Solution for SaaS ProvidersAdding BI features to your applications will improve your products, better serve your customers, and more. But where to start? In this guide, we discuss the many options.
-
Visual GalleryInteractive sample dashboards and reports.
-
BlogExplore Wyn, BI trends, and more.
-
WebinarsDiscover live and on-demand webinars.
-
Customer SuccessVisualize operational efficiency and streamline manufacturing processes.
-
Knowledge BaseGet quick answers with articles and guides.
-
VideosVideo tutorials, trends and best practices.
-
WhitepapersDetailed reports on the latest trends in BI.
-
 Choosing an Embedded BI Solution for SaaS ProvidersAdding BI features to your applications will impr...
 -

Common
The common dashboard settings let you configure the maximum aggregated data points, enable the developer mode in the dashboard designer, allow certified custom visuals to run in an iframe or Div, and generate custom dashboard URLs for data monitoring. To set the common dashboard settings, navigate to Admin Portal > Configuration > Dashboard > Common.
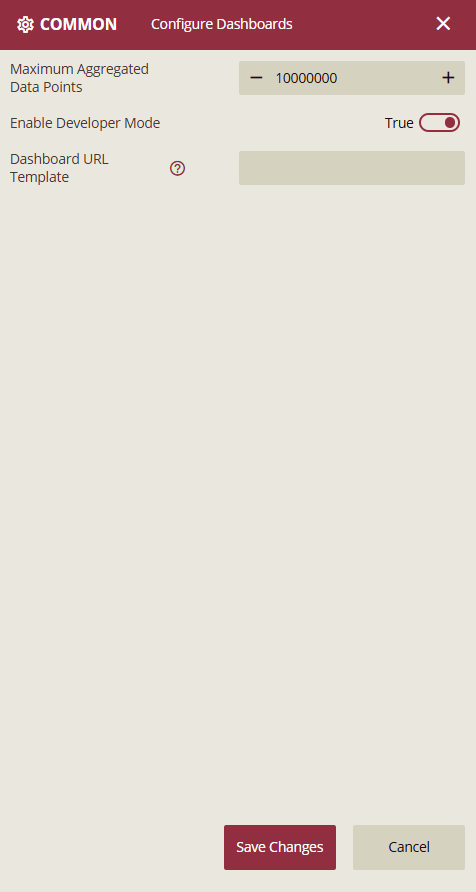
Common Dashboard Settings
This section outlines the configurable settings available for dashboards. These settings help manage data limits and enable developer tools for advanced customization.
Maximum Aggregated Data Points
Description: Controls the maximum number of data points that the dashboard backend can aggregate.
Default Value: 10000000
Minimum Value: 1
Purpose: Helps optimize performance when handling large datasets.
Enable Developer Mode
Description: Toggles Developer Mode visibility in the dashboard designer.
Purpose: Allows developers to debug and test custom visualization files within the dashboard environment.
Dashboard URL Template
Description: Defines the template used to generate dashboard URLs for data monitoring notifications.
Purpose:
Reference organization context using
#{orgContextName}.Reference user context using
@{userContextName}.Reference dashboard ID using
${dashboardId}.