- Getting Started
- Administration Guide
-
User Guide
- An Introduction to Wyn Enterprise
- Document Portal for End Users
- Data Governance and Modeling
- Working with Resources
- Working with Reports
-
Working with Dashboards
- Dashboard Designer
- Selecting a Dataset
- Data Attributes
- Dashboard Scenarios
- Dashboard Templates
- Component Templates
- 3D Scene
- Explorer
- Visualization Wizard
- Data Analysis and Interactivity
- Dashboard Appearance
- Preview Dashboard
- Export Dashboard
- Dashboard Lite Viewer
- Using Dashboard Designer
- Animating Dashboard Components
- Document Binder
- Dashboard Insights
- View and Manage Documents
- Understanding Wyn Analytical Expressions
- Section 508 Compliance
- Subscribe to RSS Feed for Wyn Builds Site
- Developer Guide
Dynamically Filter a Chart Using a Parameter
You can use an image to dynamically change the parameter by which you filter a chart. The following steps will show you how to do so.
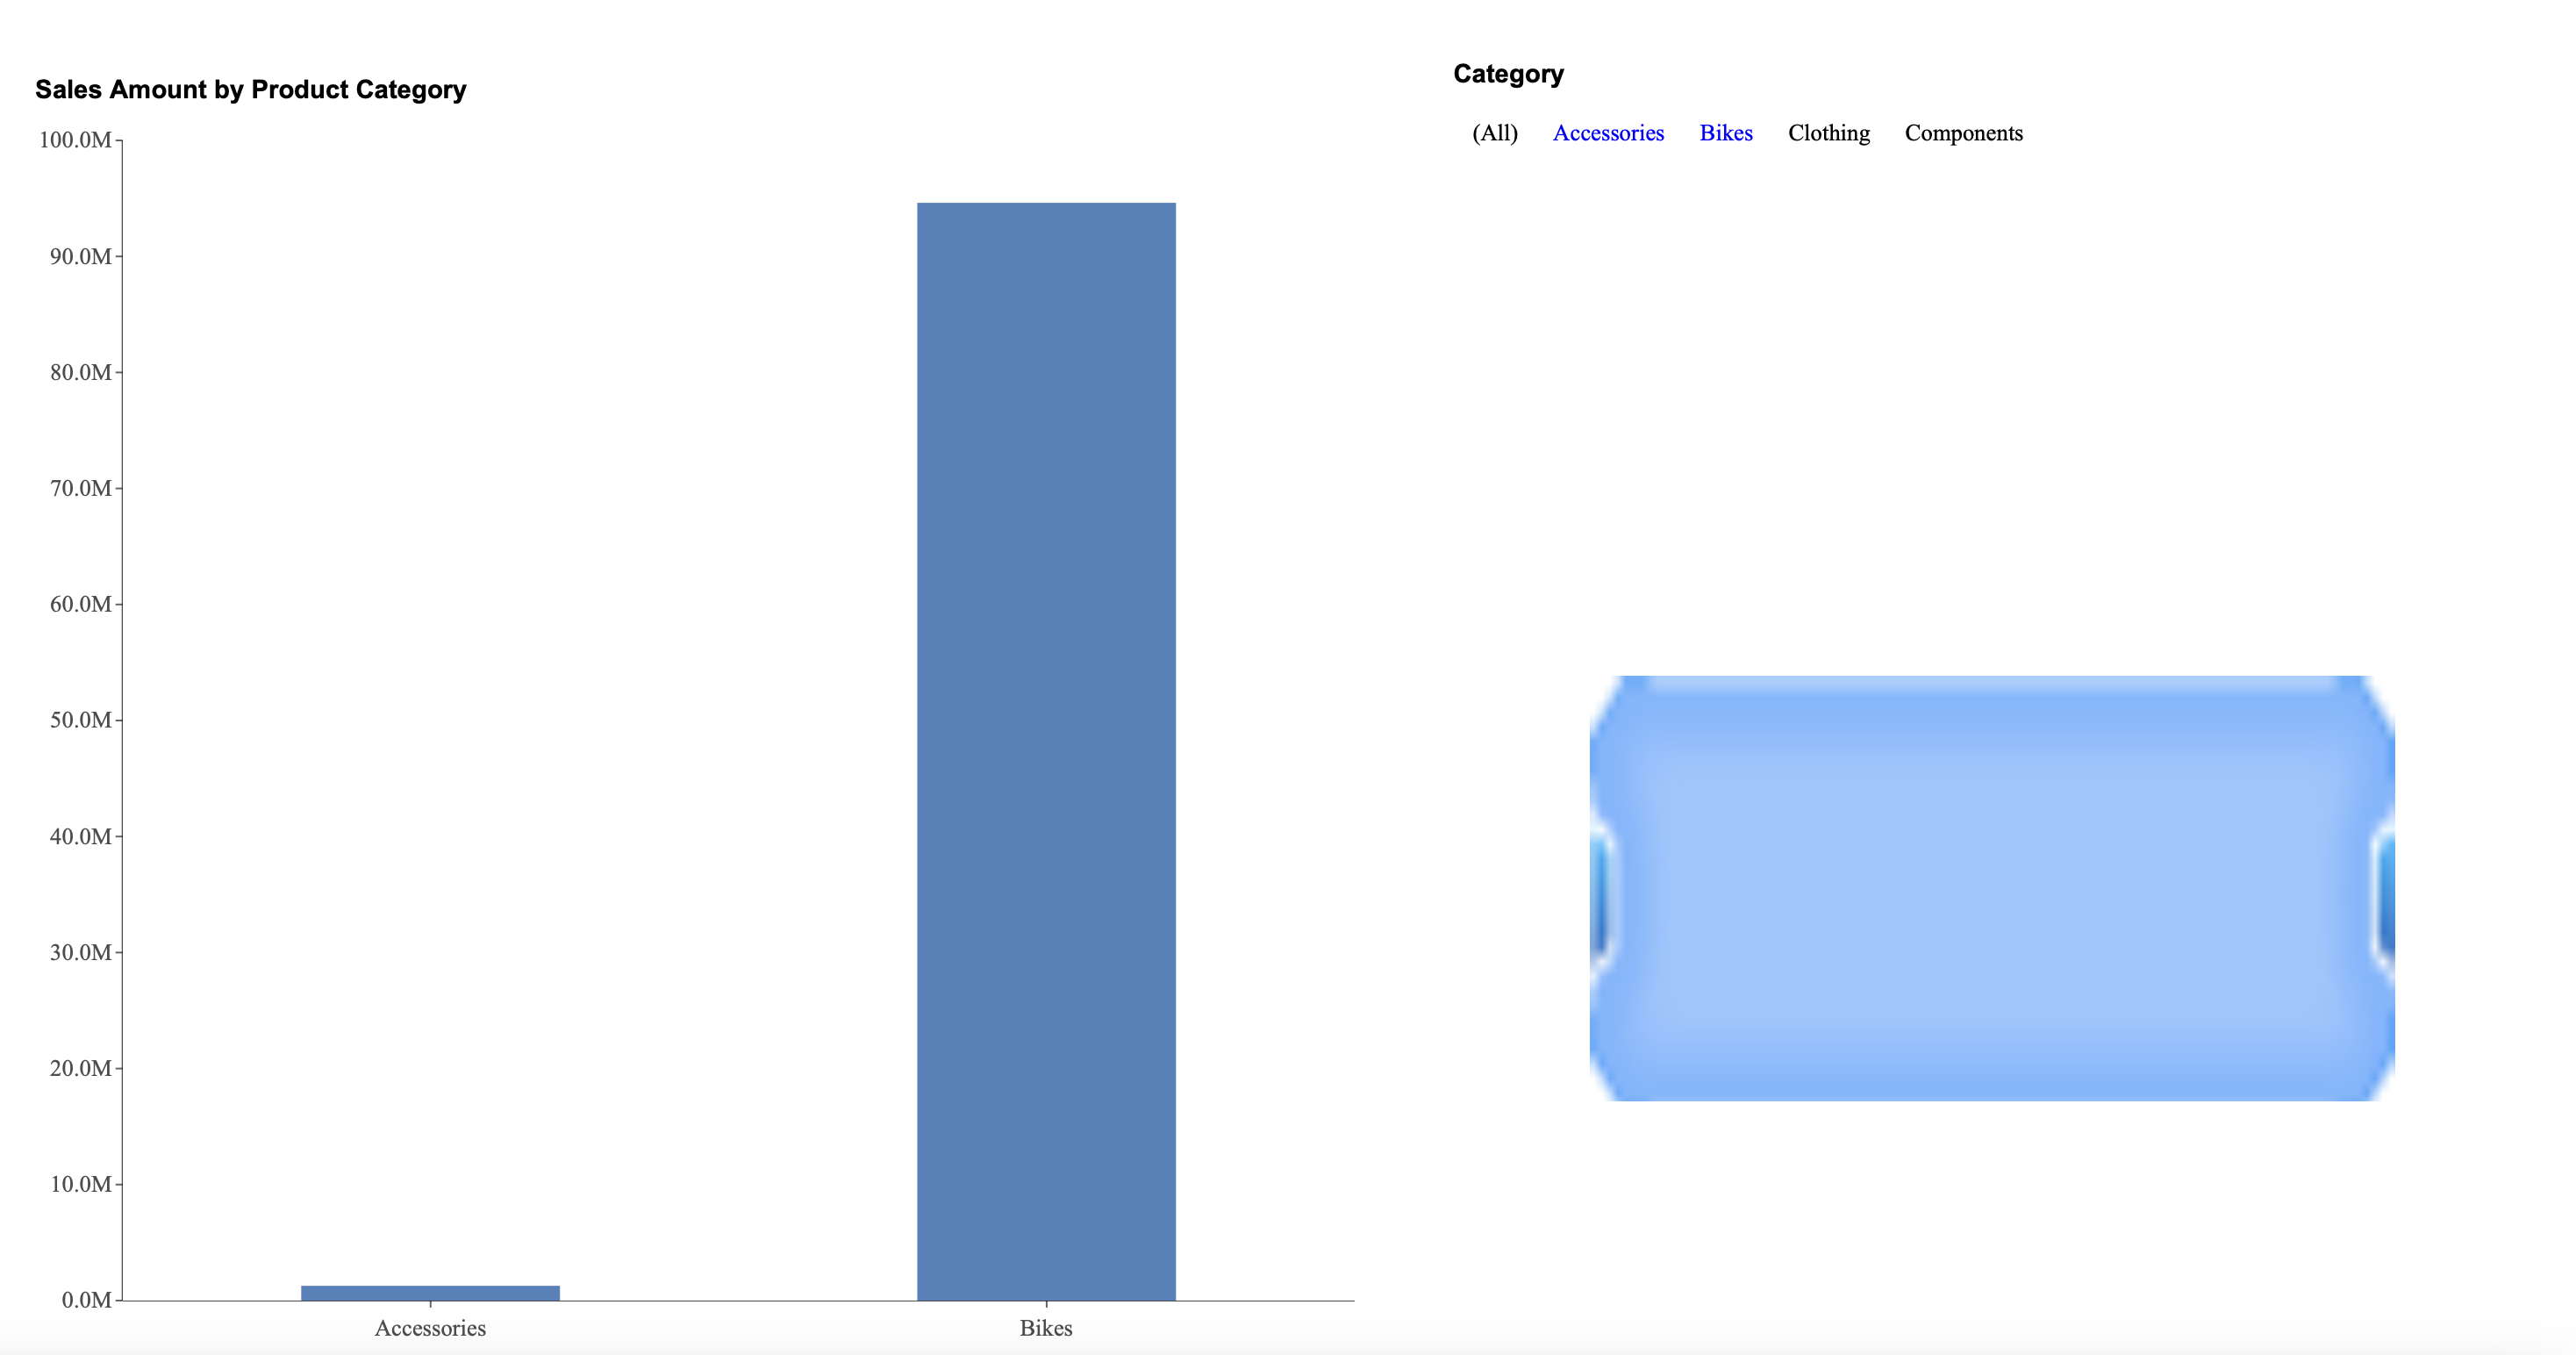
1. Create a Chart
Drag a column chart onto the canvas and bind your data. This chart displays Sales Amount by Product Category.

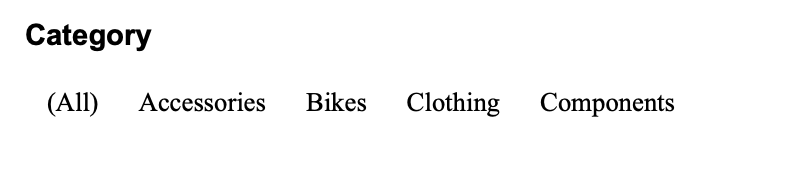
2. Add a Slicer
Drag a label slicer onto your canvas and bind it to your Product Category data.
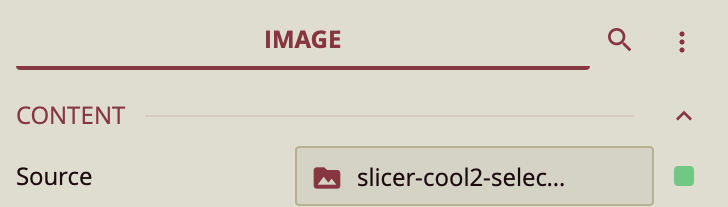
3. Add Image
Add an image scenario to your canvas and upload an image to it under Source in the Inspector Tab.
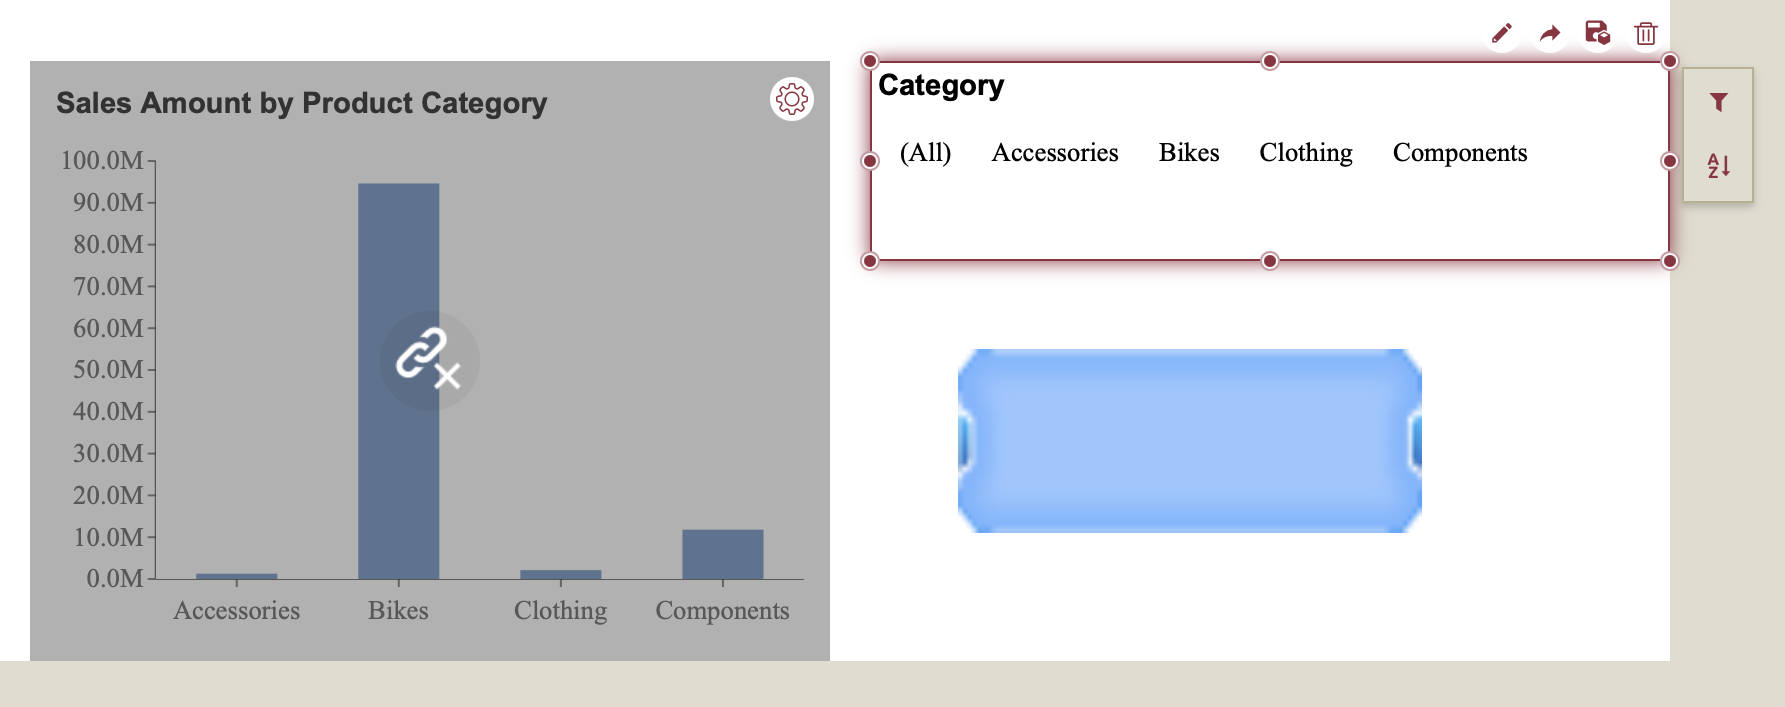
4. Disable Cross-filtering
Disable cross-filtering by selecting the label slicer and clicking on the link button on the bottom ribbon. ![]() Click on the link on the chart to disable cross-filtering.
Click on the link on the chart to disable cross-filtering.
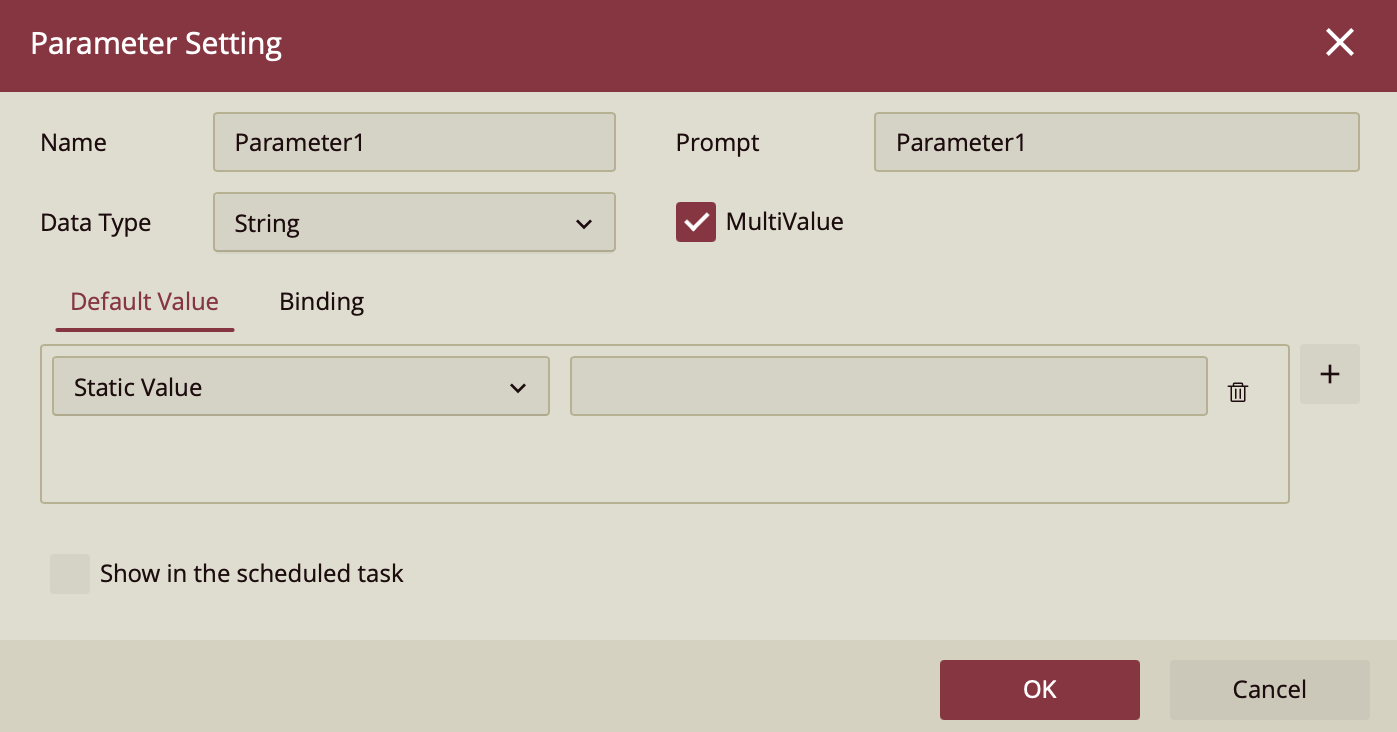
5. Add Parameter
Click anywhere on the canvas (not on a scenario) to open the dashboard settings on the right-hand menu. Click the + button next to the Parameters property to add a parameter. Set your parameter value to String and select MultiValue.
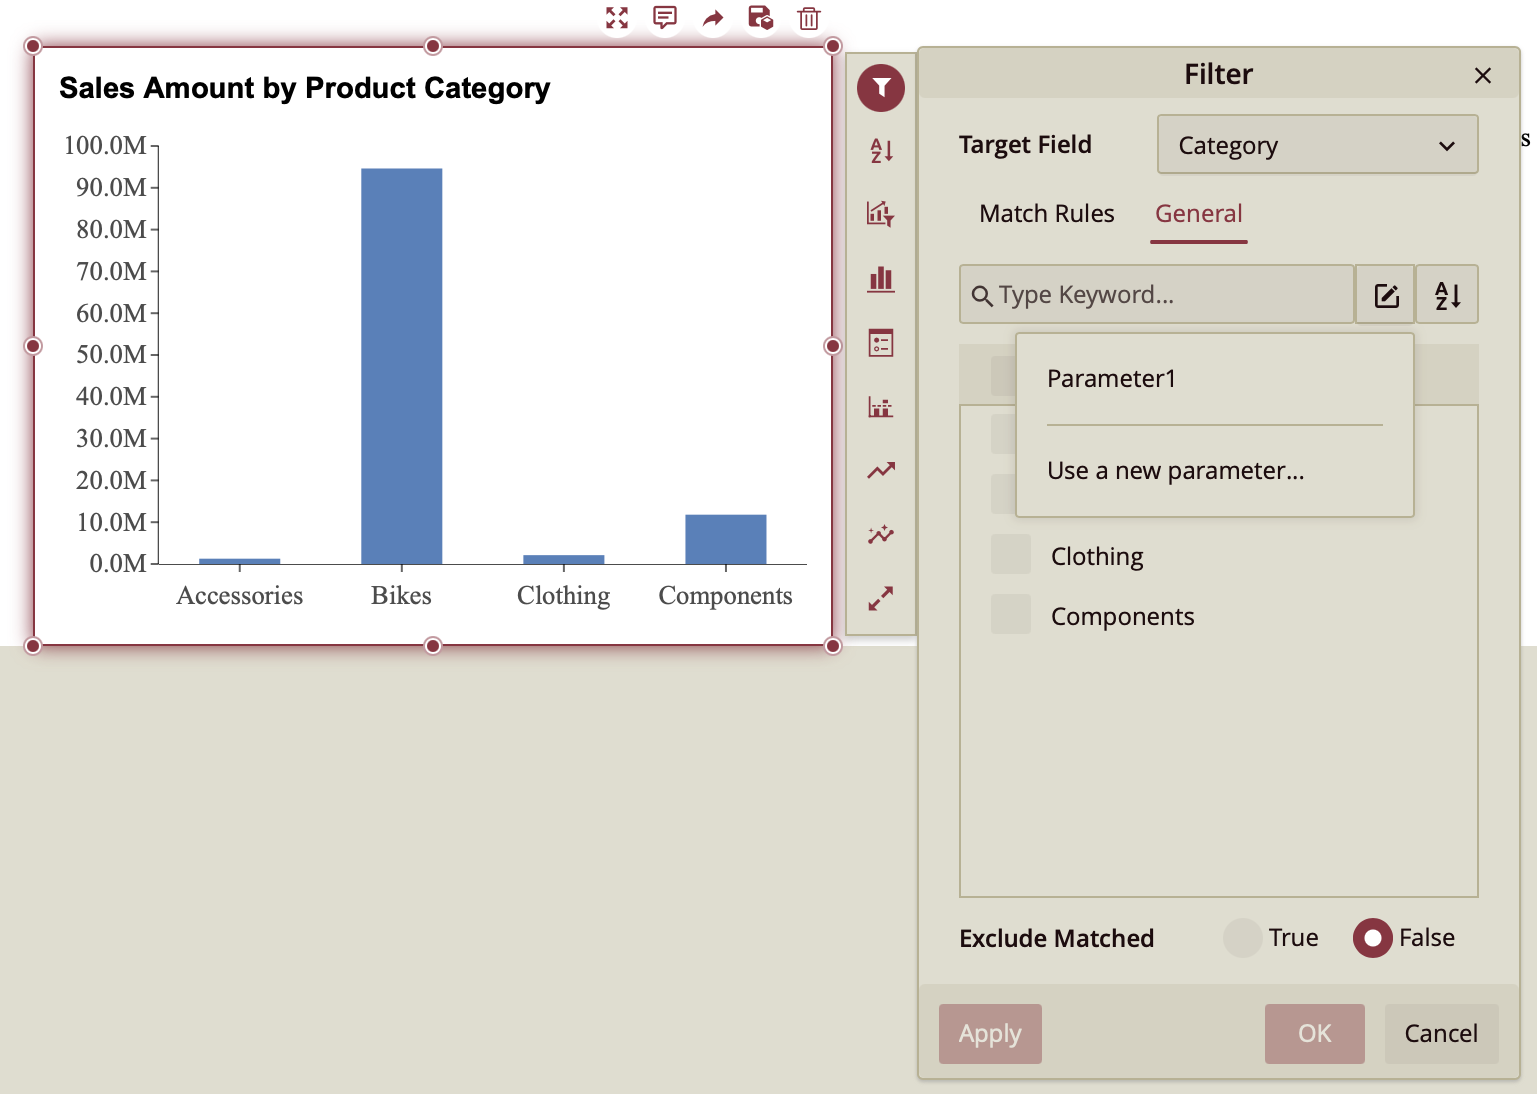
6. Filter by Parameter
Filter the chart by your parameter. Click on the chart and locate the Filter button, from where you choose the General tab to select your parameter from the dropdown.
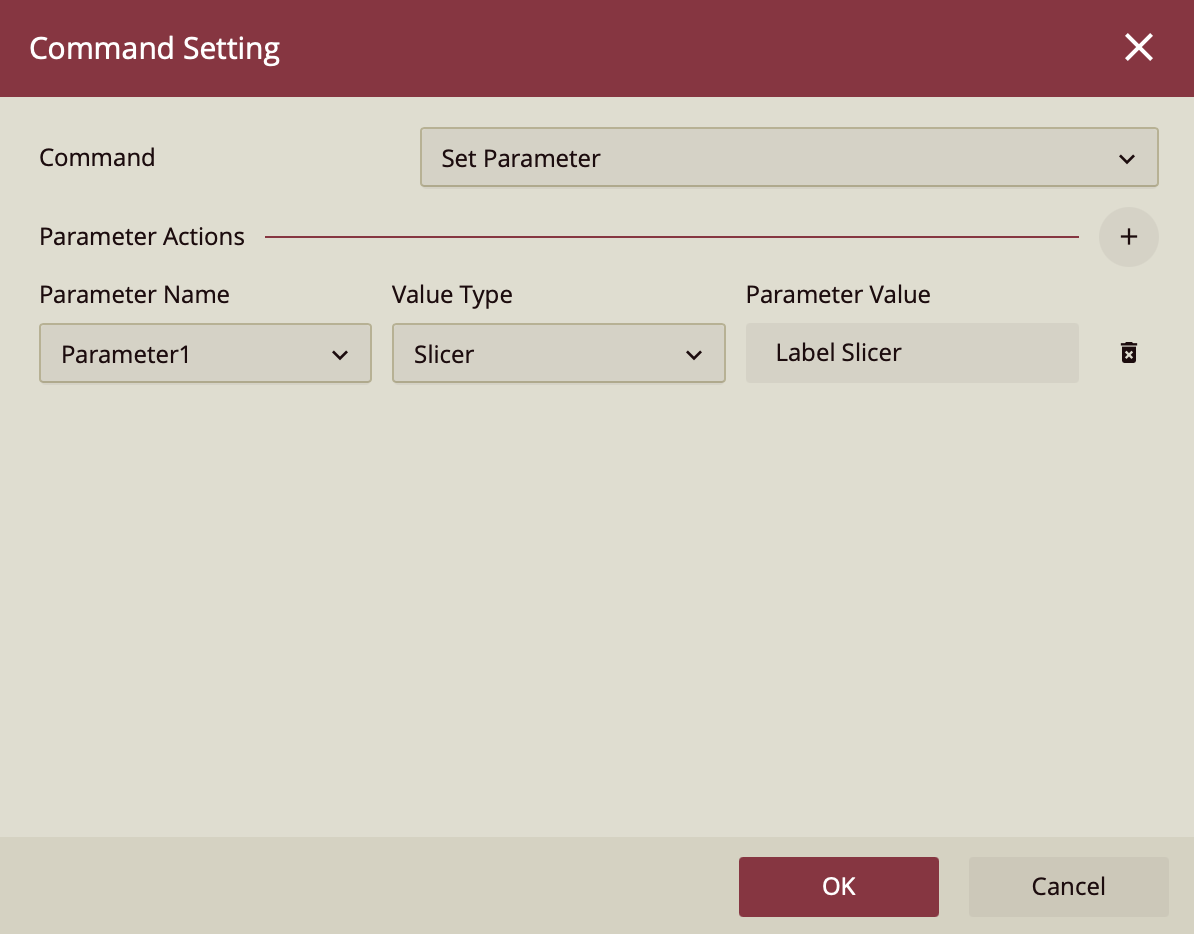
7. Add Command to Image
Next, select the image to open the image properties in the Inspector Panel. Next to the Command property, click +. In the Command Setting window set the Value Type to Slicer and set the Parameter Value to Label Slicer.
8. Preview the Dashboard
Preview your dashboard. Click on the slicer to select the categories you would like to filter for, and then click the image to apply the filter.