-
Interactive DashboardsCreate interactive BI dashboards with dynamic visuals.
-
End-User BI ReportsCreate and deploy enterprise BI reports for use in any vertical.
-
Wyn AlertsSet up always-on threshold notifications and alerts.
-
Localization SupportChange titles, labels, text explanations, and more.
-
Wyn ArchitectureA lightweight server offers flexible deployment.
-
 Wyn Enterprise 7.1 is ReleasedThis release emphasizes Wyn document embedding and enhanced analytical express...
 -
 Choosing an Embedded BI Solution for SaaS ProvidersAdding BI features to your applications will improve your products, better serve your customers, and more. But where to start? In this guide, we discuss the many options.
-
Visual GalleryInteractive sample dashboards and reports.
-
BlogExplore Wyn, BI trends, and more.
-
WebinarsDiscover live and on-demand webinars.
-
Customer SuccessVisualize operational efficiency and streamline manufacturing processes.
-
Knowledge BaseGet quick answers with articles and guides.
-
VideosVideo tutorials, trends and best practices.
-
WhitepapersDetailed reports on the latest trends in BI.
-
 Choosing an Embedded BI Solution for SaaS ProvidersAdding BI features to your applications will impr...
 -

System Diagnostic
The System Diagnostic interface on the Admin Portal displays the run-time monitoring information regarding the performance of each node or service in the Wyn Enterprise environment. As an administrator, you no longer need to access the primary or the secondary (where the worker module is installed) machine to view its system diagnostic logs. Instead, you can download these logs and the deployment health directly through the System Diagnostic interface from where you are accessing the Wyn Enterprise. You can also download these logs for a specific time or service. Apart from the system logs, you can also get the system-related information and the Wyn configuration file for the selected node.
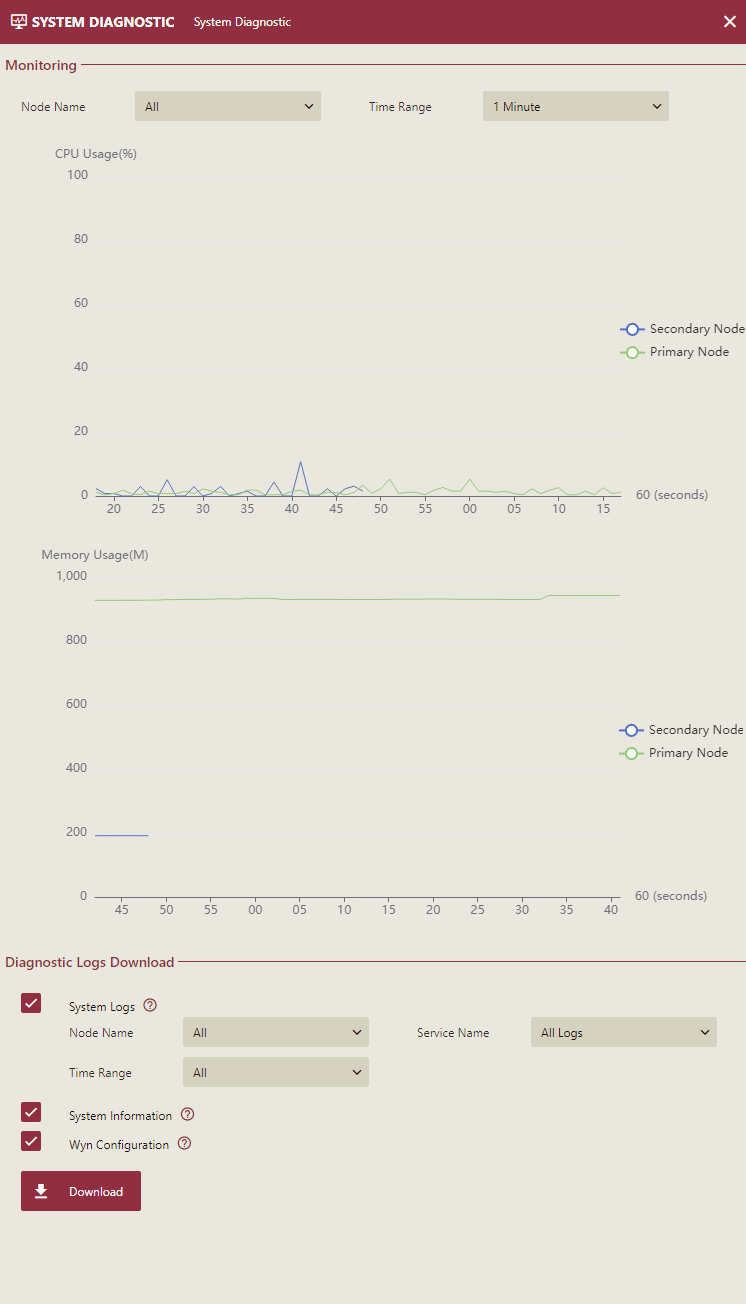
View Monitoring Information
This section describes the steps to view the monitoring information, such as the CPU usage and memory usage, for a particular node. You can also get the monitoring information for a specific time duration.
Note: The data extracted in the System Diagnostic interface is a result of the API - api/node/metrics.
On the Admin Portal, navigate to System Management > System Diagnostic.
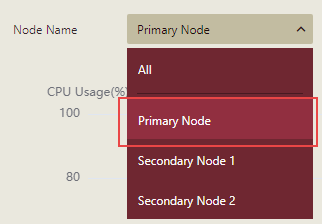
Under the Monitoring section, select the node for which you want to view the monitoring information. For example, set the Node Name to 'Primary Node'.
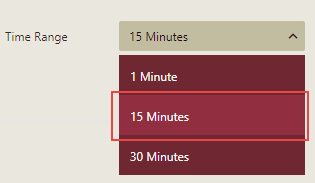
Specify the time duration for which you want to view the monitoring information, such as 1 Minute, 15 Minutes, or 30 Minutes. In the example, we set the Time Range to '15 Minutes'.
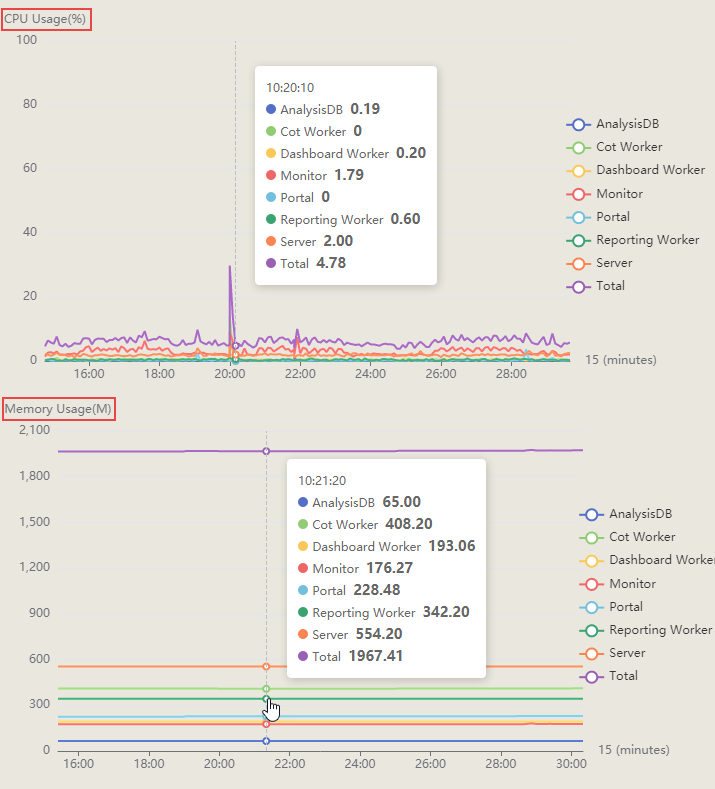
You can now view the monitoring information for each service available on the chosen node.
Download Diagnostic Logs From Node (Primary or secondary)
This section describes the steps to download the system diagnostic logs for the last month for a secondary server where the dashboard worker is installed.
On the Admin Portal, navigate to System Management > System Diagnostic.
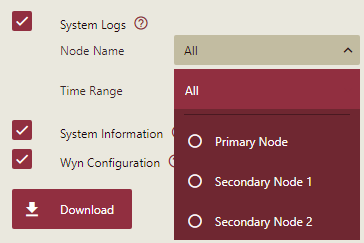
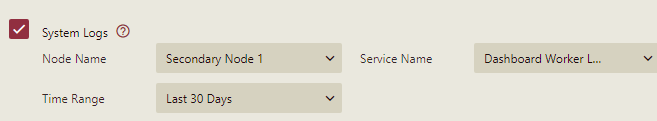
Under the Diagnostic Logs Download section, check the System Logs option and then specify the node, service, and time duration for which you want to download the diagnostic logs.
Node Name - Specify the node name from the drop-down list for which you want to download the diagnostic logs.
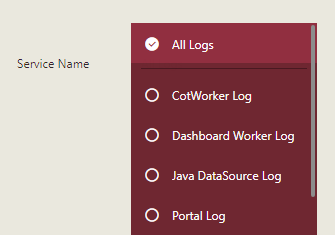
Service Name - Choose the service name for which you want to download the diagnostic logs. The following are the supported services in Wyn Enterprise- CotWorker Log, Dashboard Worker Log, Java DataSource Log, Portal Log, Report Worker Log, Server Log, and System Log. By default, 'All Logs' is selected.
Time Range: Select the time duration for which you want to download the diagnostic logs. The possible values for Time Range are All, Today, Last 1 Day, Last 7 Days, and Last 30 Days.
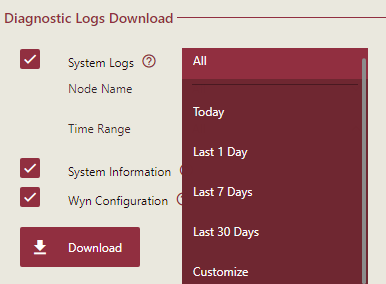
However, you can also download the logs for a custom time range by providing the start and end dates.
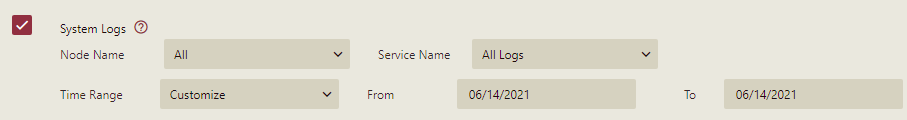
In the example below, we set the Node Name to 'Secondary Node 1', Service Name to 'Dashboard Worker Log', and Time Range to 'Last 30 Days'.
Check the System Information option to download the system-related information, such as the type of operating system and system version.

Check the Wyn Configuration option to download the desensitized Wyn configuration file.

Finally, click the Download button to get the system diagnostic information. The diagnostic logs are downloaded as a .zip file on your system.
Monitoring Kubernetes Deployment Environment
Download Diagnostic Logs
To download the system diagnostic logs in a Kubernetes (K8s) deployment environment,
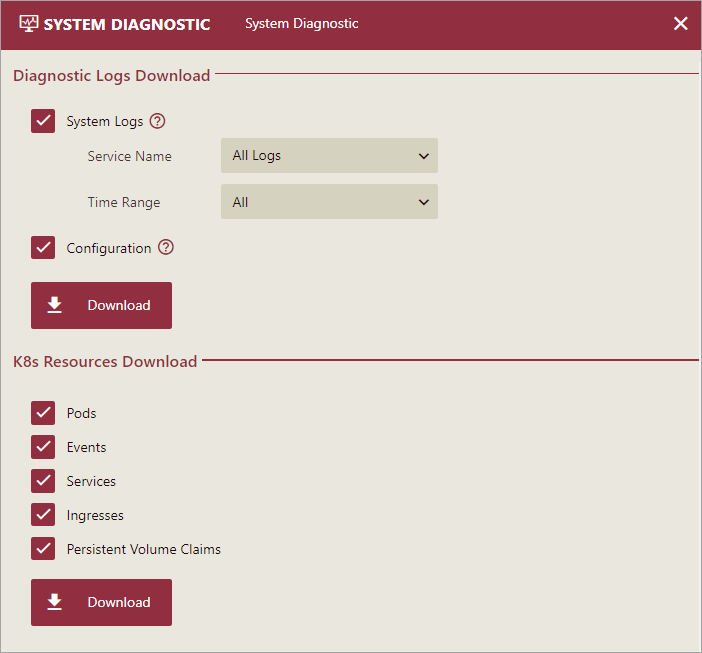
On the Admin Portal, navigate to System Management > System Diagnostic.
Under the Diagnostic Logs Download section, select the service name (All Logs, CotWorker Log, Dashboard Worker Log, Java DataSource Log, Portal Log, Report Worker Log, Server Log, and System Log) and time range (All, Today, Last 1 Day, Last 7 Days, and Last 30 Days) from the dropdown and click the Download button.
Check the Configuration option to download the desensitized Wyn configuration file.
The diagnostic logs file is downloaded in the downloads folder of your system as a .zip file. Logs are saved in the .txt files.
Important limitations when using the download diagnostic logs feature in the K8s deployment environment,
Only the logs of Wyn Enterprise can be downloaded using the Download button on System Diagnostic.
If the logs are not stored in the persistent storage, only the Wyn server logs can be downloaded.
To download logs, ensure all logs are stored in the same persistent storage.
Download Health Check Data
Similar to the above, you can determine the health of complex scenarios in the Kubernetes deployment by obtaining K8s resources.
Follow the process elaborated in the Monitoring Kubernetes Cluster topic to enable the UI to download information on k8 resources: Pods, Services, Events, Ingresses, and Persistent Volume Claims.
On the Admin Portal, navigate to System Management > System Diagnostic.
Under K8s Resources Download, select the checkboxes for which you want to download the information.
Click the Download button.