-
Interactive DashboardsCreate interactive BI dashboards with dynamic visuals.
-
End-User BI ReportsCreate and deploy enterprise BI reports for use in any vertical.
-
Wyn AlertsSet up always-on threshold notifications and alerts.
-
Localization SupportChange titles, labels, text explanations, and more.
-
Wyn ArchitectureA lightweight server offers flexible deployment.
-
 Wyn Enterprise 7.1 is ReleasedThis release emphasizes Wyn document embedding and enhanced analytical express...
 -
 Choosing an Embedded BI Solution for SaaS ProvidersAdding BI features to your applications will improve your products, better serve your customers, and more. But where to start? In this guide, we discuss the many options.
-
Visual GalleryInteractive sample dashboards and reports.
-
BlogExplore Wyn, BI trends, and more.
-
WebinarsDiscover live and on-demand webinars.
-
Customer SuccessVisualize operational efficiency and streamline manufacturing processes.
-
Knowledge BaseGet quick answers with articles and guides.
-
VideosVideo tutorials, trends and best practices.
-
WhitepapersDetailed reports on the latest trends in BI.
-
 Choosing an Embedded BI Solution for SaaS ProvidersAdding BI features to your applications will impr...
 -

- Getting Started
- Administration Guide
-
User Guide
- An Introduction to Wyn Enterprise
- Document Portal for End Users
- Data Governance and Modeling
- View and Manage Documents
- Working with Resources
- Working with Reports
- Working with Dashboards
- Working with Notebooks
- Wyn Analytical Expressions
- Section 508 Compliance
- Subscribe to RSS Feed for Wyn Builds Site
- Developer Guide
Union Operation in Direct Datasets
The Union operation in a Direct Dataset allows you to combine rows from two tables into a single result set. Unlike a join, which merges tables horizontally based on matching fields, a union appends records vertically. This makes it ideal for combining data that shares the same structure but represents different segments, such as regions, departments, or time periods.
Before creating a Direct Dataset that uses a union, ensure that you have already created a data source in Wyn. For this example, you can follow the steps described in the Connect to Excel article to create an Excel data source.
For demonstration purposes, this example uses:
An Excel data source
A data model containing two tables:
Sales_North_Region
Sales_South_Region
When to Use Union vs. Union All
When configuring a union, you can select either Union or Union All.
Union
Removes duplicate rows from the final result set.
Use this option when:
You expect potential duplicate records.
You want a distinct, consolidated dataset.
Data overlap may exist between tables.
Union All
Retains all rows, including duplicates.
Use this option when:
The tables represent distinct segments (for example, different regions).
You are certain there are no duplicates.
Performance is a priority (Union All is typically faster because it does not perform duplicate elimination).
In regional reporting scenarios, such as combining North and South sales, Union All is often appropriate because the datasets are distinct.
Creating a Union in a Direct Dataset
To configure a Union relationship:
In the Resource Portal, select Create (+).
Under Prepare Data, select Direct Dataset.
In the Data Sources and Datasets dropdown (top-left corner), search for the data source you previously created.
Drag the first table onto the Relationships designer surface.
Drag the second table toward the designer surface.
As you drag the second table, three options appear at partial opacity:
Union
Join
Replace
Move your cursor over Union. When the button becomes fully opaque and highlighted, release the mouse. The Union configuration window opens.
Configuring the Union Window
In the Union window, you can:
Select the Union Type
Choose either Union or Union All, depending on your requirements.
Add Union Conditions
Click + Add Union Condition to manually map fields between the two tables.
The configuration grid includes:
Output Field Name – The name of the resulting field in the combined dataset.
First Table Column – The selected column from Table 1.
Second Table Column – The corresponding column from Table 2.
If both tables share identical field names and compatible data types, Wyn may automatically map them. However, you can modify mappings as needed.
You may also:
Add additional output rows for calculated or renamed fields.
Remove a field mapping by selecting the trash icon on the right side of the row.
Adjust which columns correspond to each other using the dropdown selectors.
Each output field must map to compatible data types across both tables.
After configuring the mappings:
Click Save in the Union window.
Click Save again in the upper ribbon of the Dataset Designer to persist the dataset.
Example: Combining Regional Sales Tables
In this example, we combine two sales tables:
Sales_North_Region
Order ID | Member ID | Gender | Sale Amount |
|---|---|---|---|
N-1001 | V009 | Male | 150 |
N-1002 | V010 | Female | 220.5 |
N-1003 | V011 | Female | 85 |
Sales_South_Region
Order ID | Member ID | Gender | Sale Amount |
|---|---|---|---|
S-2001 | V055 | Female | 310 |
S-2002 | V056 | Male | 125.75 |
S-2003 | V057 | Male | 90 |
You can download the Excel file used in this example here:
Steps to Combine the Tables
In the Dataset Designer, open the Data Sources and Datasets dropdown.
Search for Sales (North and South Regions).
Drag Sales_North_Region onto the Relationships designer.
Drag Sales_South_Region toward the designer.
Hover over Union until it becomes fully opaque.
Release the mouse to open the Union window.
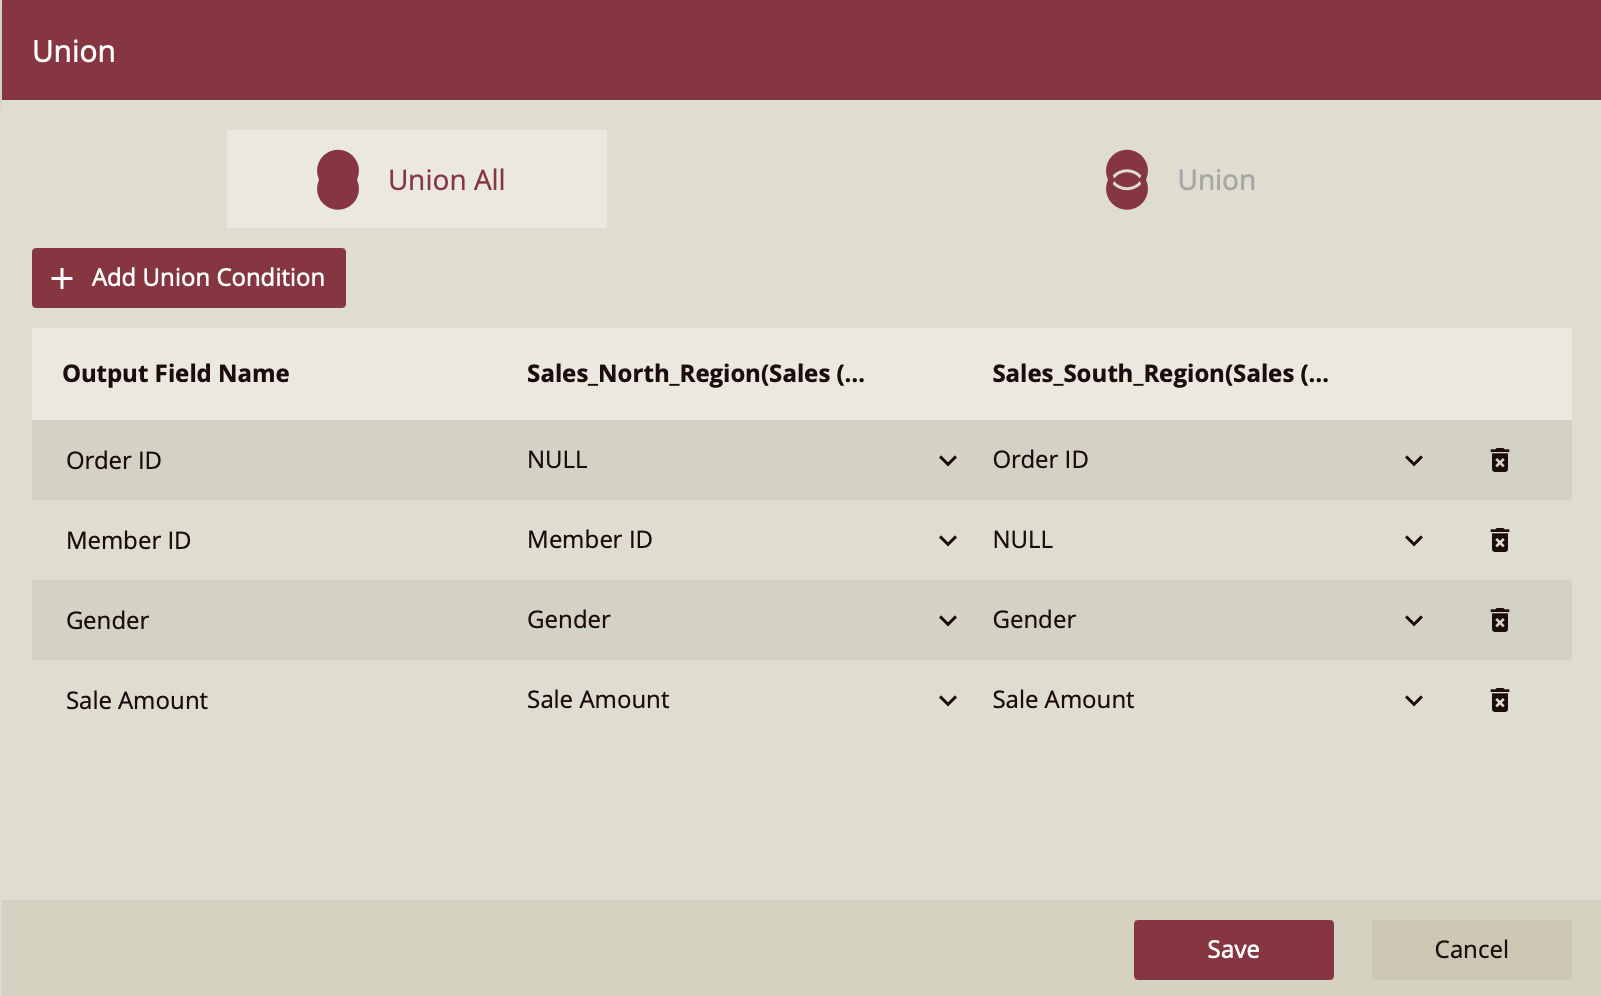
Because both tables share identical field structures, Wyn automatically aligns:
Order ID → Order ID
Member ID → Member ID
Gender → Gender
Sale Amount → Sale Amount
Select Union All (recommended in this case, as the regions are distinct and duplicate orders are unlikely).
Click Save in the Union window.
Then click Save in the Dataset Designer ribbon.
Resulting Dataset
The final dataset appends the rows from both tables:
Order ID | Member ID | Gender | Sale Amount |
|---|---|---|---|
N-1001 | V009 | Male | 150 |
N-1002 | V010 | Female | 220.5 |
N-1003 | V011 | Female | 85 |
S-2001 | V055 | Female | 310 |
S-2002 | V056 | Male | 125.75 |
S-2003 | V057 | Male | 90 |
This unified dataset can now be used in reports to analyze sales across both regions without requiring separate visualizations.
Key Considerations
Both tables must have compatible column structures.
Data types must match between mapped fields.
Use Union when duplicate elimination is required.
Use Union All when combining distinct datasets for performance and completeness.
Always save both the Union configuration and the Dataset Designer.