- Getting Started
- Administration Guide
-
User Guide
- An Introduction to Wyn Enterprise
- Document Portal for End Users
- Data Governance and Modeling
- Working with Resources
- Working with Reports
-
Working with Dashboards
- Dashboard Designer
- Selecting a Dataset
- Data Attributes
- Dashboard Scenarios
- Dashboard Templates
- Component Templates
- 3D Scene
- Explorer
- Visualization Wizard
- Data Analysis and Interactivity
- Dashboard Appearance
- Preview Dashboard
- Export Dashboard
- Dashboard Lite Viewer
- Using Dashboard Designer
- Animating Dashboard Components
- Document Binder
- Dashboard Insights
- View and Manage Documents
- Understanding Wyn Analytical Expressions
- Section 508 Compliance
- Subscribe to RSS Feed for Wyn Builds Site
- Developer Guide
Data Table
A Data Table is a standard table layout that displays the data in a tabular form. You can use a data table to view the original data of the dataset.
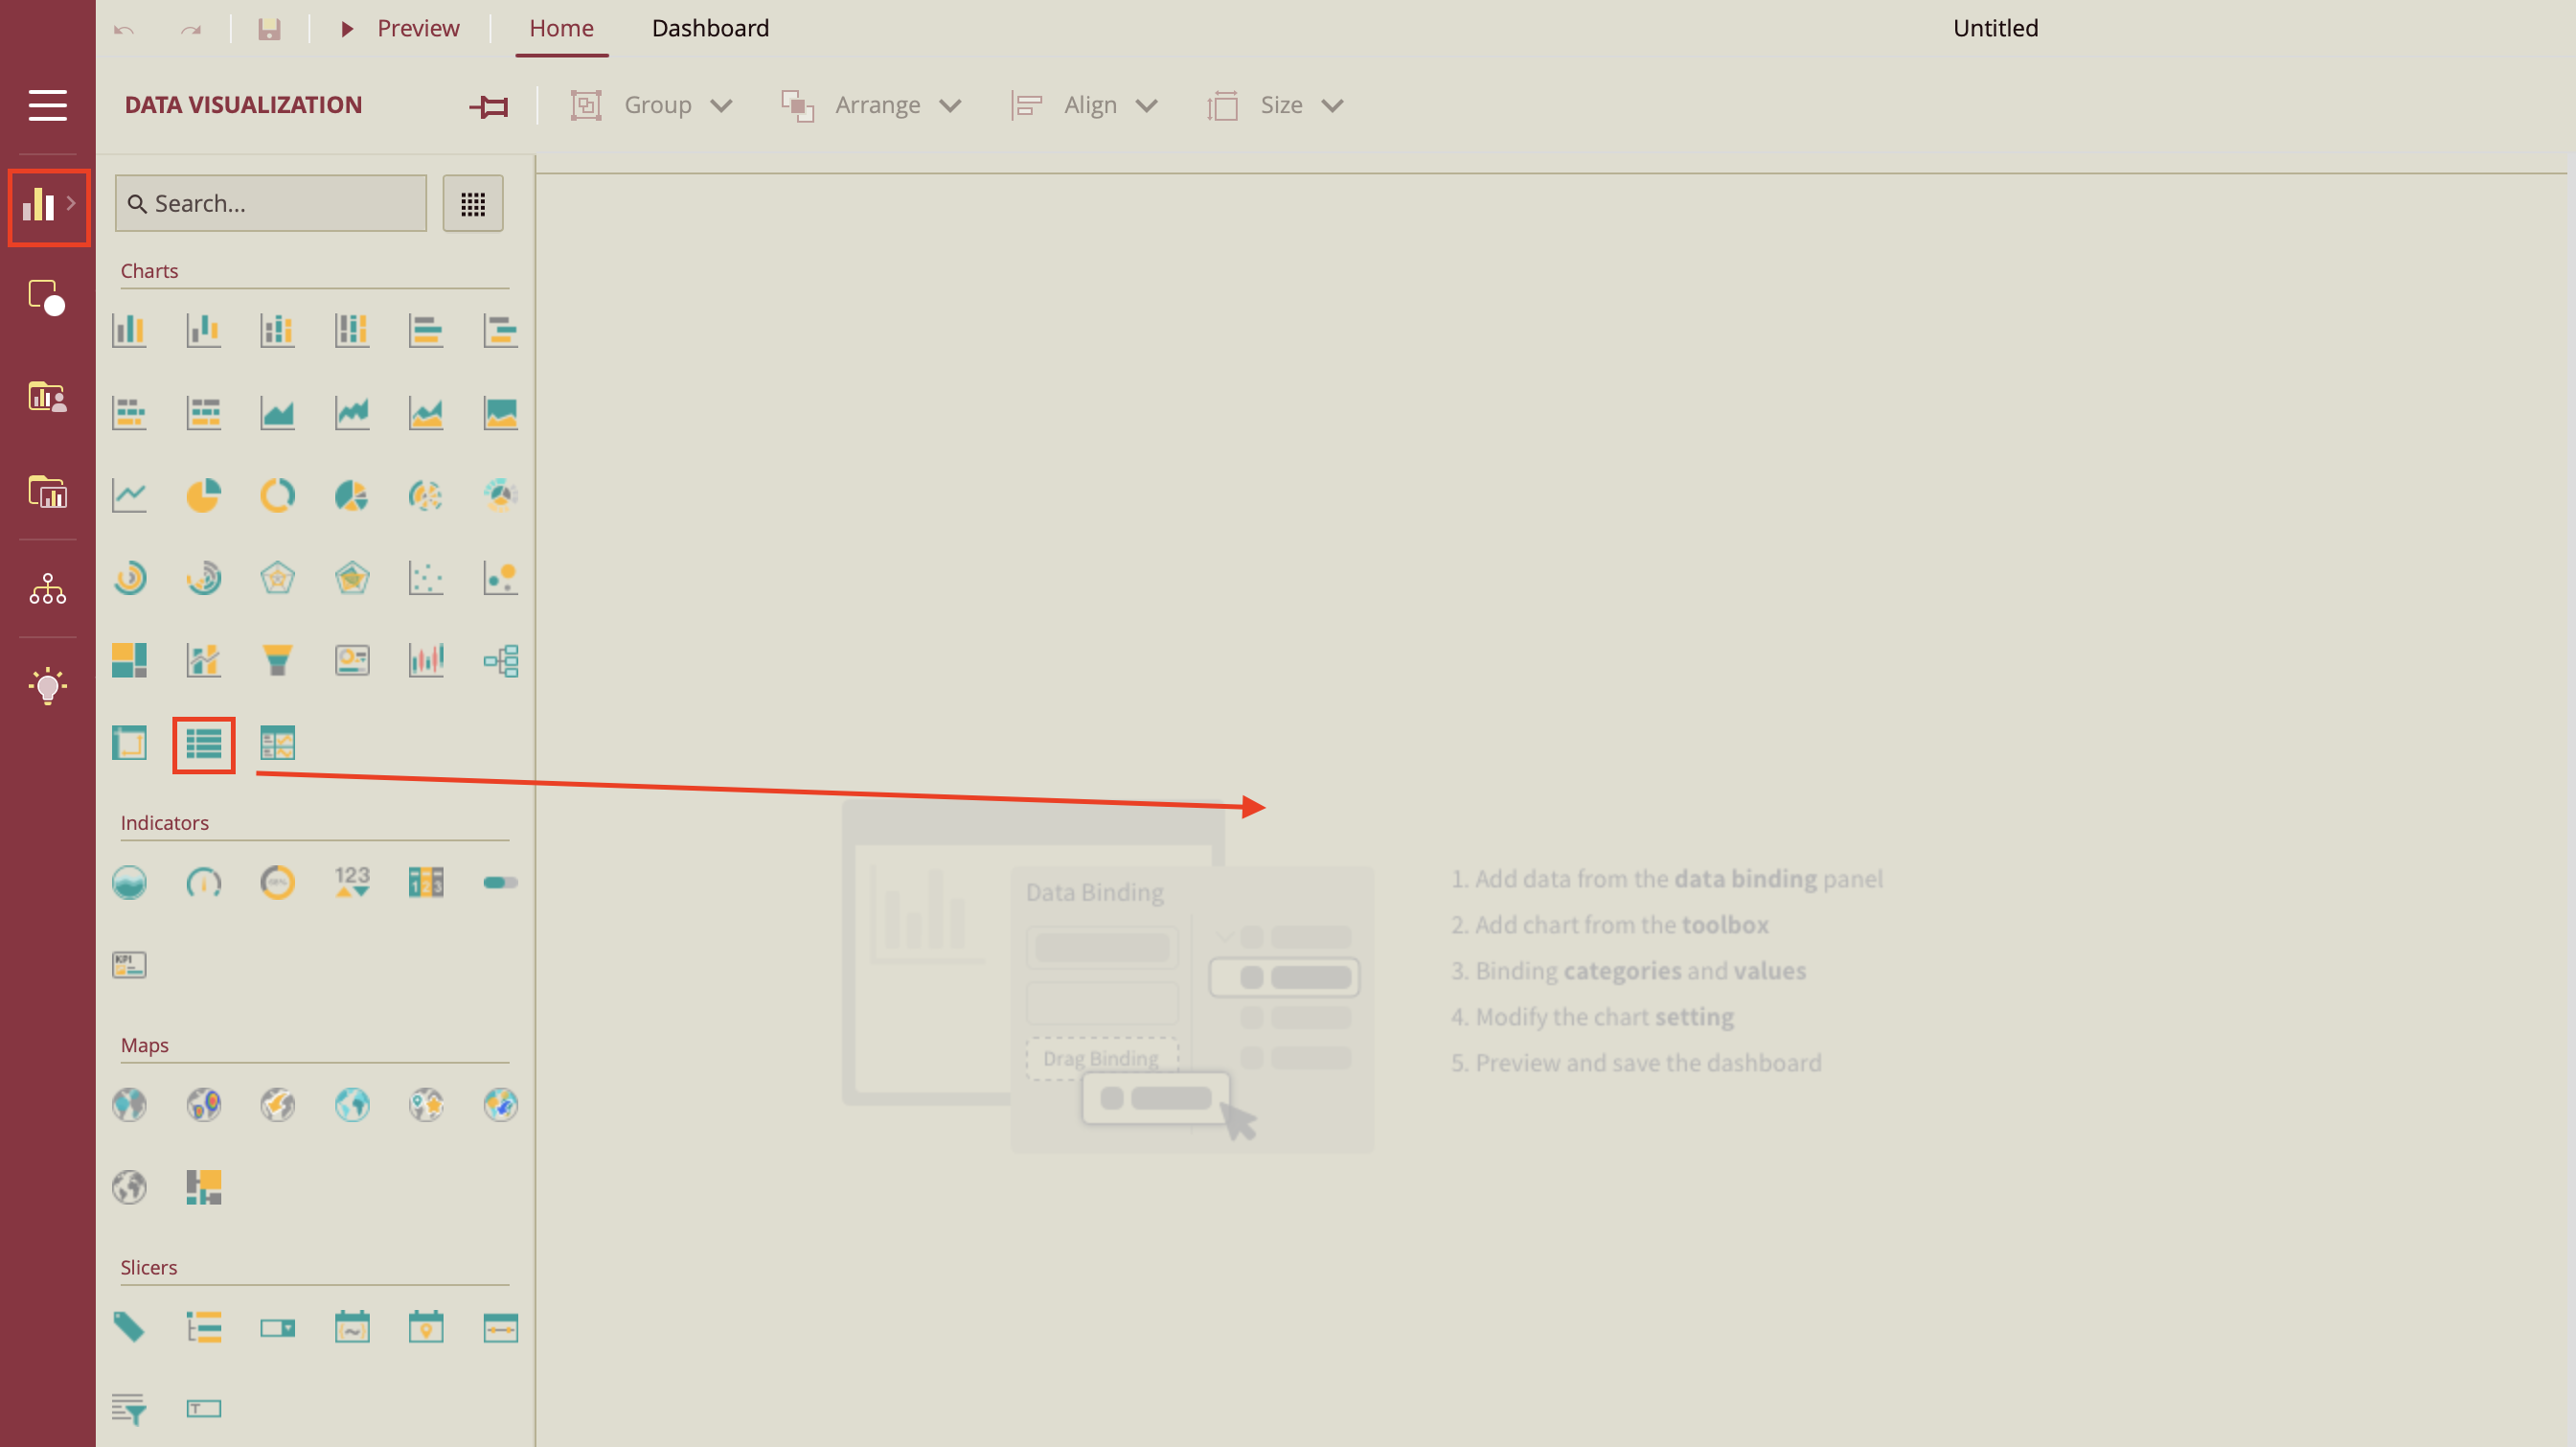
Design a Data Table
To design a data table, click on the Data Visualization node from the dashboard toolbox, and drag and drop the Data Table scenario onto the designer.
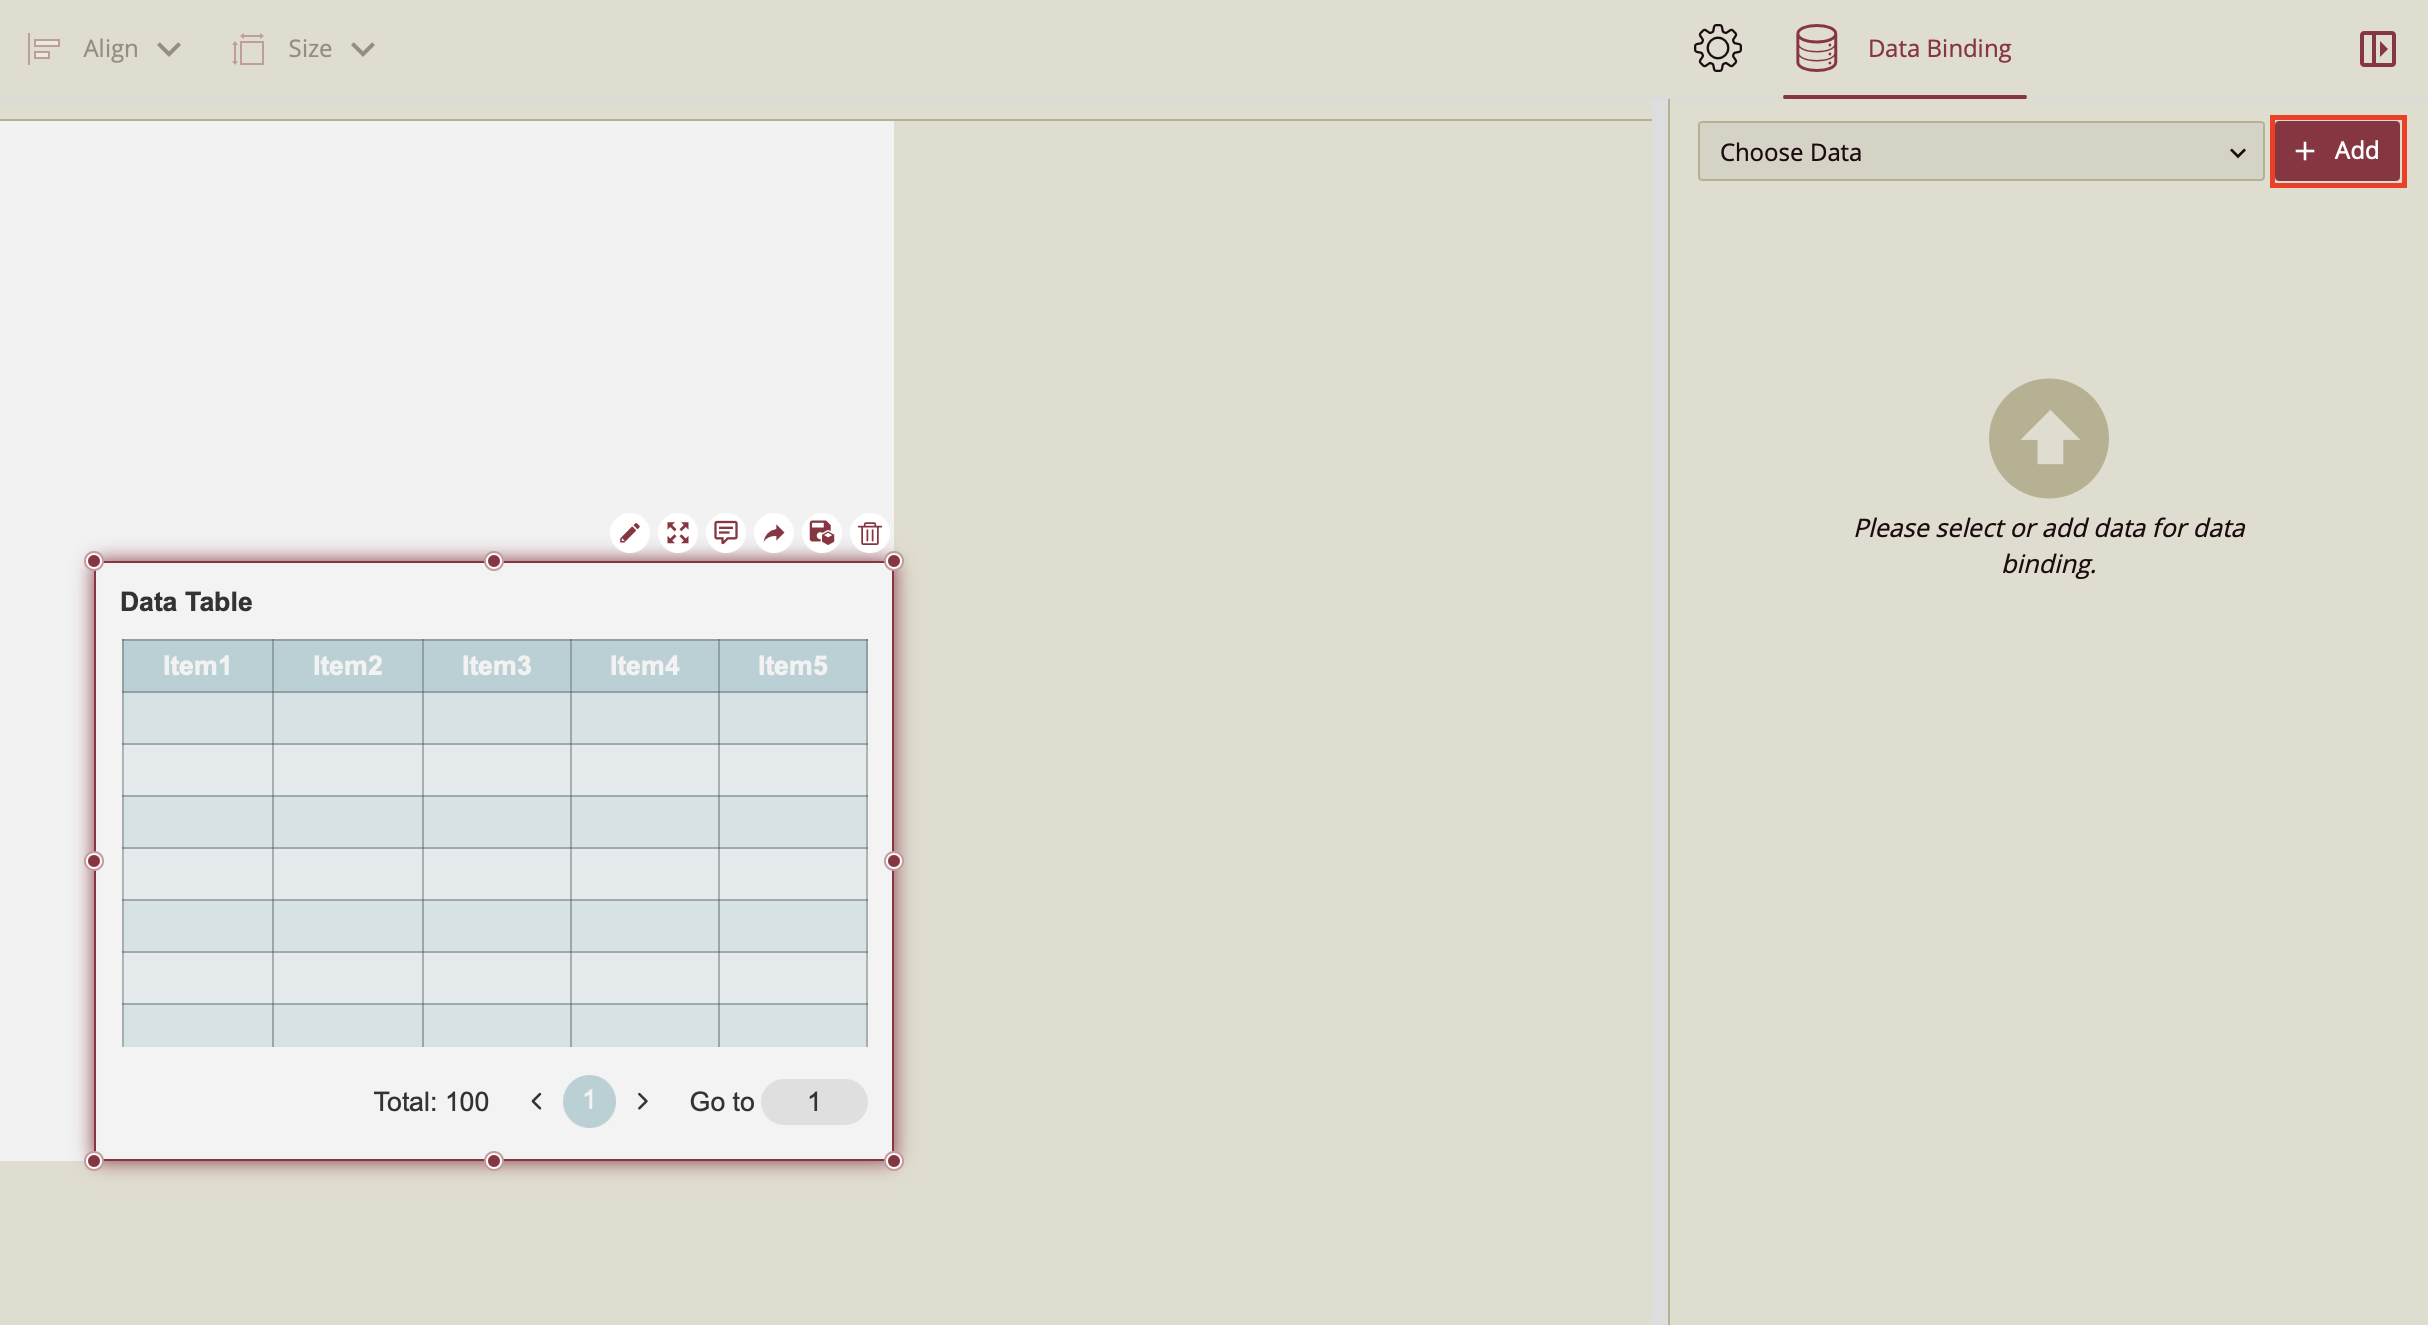
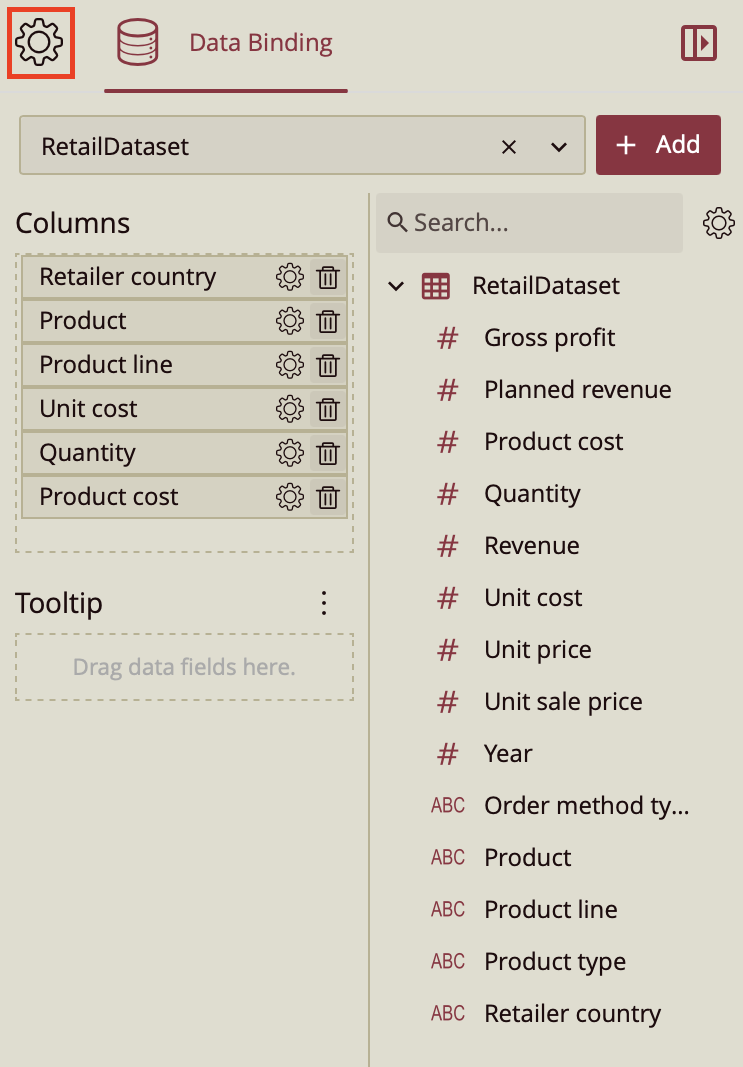
On the right-hand side, you will notice that the Data Binding tab is open. Click Add to add a dataset to work with. Select the dataset you wish to work with.
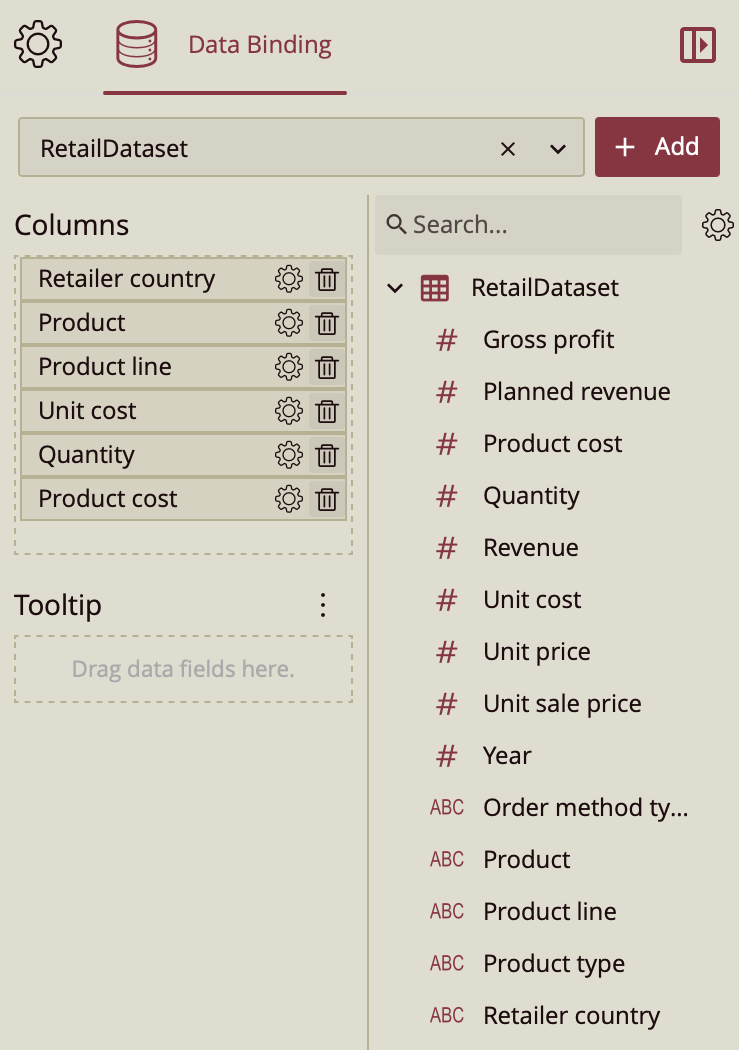
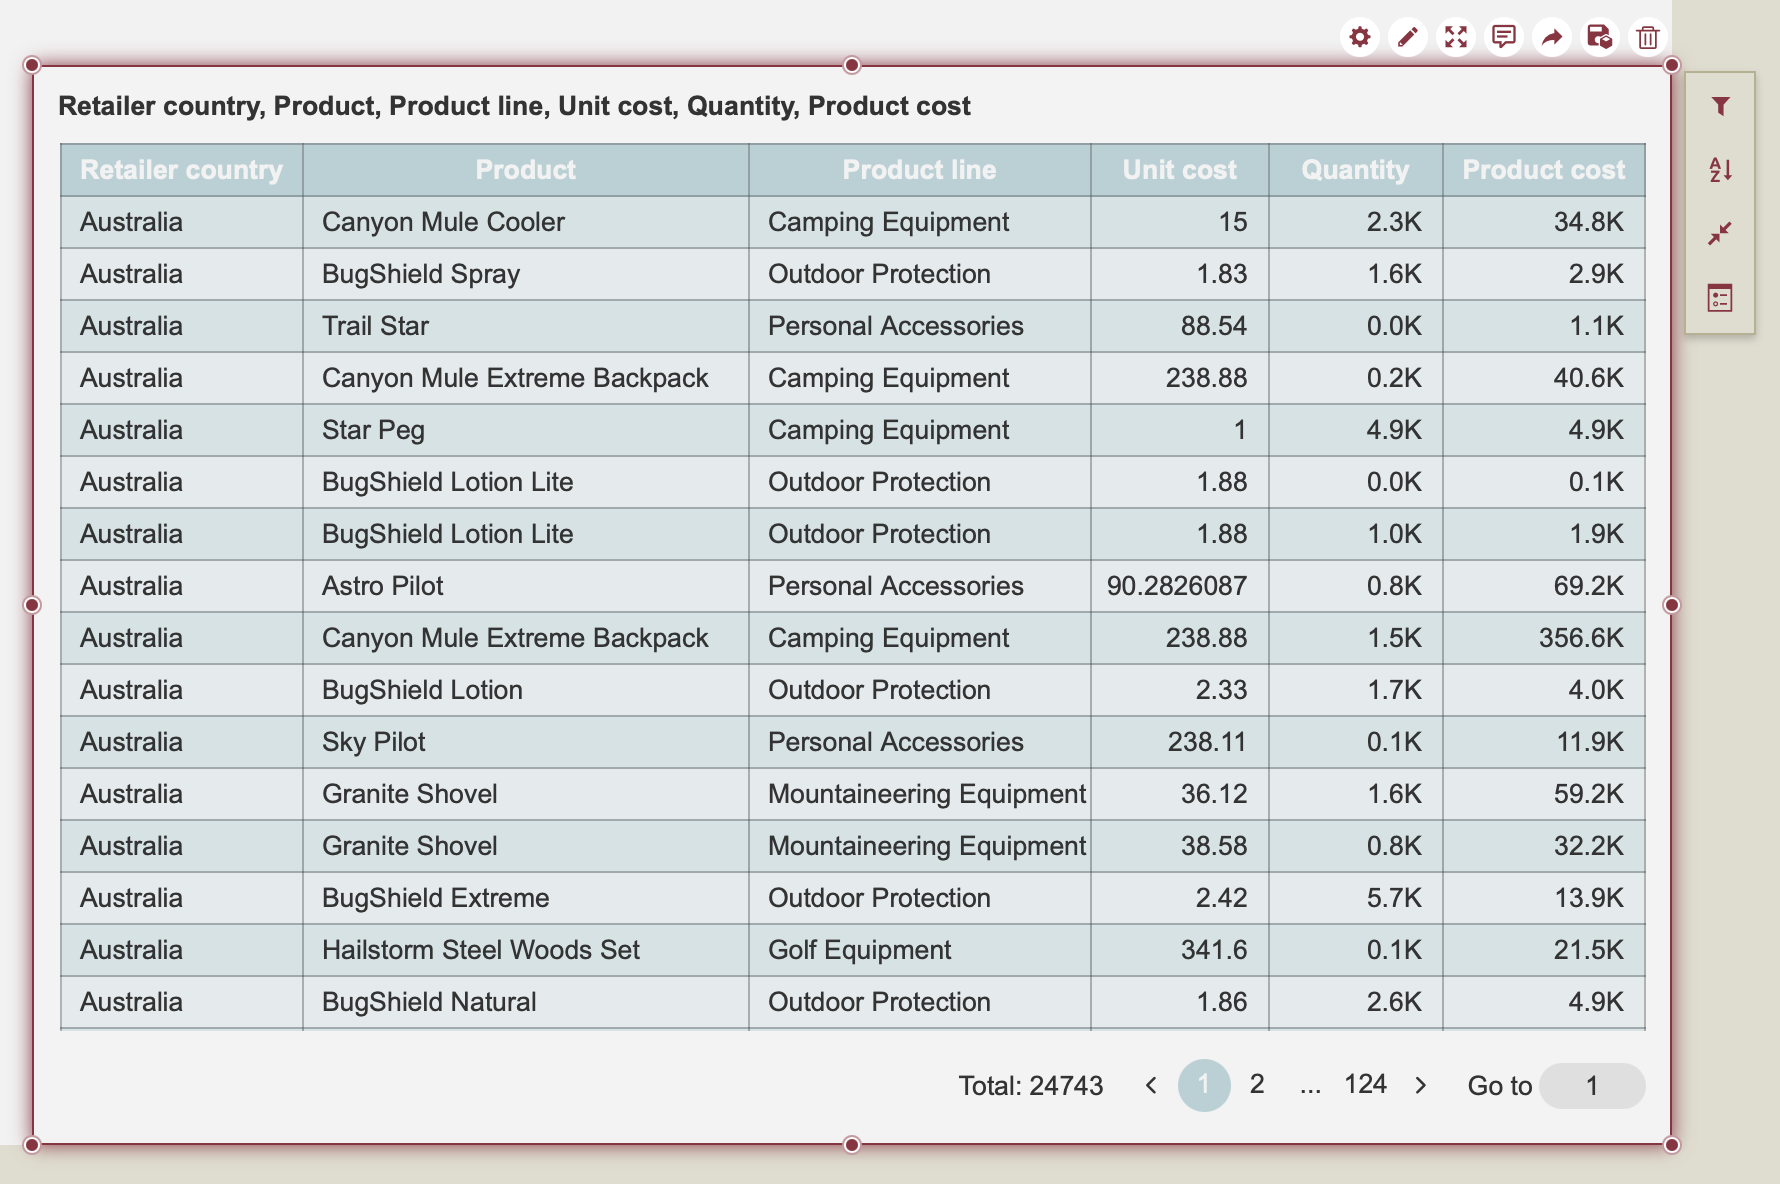
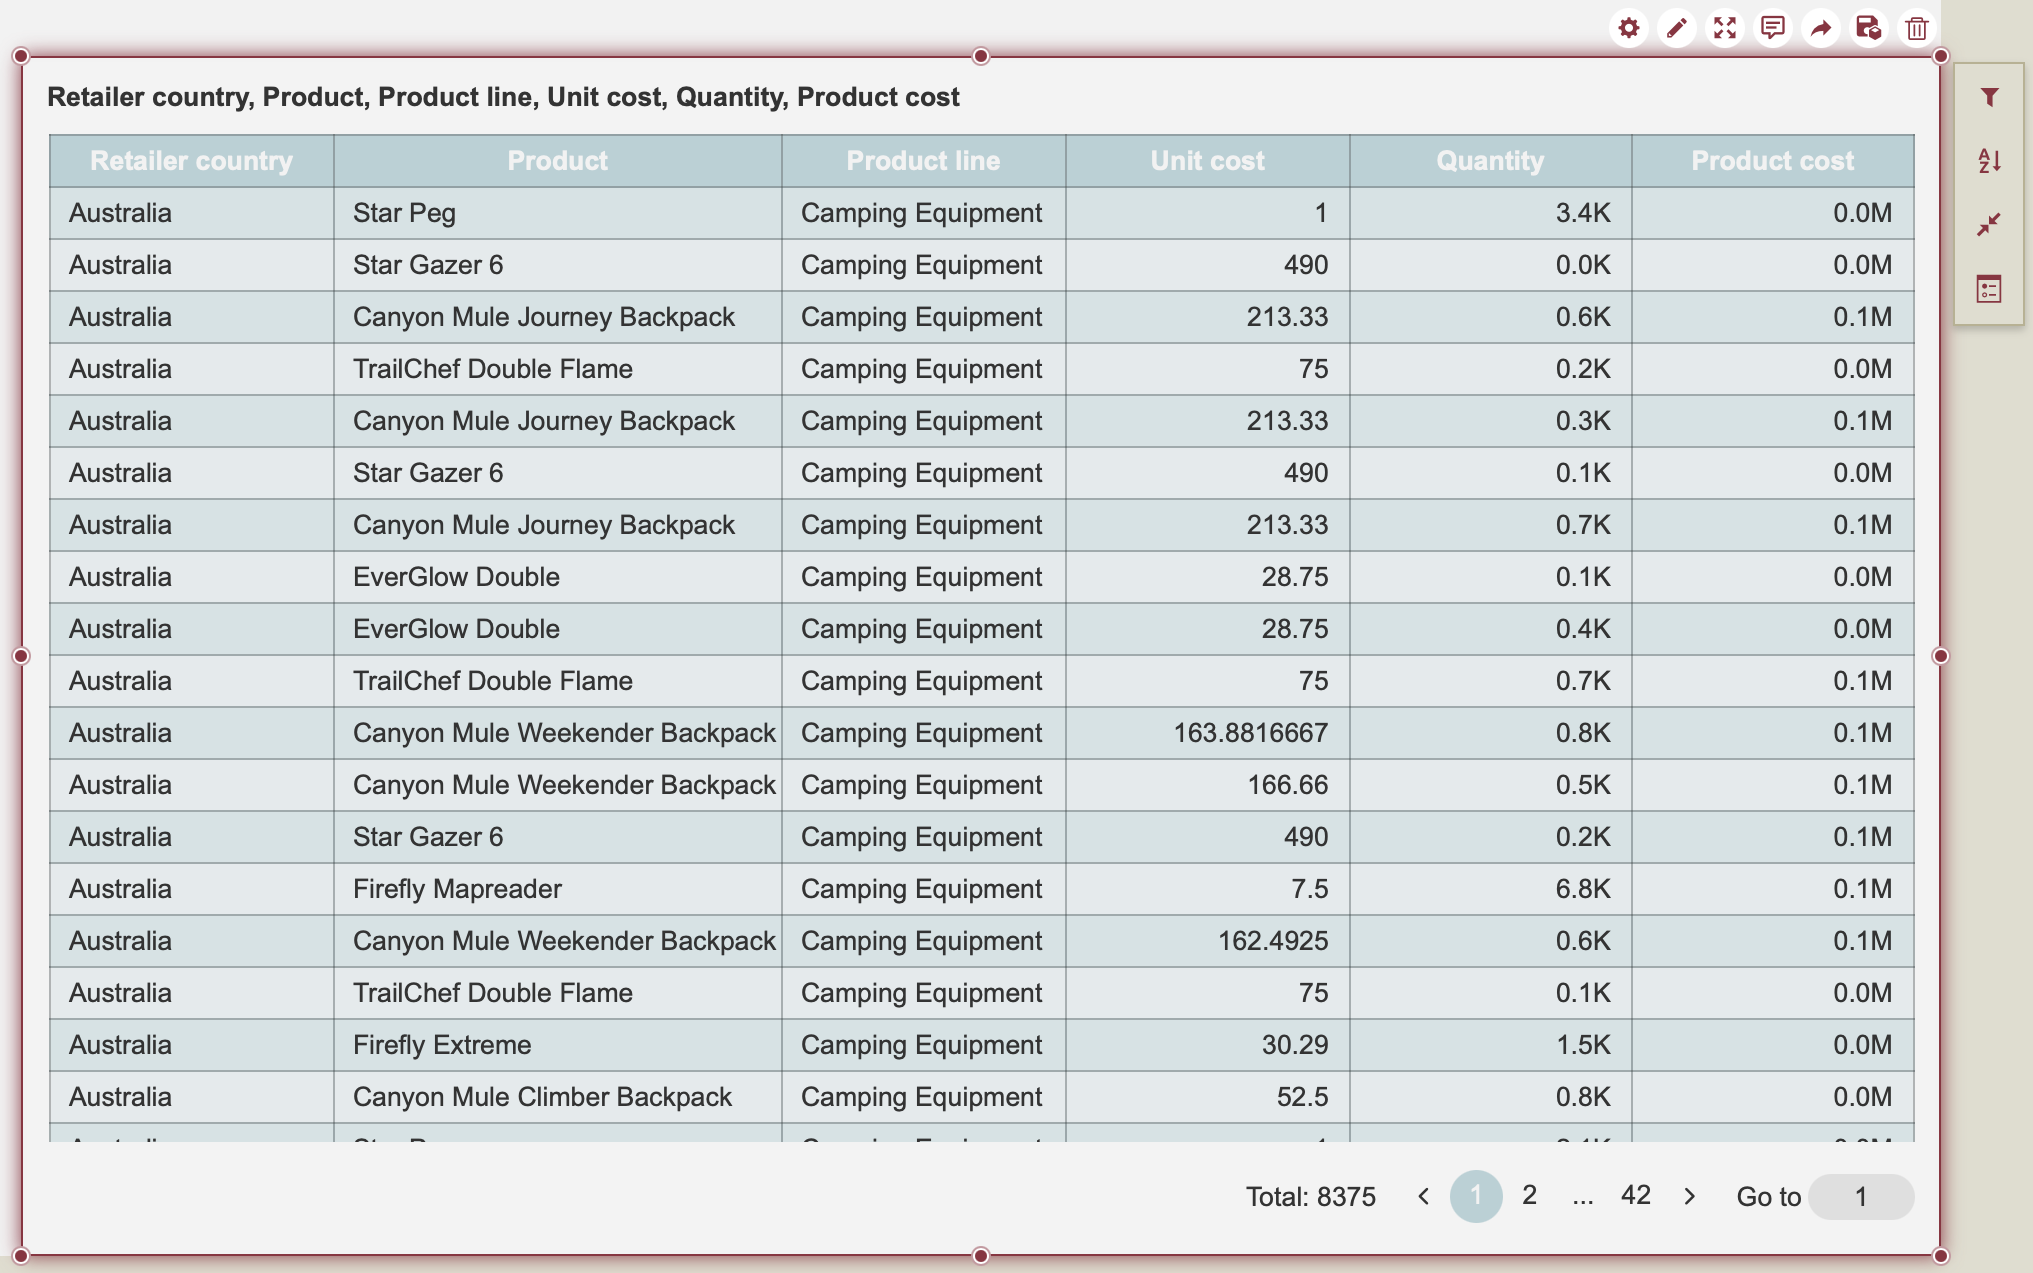
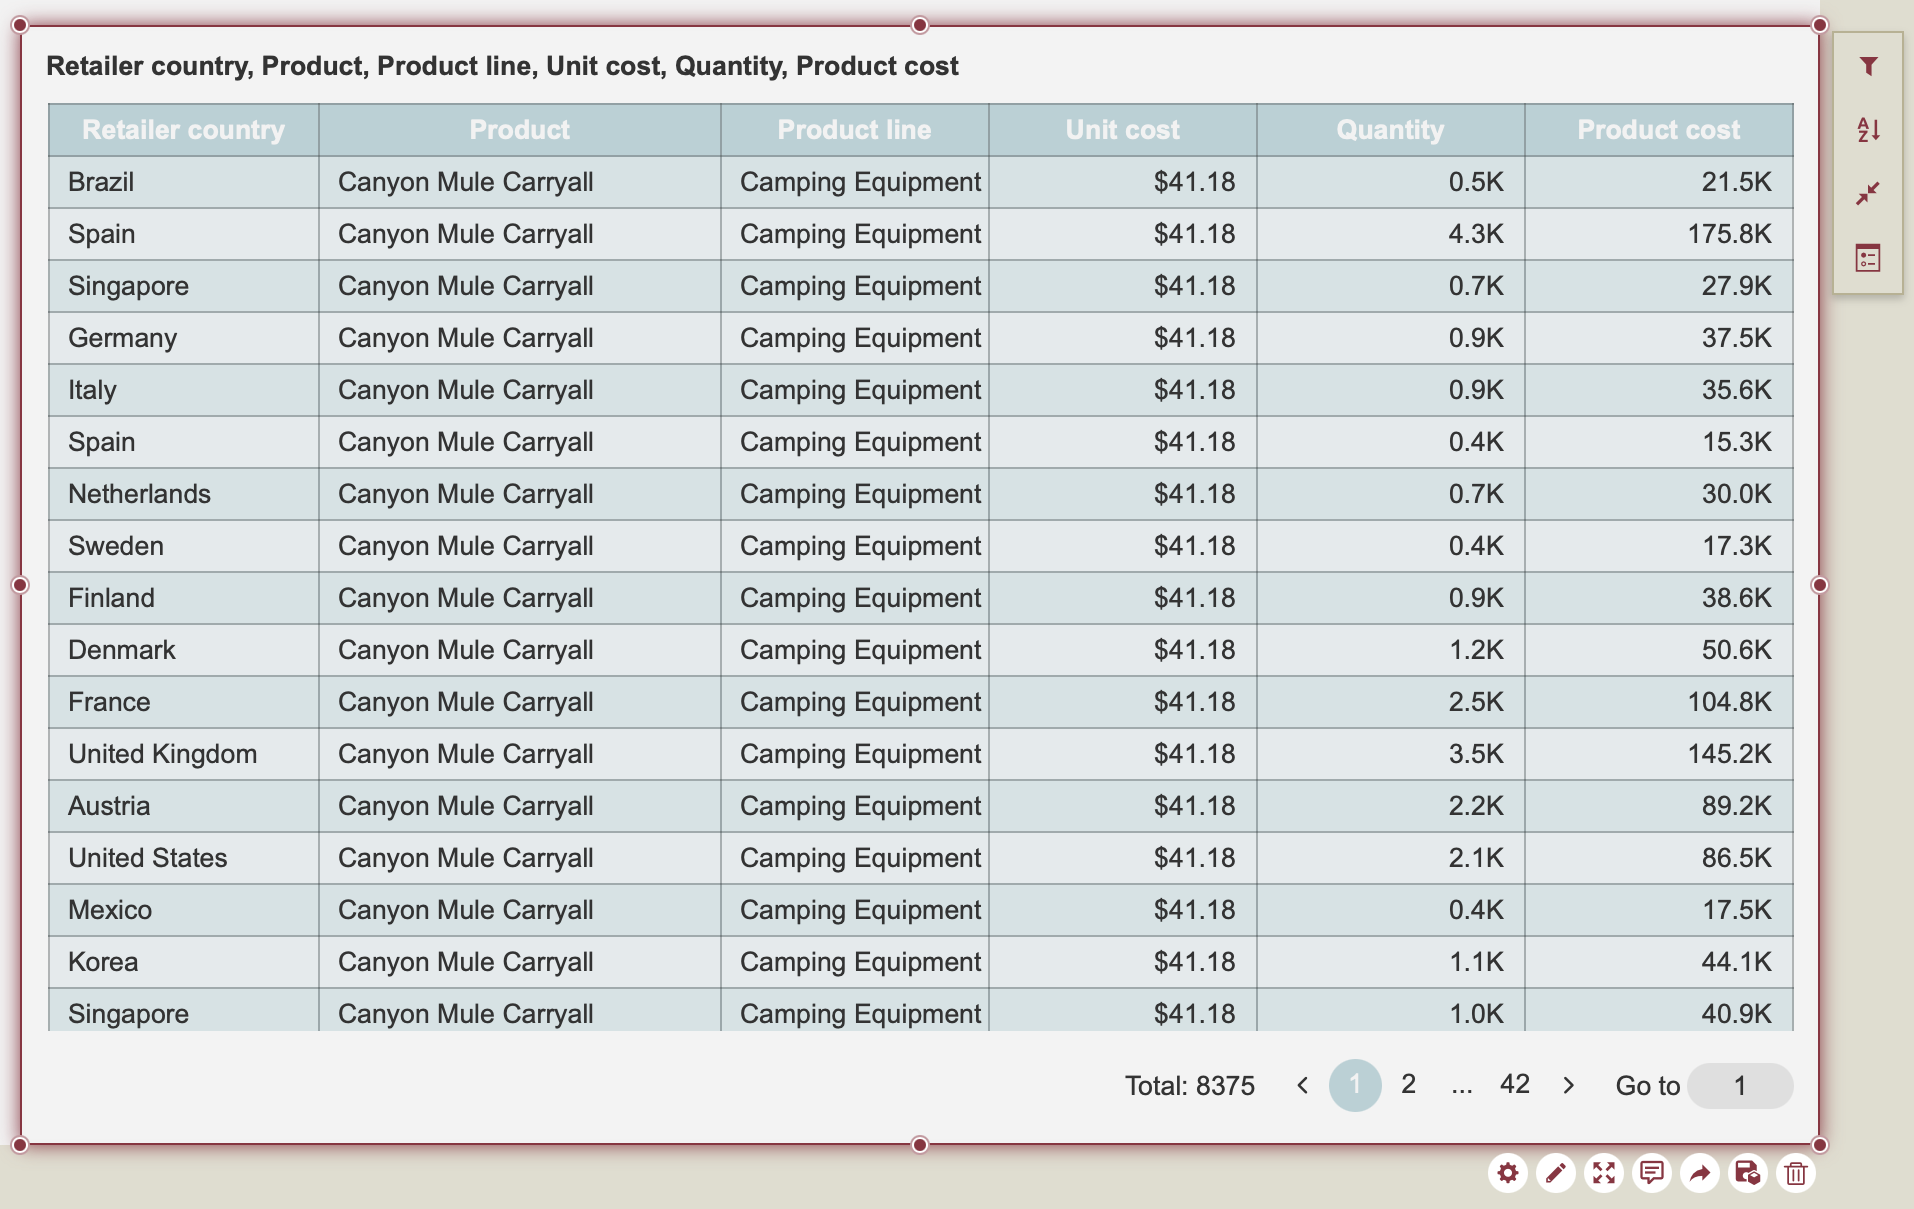
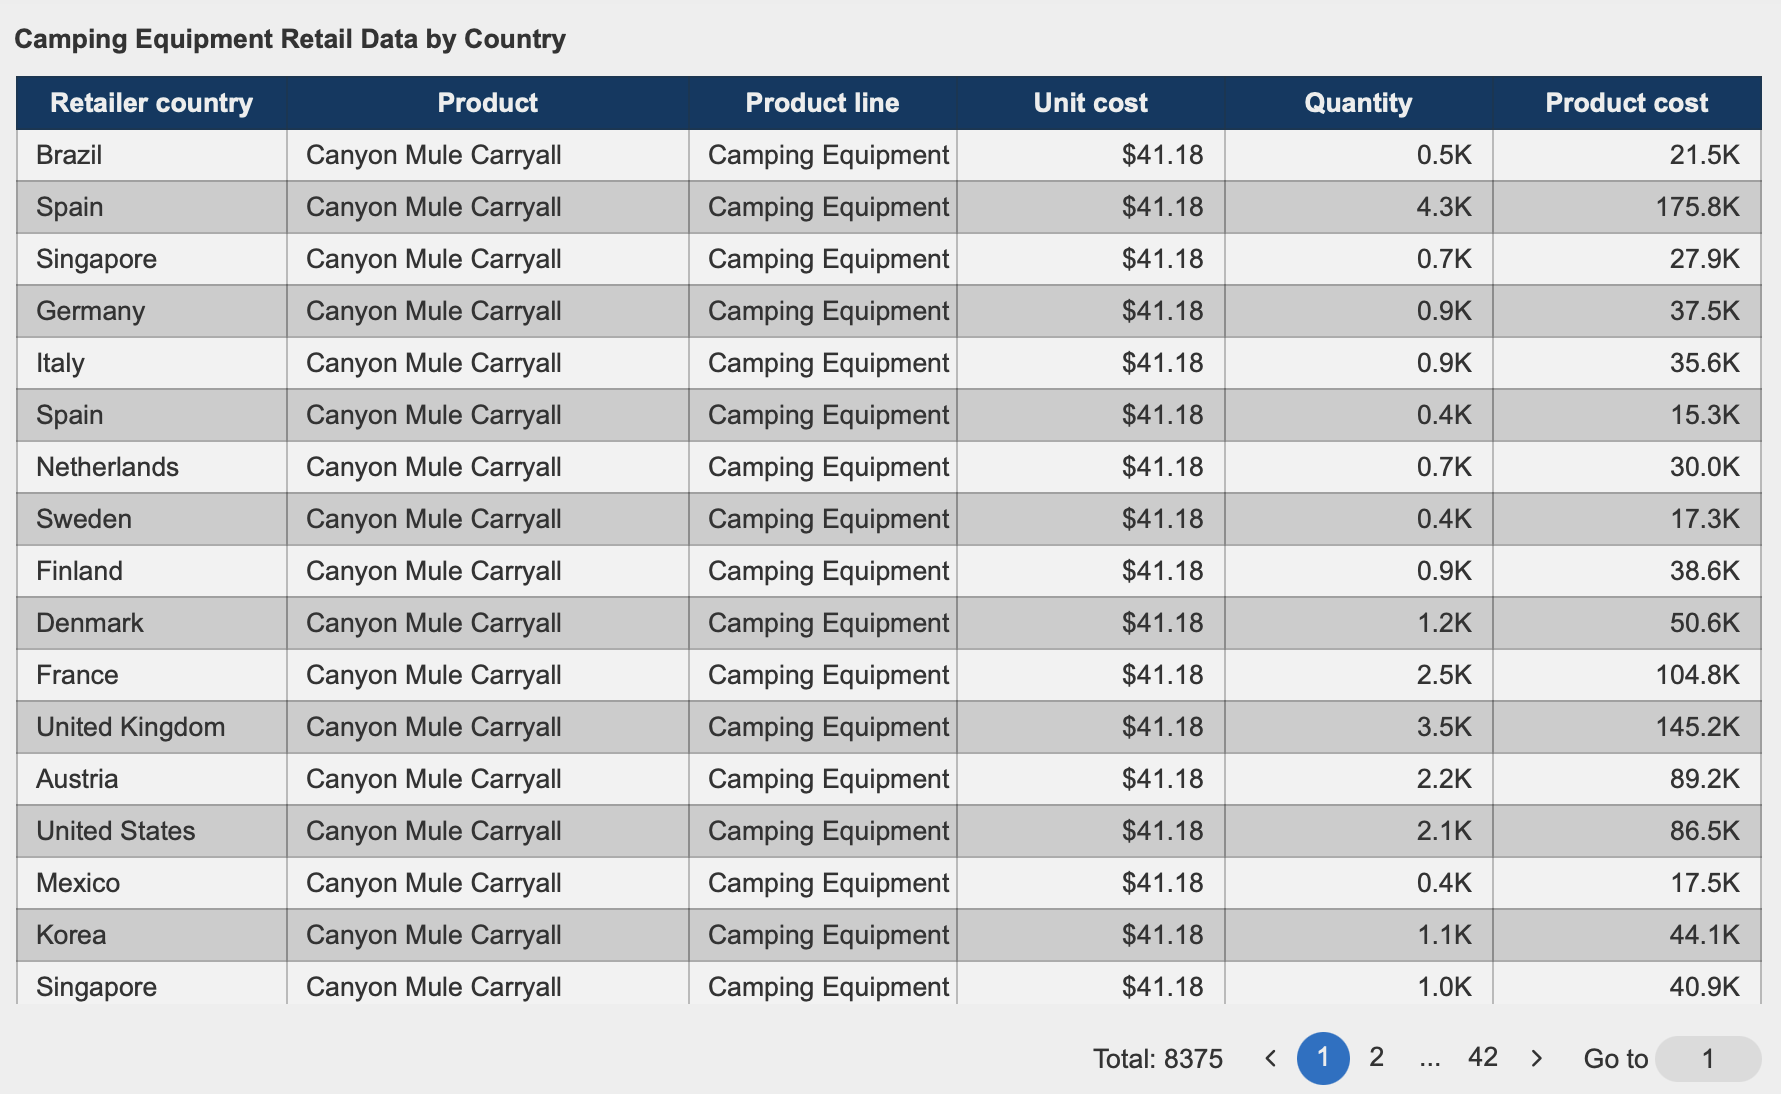
Drag and drop the dataset values onto the Columns binding slot. In the following example, we have chosen to display the "Retailer country", "Product", "Product line", "Unit Cost", "Quantity", and "Product Cost" data from the RetailDataset.
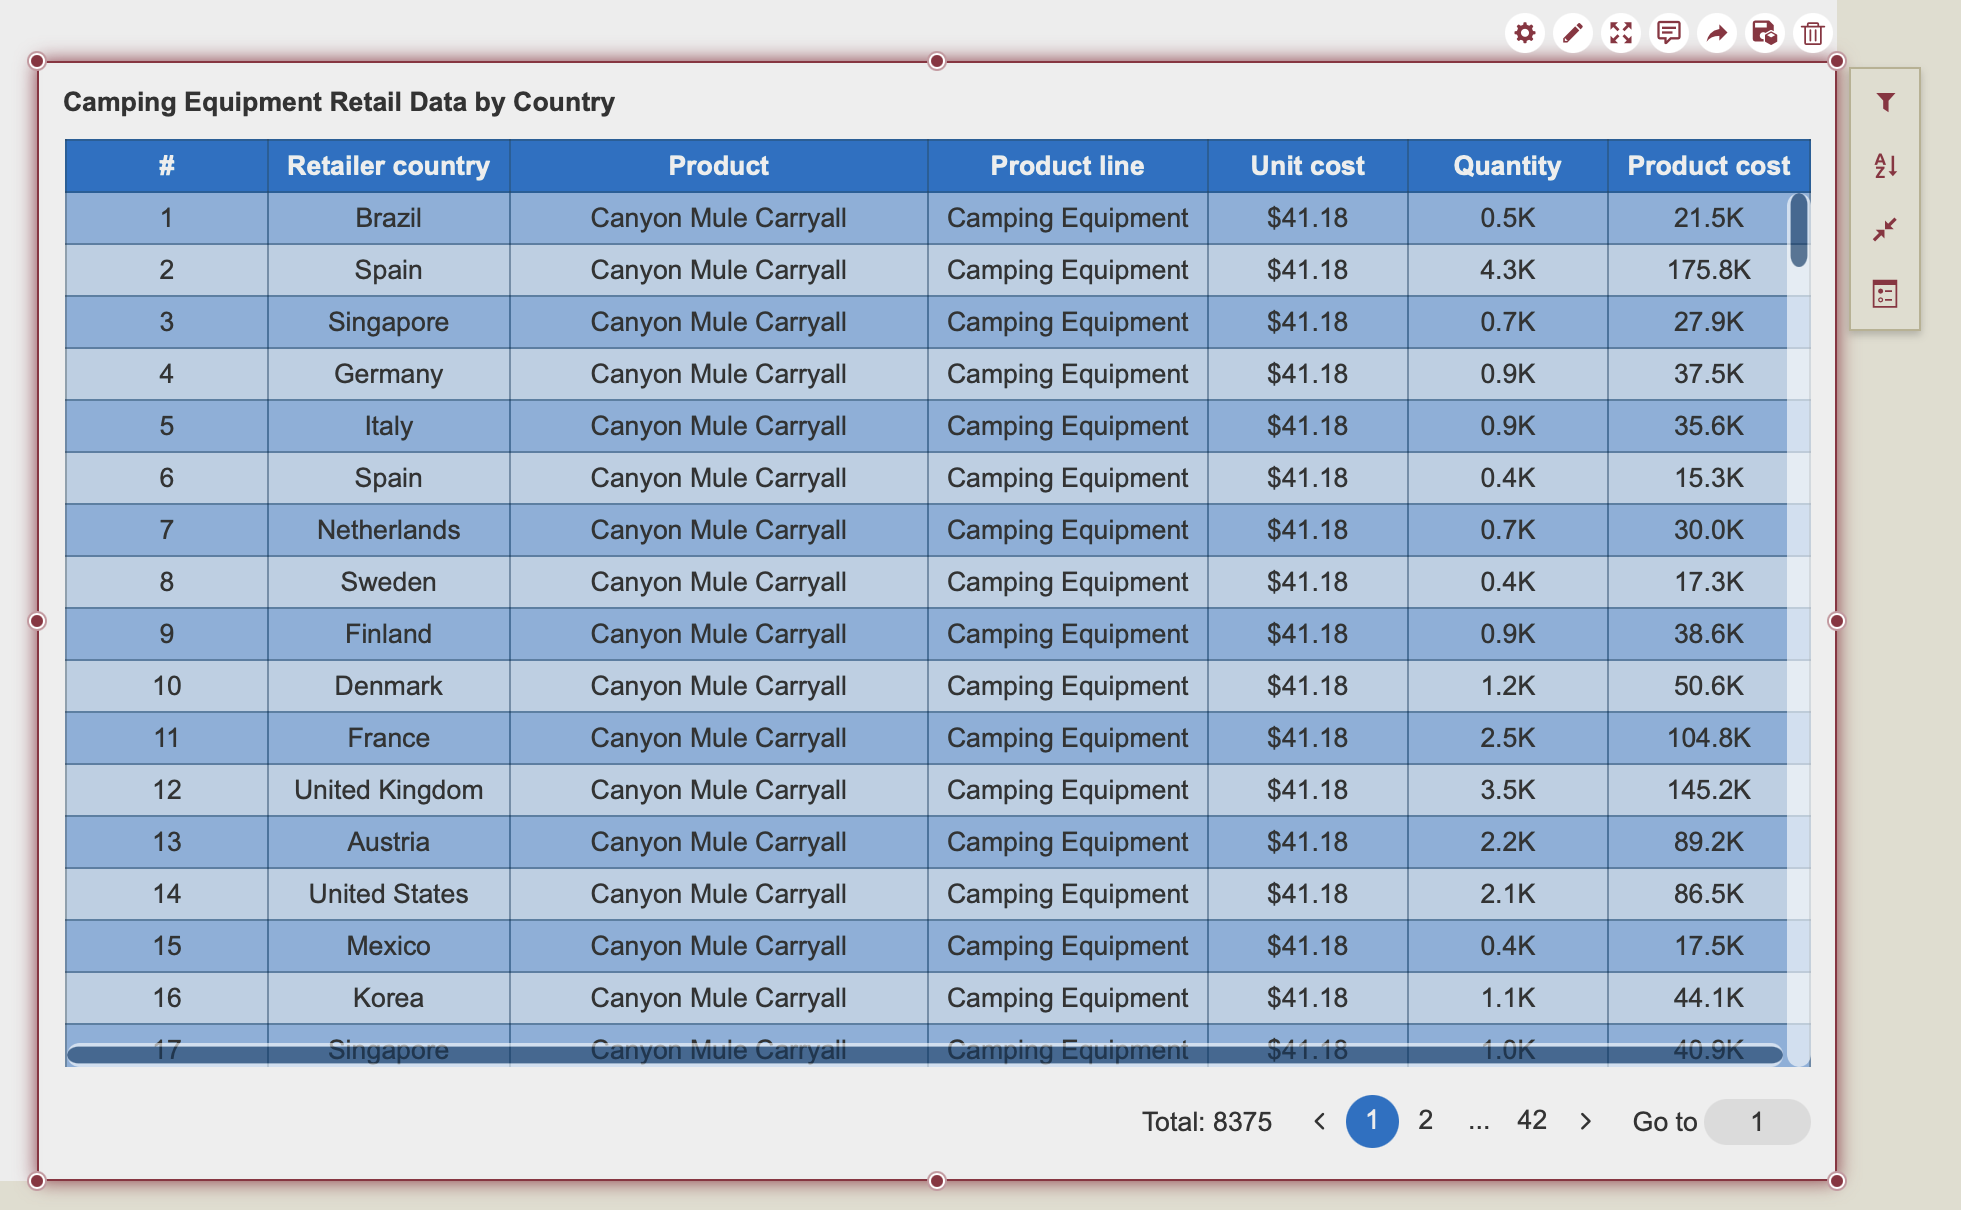
Drag your dashboard scenario to the lower right-hand corner to increase its size. You can also click on your dashboard to move it anywhere on the designer. Your dashboard should look something like the following.
You can further customize your data table to provide a more detailed representation of the data you wish to display. In the following, you will find these topics covered.
Add Filter
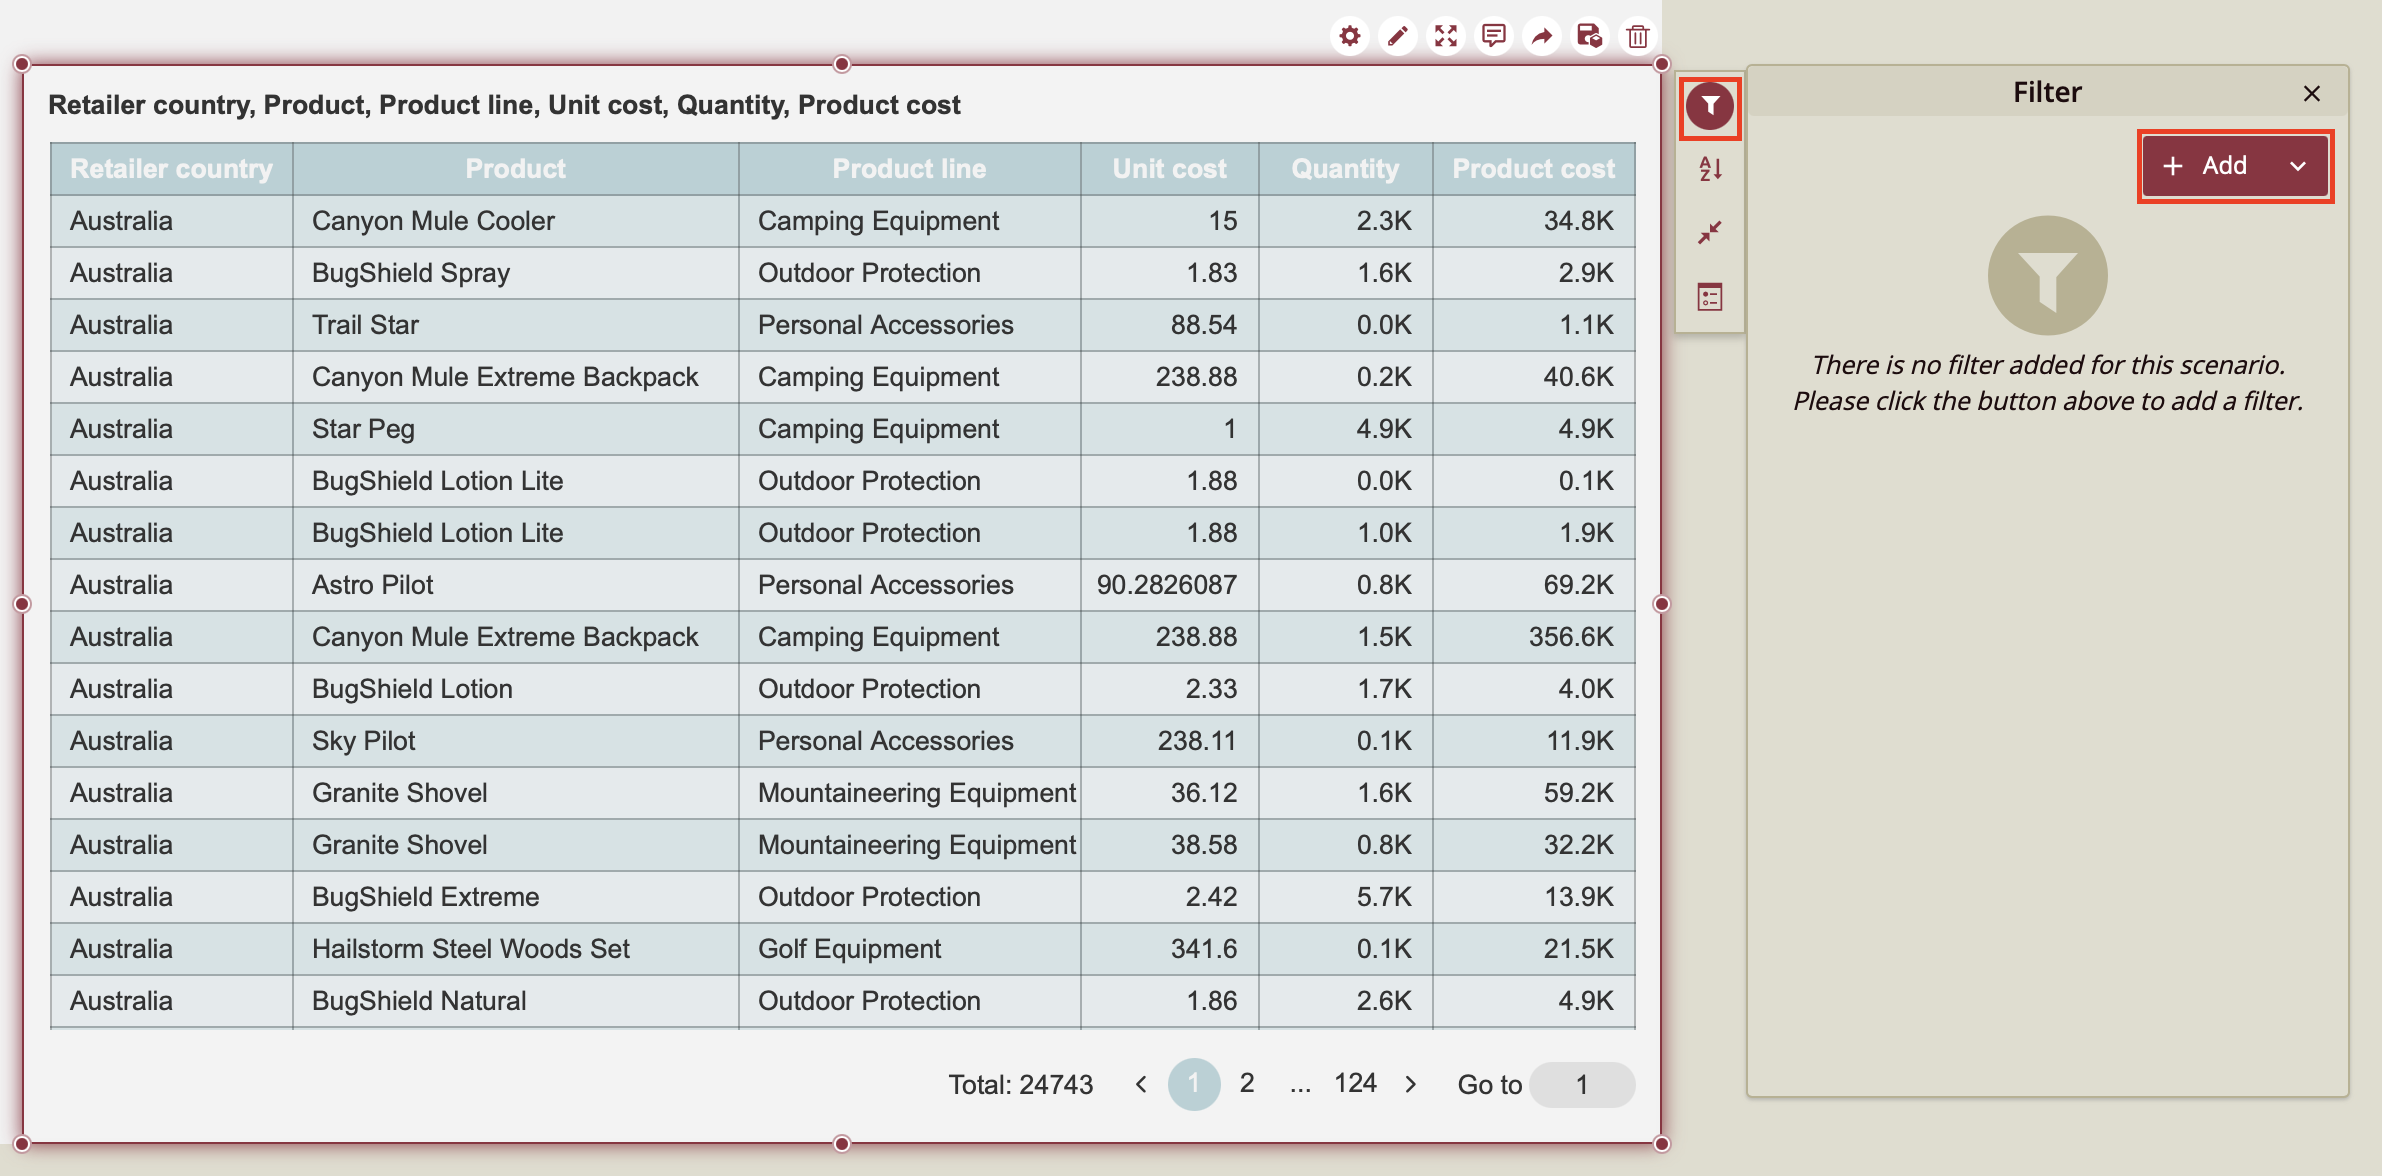
If you are interested in only displaying certain data, you can add a filter to your scenario. In this example, we are only interested in displaying the data for Camping Equipment.
To set a filter, click on the Data Table to select it. On the right-hand side of the Data Table, you will see the quick action icons. Click on the Funnel icon to open the filter menu and click + Add to add a filter.
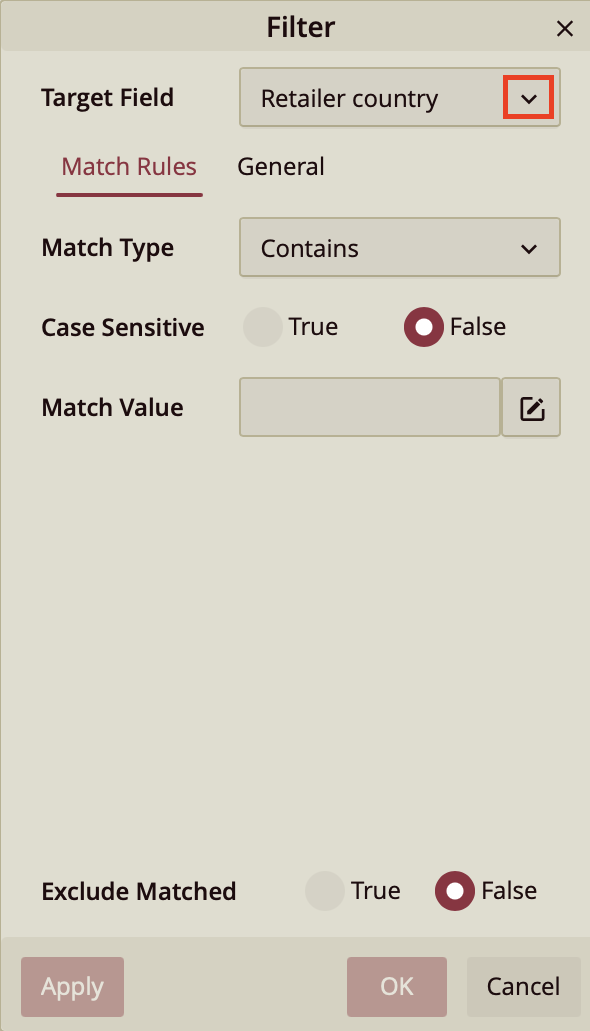
Click on the Target Field data binding slot to open the dropdown and find the data field for which you want to filter your table. In this case, we will filter by "Product Line", which is the data field that contains "Camping Equipment".
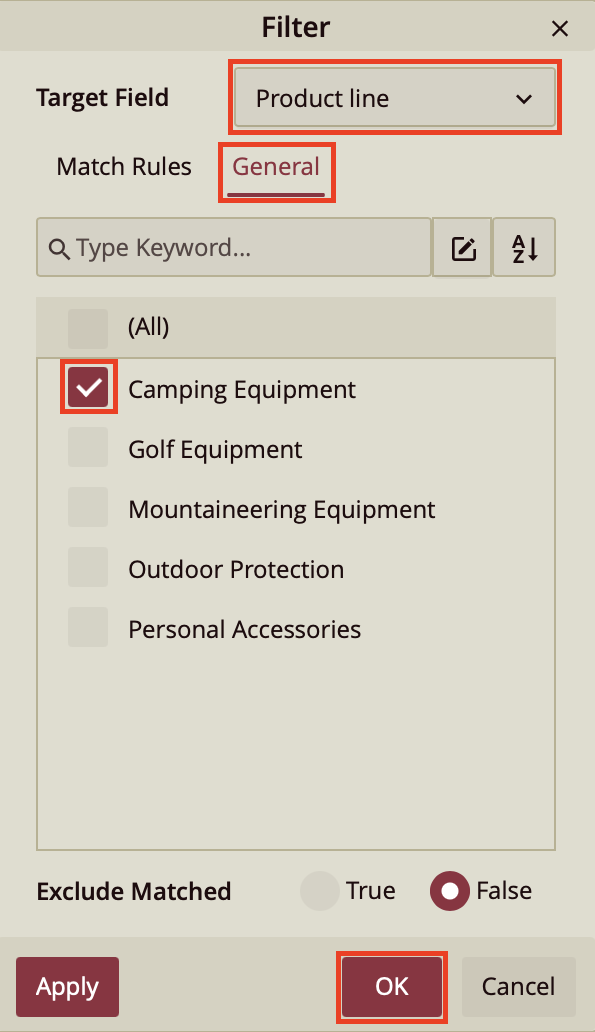
Once you have selected your data field, click on the General tab to specify the value corresponding to your data field, for which you want to filter your table. In this case, we have selected "Camping Equipment". Click Ok.
This is the result.
Add Sort
Though you have added a filter to your data table, you might find that other elements of your data table are unorganized. Such as in the example above. Although you have chosen to display "Camping Equipment", the individual products are scattered throughout your table.
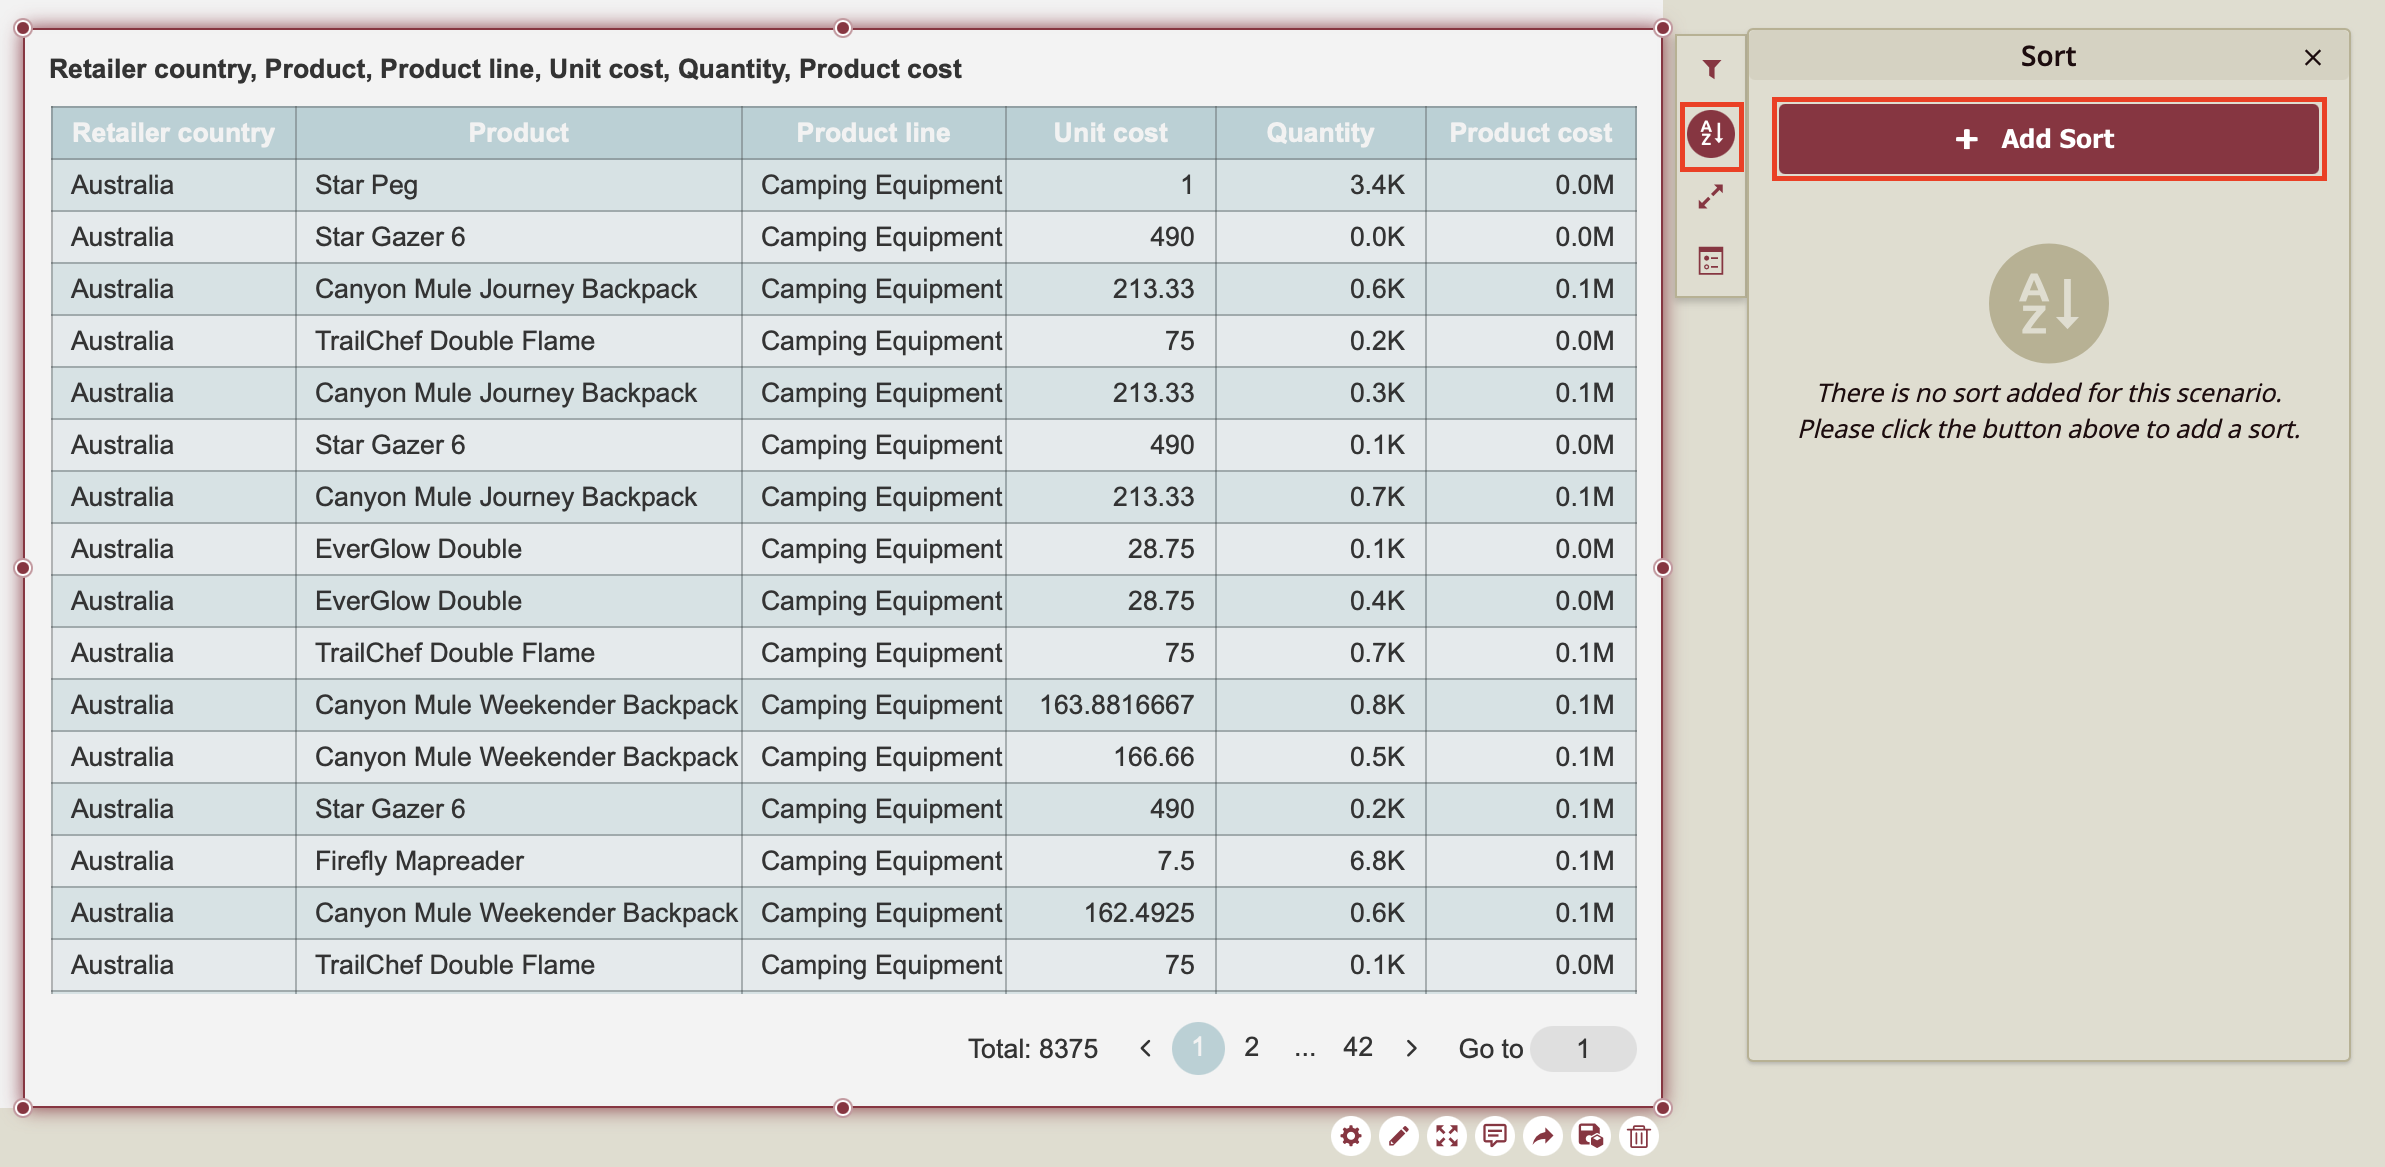
If you want to organize your table and have it sectioned by each "Camping Equipment" product, you can add a sort. To do so, you are going to select your data table, and on the right-hand side, you will see the quick action icons. Click on the AZ icon to open the sort menu. Click + Add Sort to add a sort to your table.
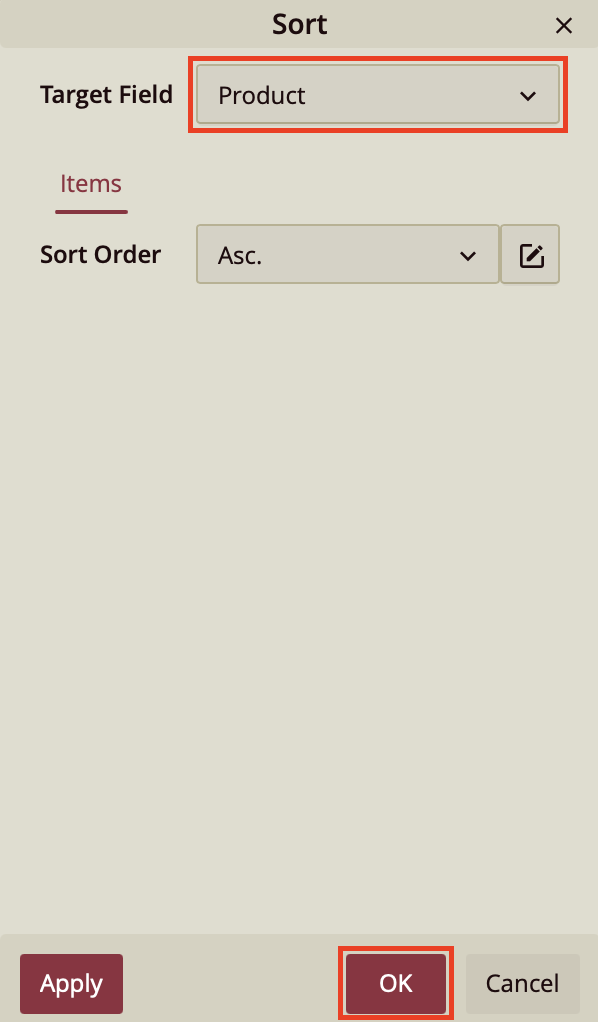
In the menu, pick the Target Field of your sort, the field by which you want to sort your table. In this case, we have chosen "Product". Click OK.
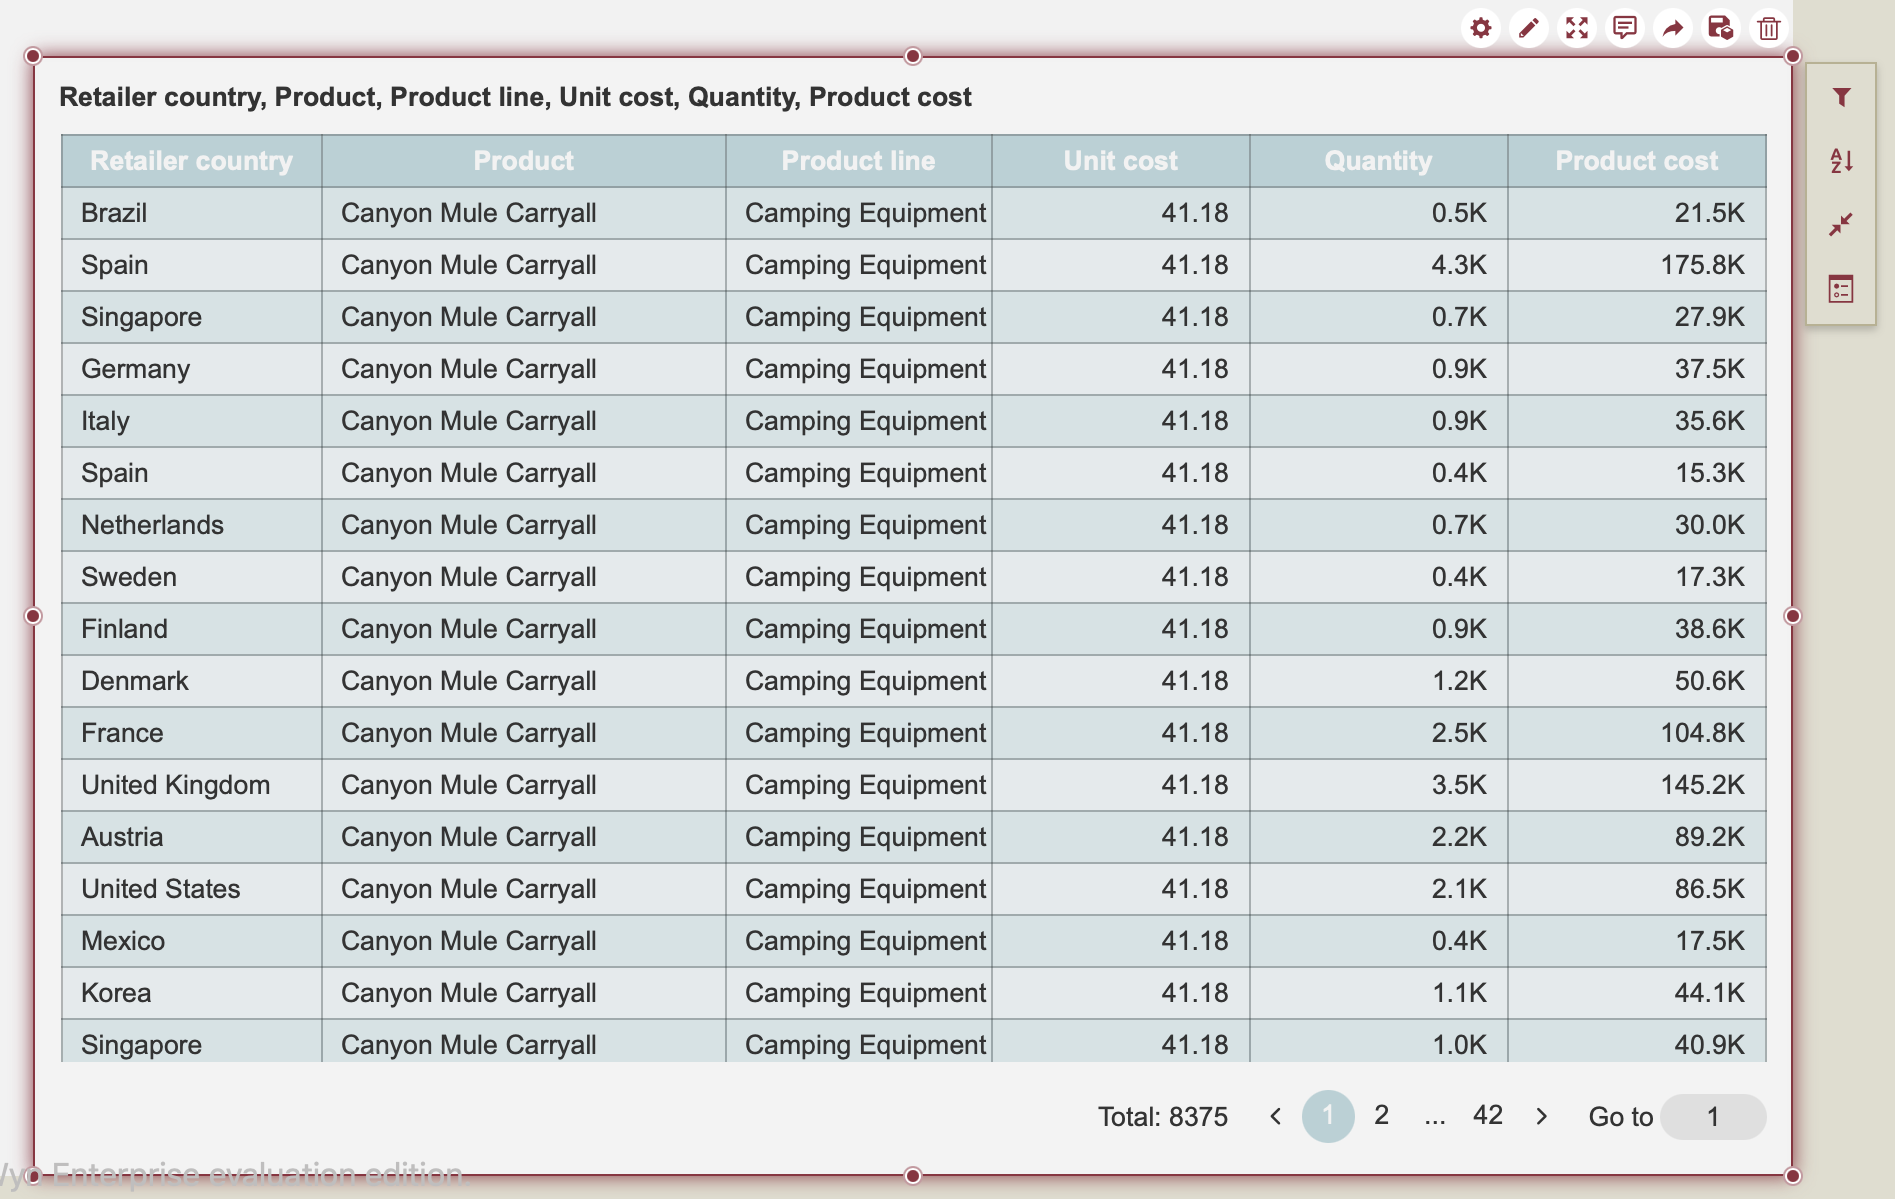
Now you have a table that is filtered only for "Camping Equipment", but the data of the table is sectioned by each product, i.e., is sorted by each product.
Format Data Attributes
In addition to selecting how you want your table to be displayed, by adding a filter and/or sort, you can modify the format of that data. Specifically, in this example, we show how to format "Unit Cost".
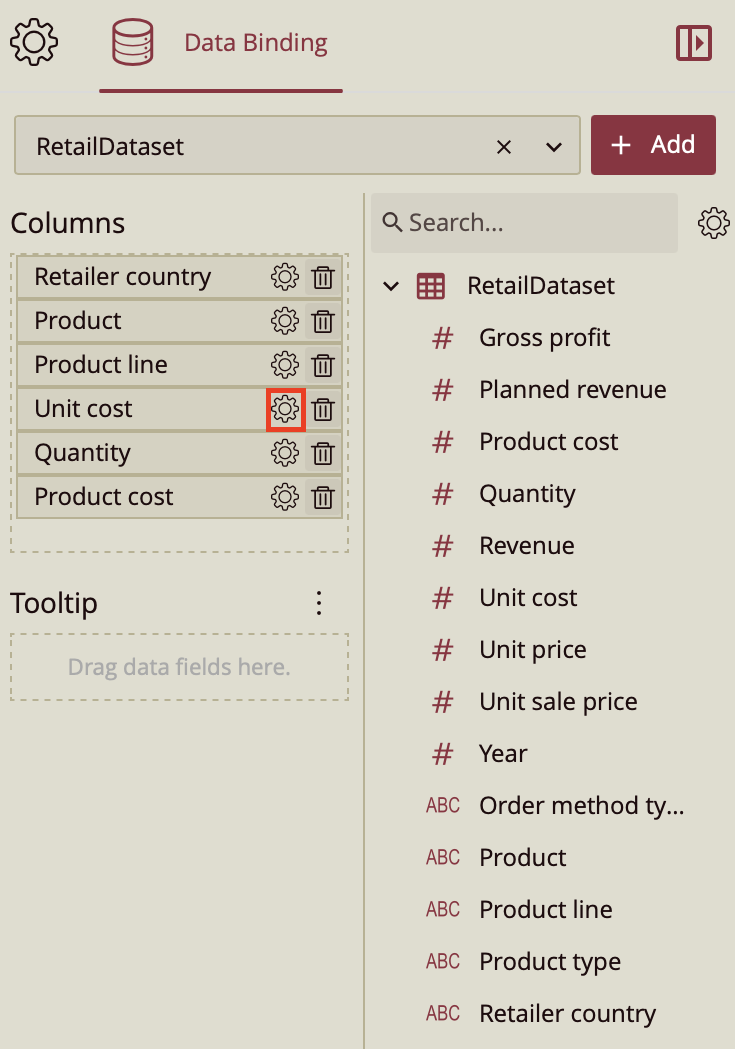
In the Data Binding tab, click on the gear icon of the data field you have added to the Columns binding slot. In this case, it's the "Unit Cost" data field. Click on the gear icon next to "Unit Cost".
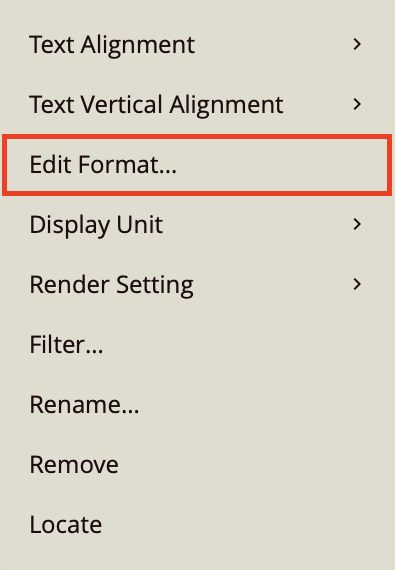
Click Edit Format from the dropdown.
Select the format to display the data. In this case, it's currency.
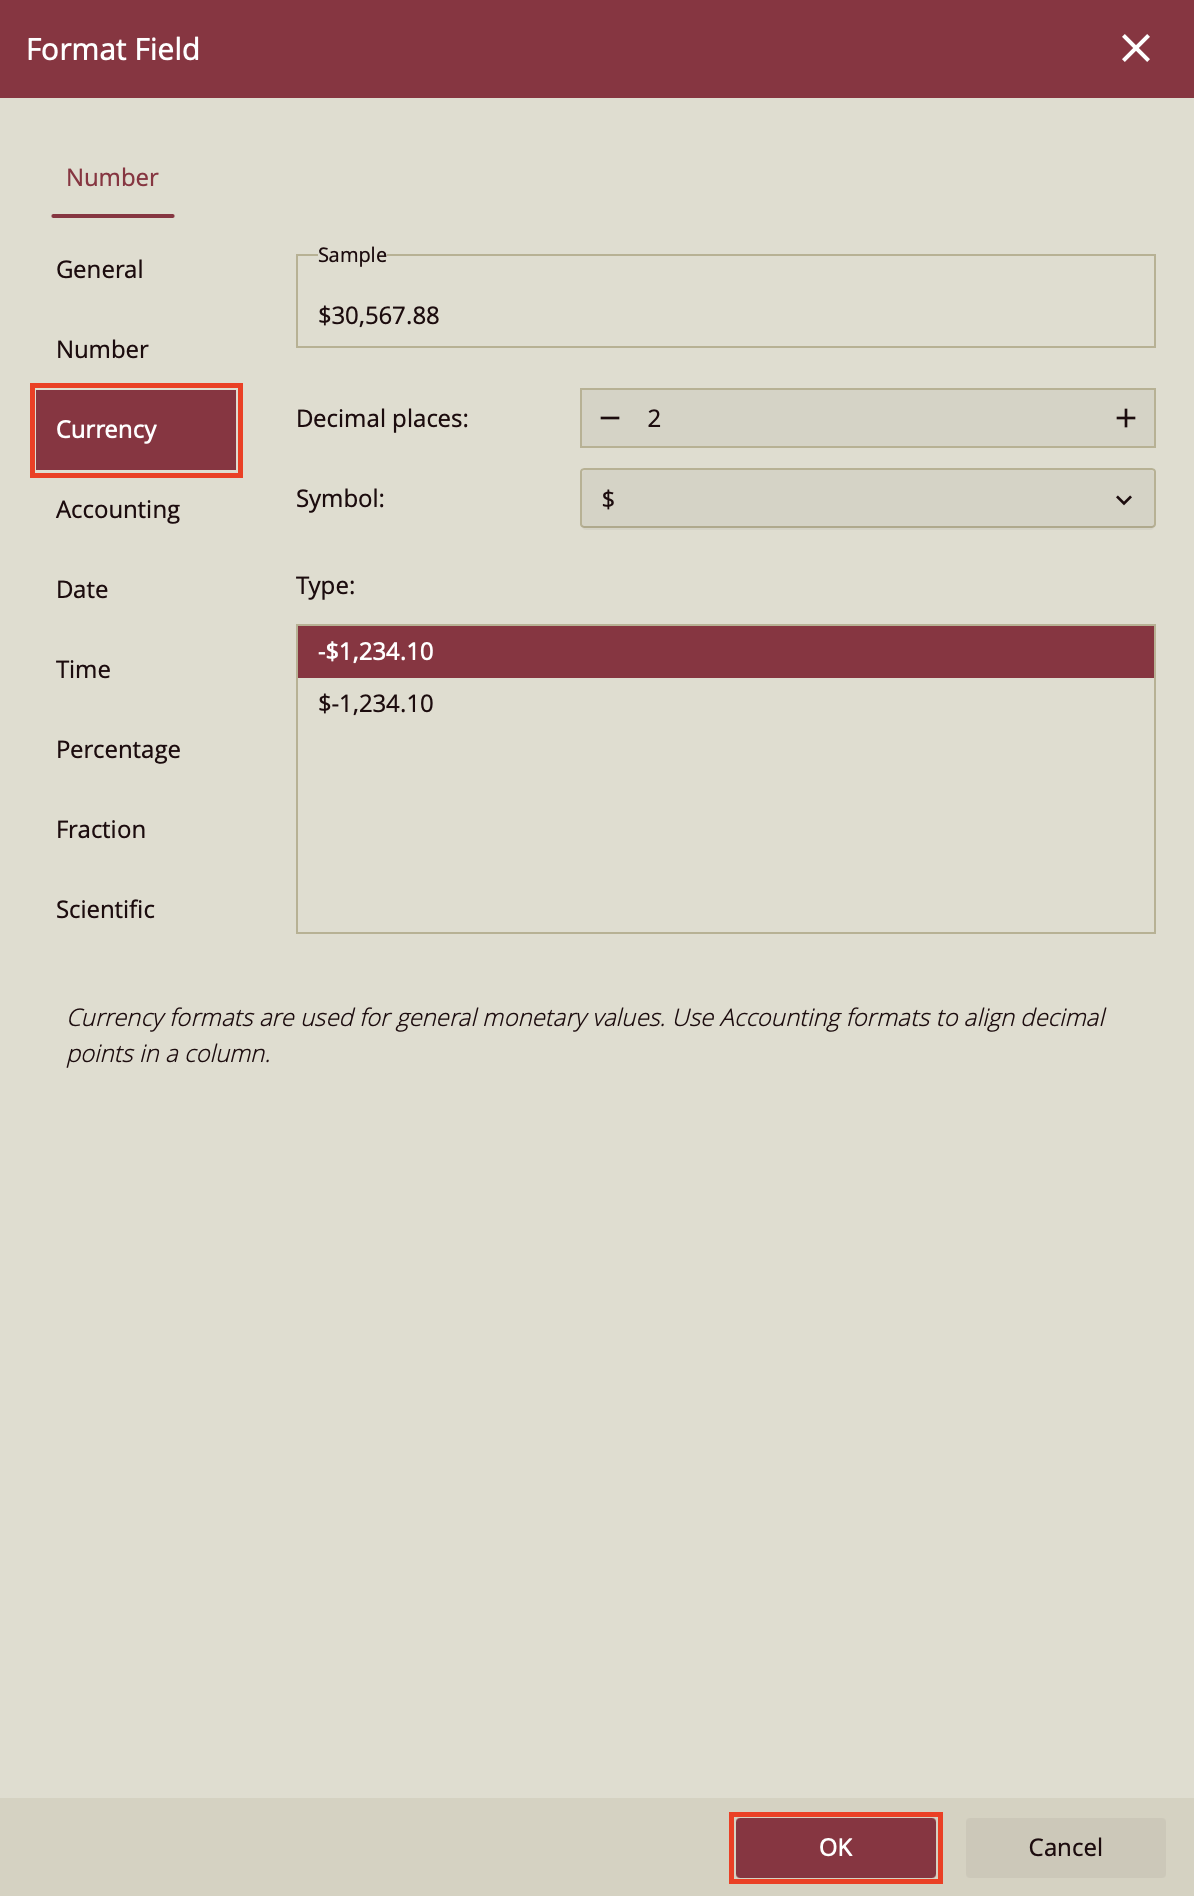
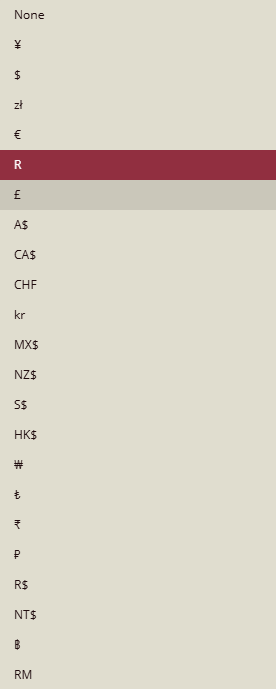
Select the preferred currency from the Symbol and click OK to save your selection. For additional information about currency, please refer to the table below.
Currency
Symbol | Country/Region | Currency Name |
|---|---|---|
¥ | Japan, China | Japanese Yen, Chinese Yuan |
$ | United States | US Dollar |
zł | Poland | Polish Zloty |
€ | Eurozone countries | Euro |
R | South Africa | South African Rand |
£ | United Kingdom | British Pound Sterling |
A$ | Australia | Australian Dollar |
CA$ | Canada | Canadian Dollar |
CHF | Switzerland | Swiss Franc |
kr | Sweden, Norway, Denmark, Iceland | Krona, Krone, Króna |
MX$ | Mexico | Mexican Peso |
NZ$ | New Zealand | New Zealand Dollar |
S$ | Singapore | Singapore Dollar |
HK$ | Hong Kong | Hong Kong Dollar |
₩ | South Korea | South Korean Won |
₺ | Turkey | Turkish Lira |
₹ | India | Indian Rupee |
₽ | Russia | Russian Ruble |
R$ | Brazil | Brazilian Real |
NT$ | Taiwan | New Taiwan Dollar |
฿ | Thailand | Thai Baht |
RM | Malaysia | Malaysian Ringgit |
Now you have a formatted "Unit Cost" column.
Name Your Data Table
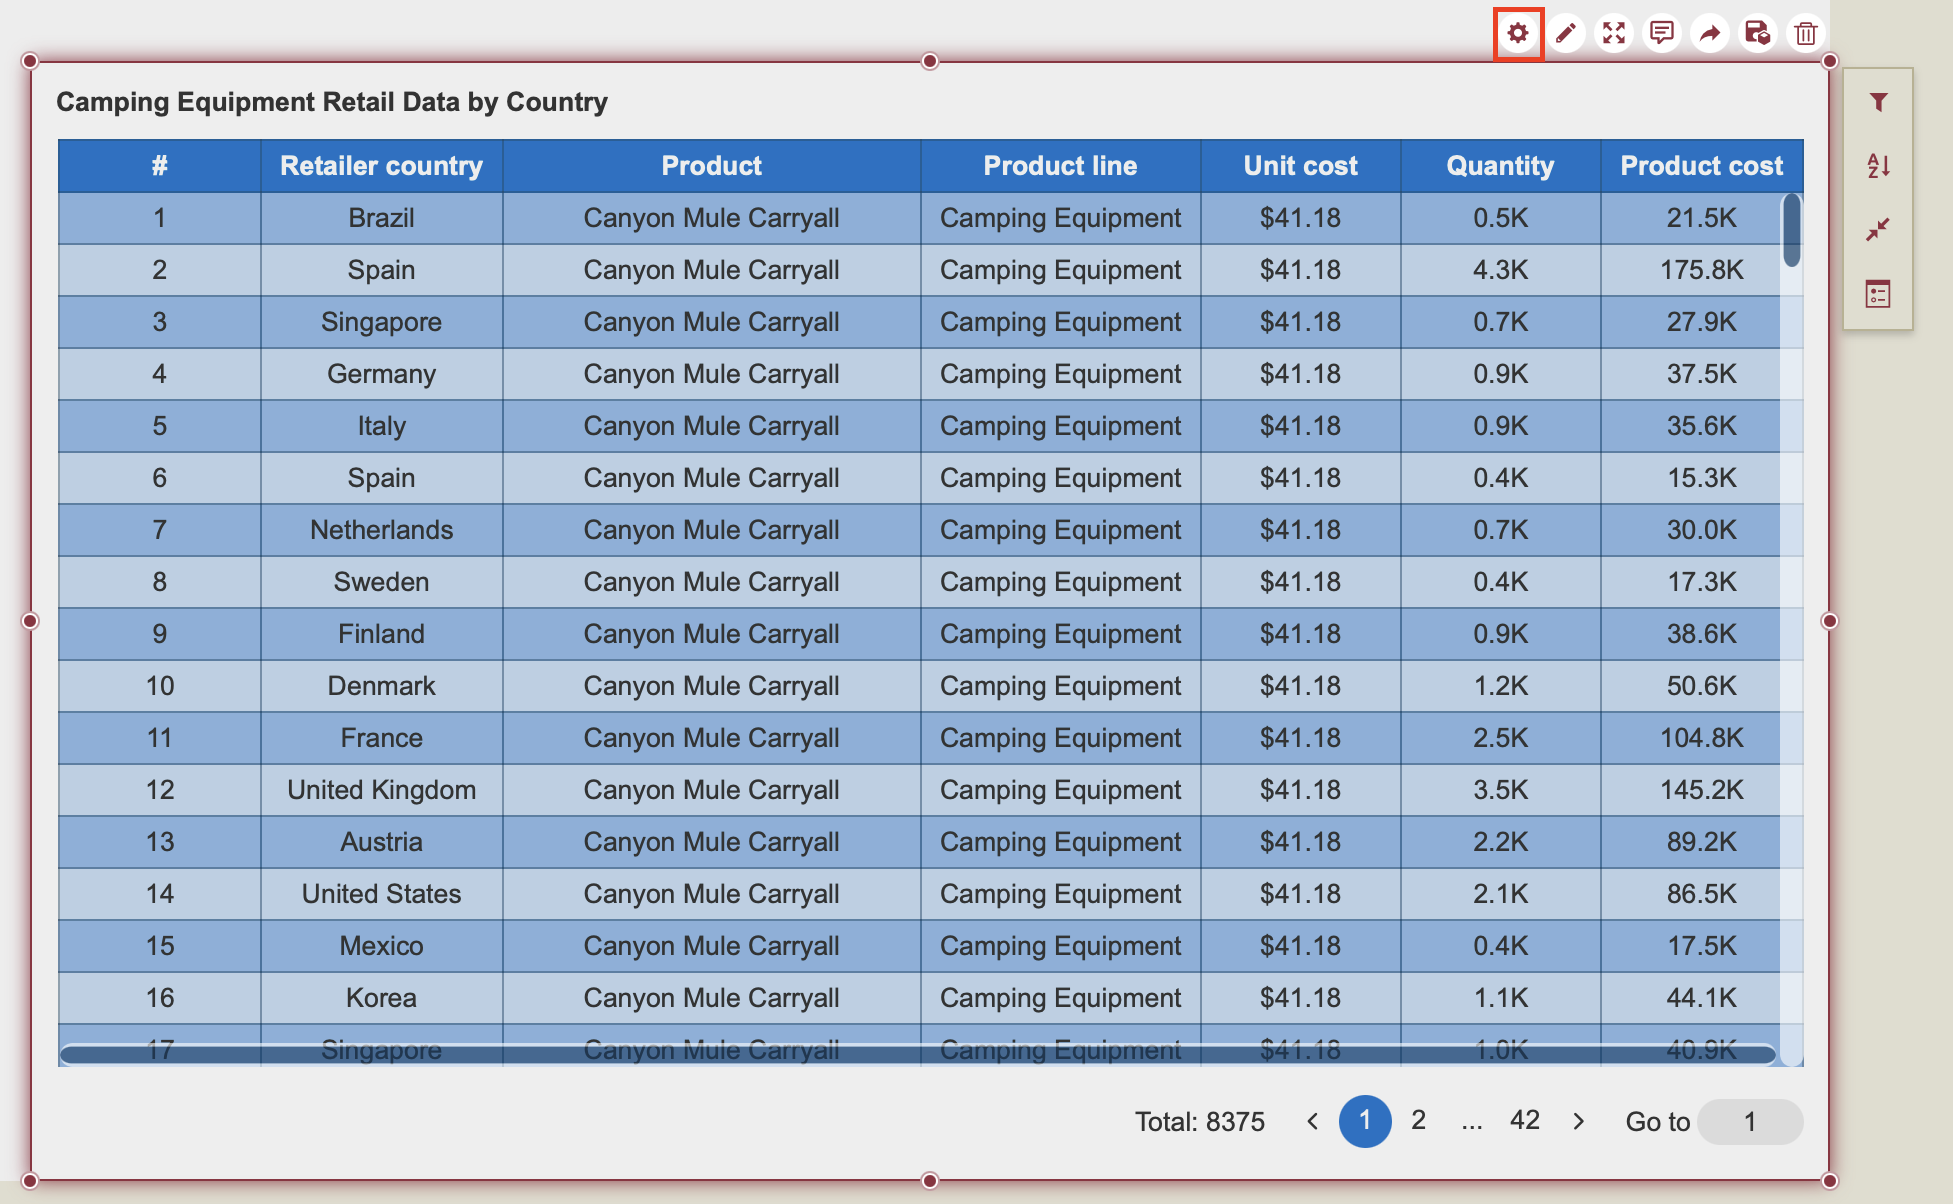
Besides modifying the data displayed on your table, you can also modify the appearance of your table in the Inspector tab. Click on the gear icon next to the Data Binding tab to open the Inspector tab.
Scroll down to Title properties. The Show Title property is automatically set to True. If you would like not to have a name displayed, you can always set the toggle item to False. To add a title, type it in the Title slot. In this case, we have decided to name the data table "Camping Equipment Products by Country".
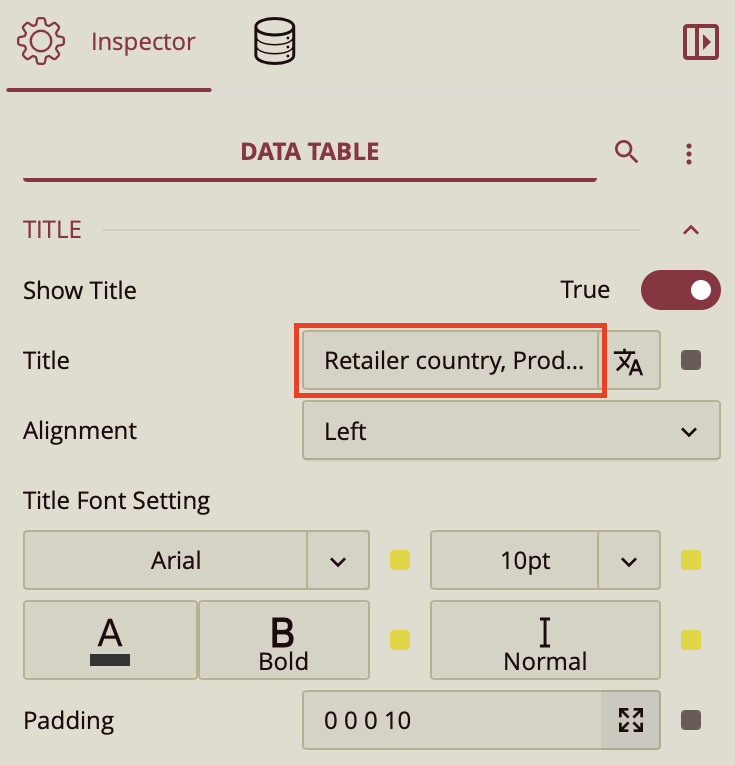
You can further customize your Data Table title, whether that be by changing the Alignment, Font, or adding Padding.
Modify Data Stripes
Your data table takes the color of the default theme of your designer. You can change the color of your data stripes by either changing the Theme or by manually changing the color of the table stripes.
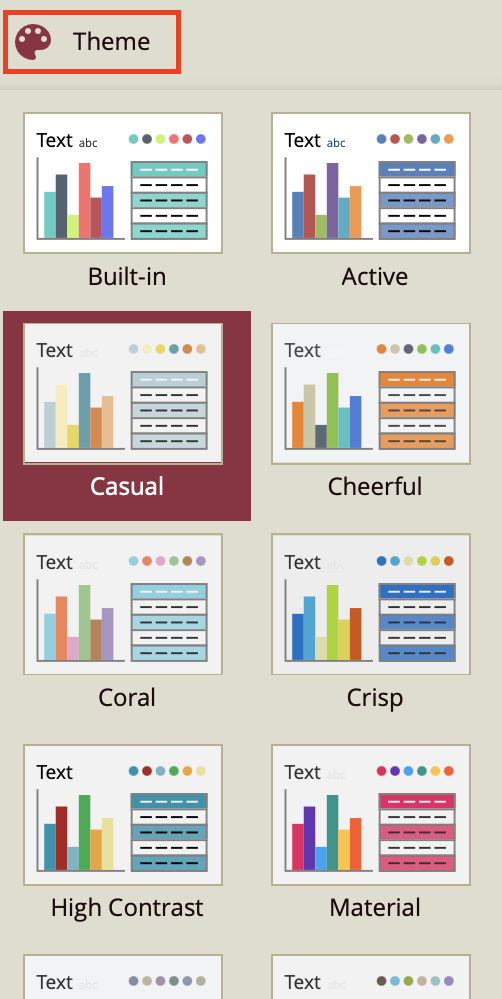
To change the Theme color. Simply click on Dashboard on the top ribbon.

Click Theme. There, you can choose a new theme for your data table. For this scenario, we have chosen the Crisp Theme.
Note: This will change the color of all prior and/or subsequent scenarios added to the designer.
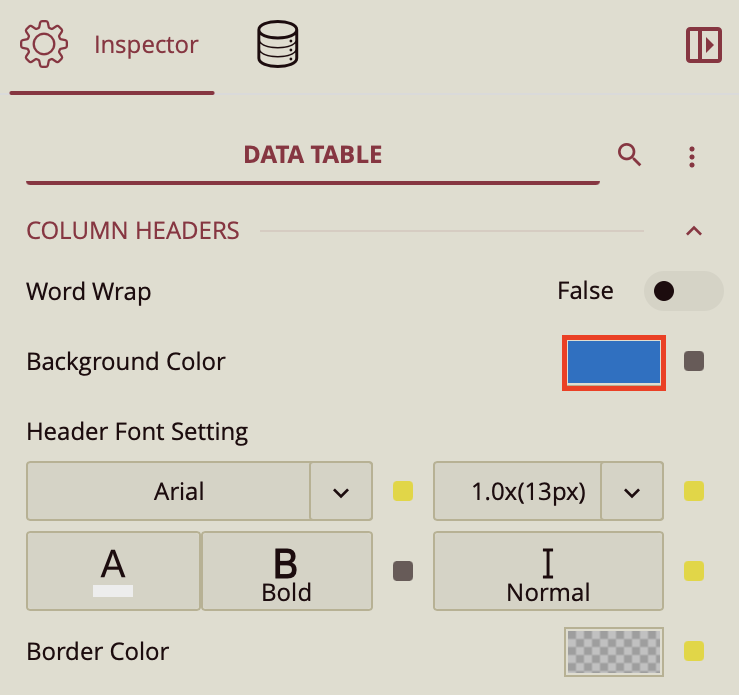
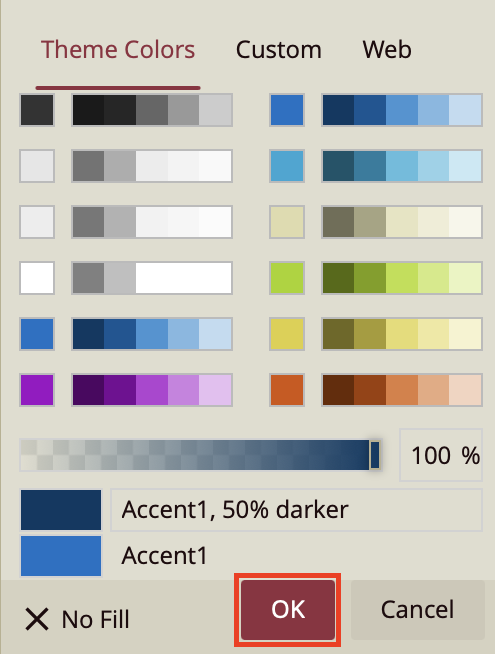
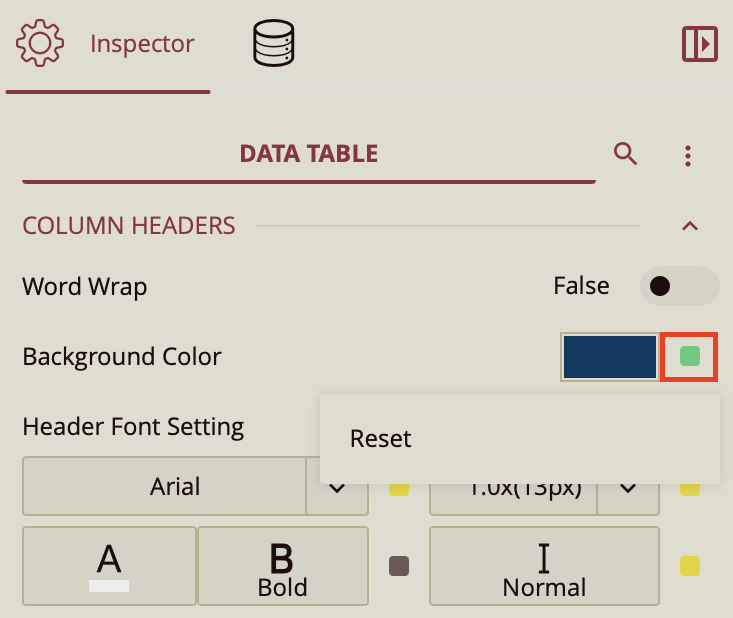
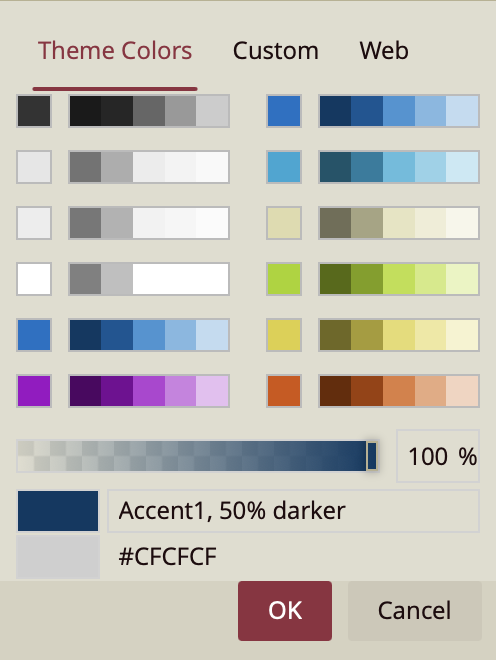
To change the color of the individual data table elements, scroll down to the Column Headers properties in the inspector tab. Here you can change the color of the header using the Background Color property. Click on the color binding slot to open the color palette. Choose the color you wish to use and click OK.
Note: The colors available to you are part of the Theme you have chosen. Or you can pick a custom color to add to your visualization or one from the web.
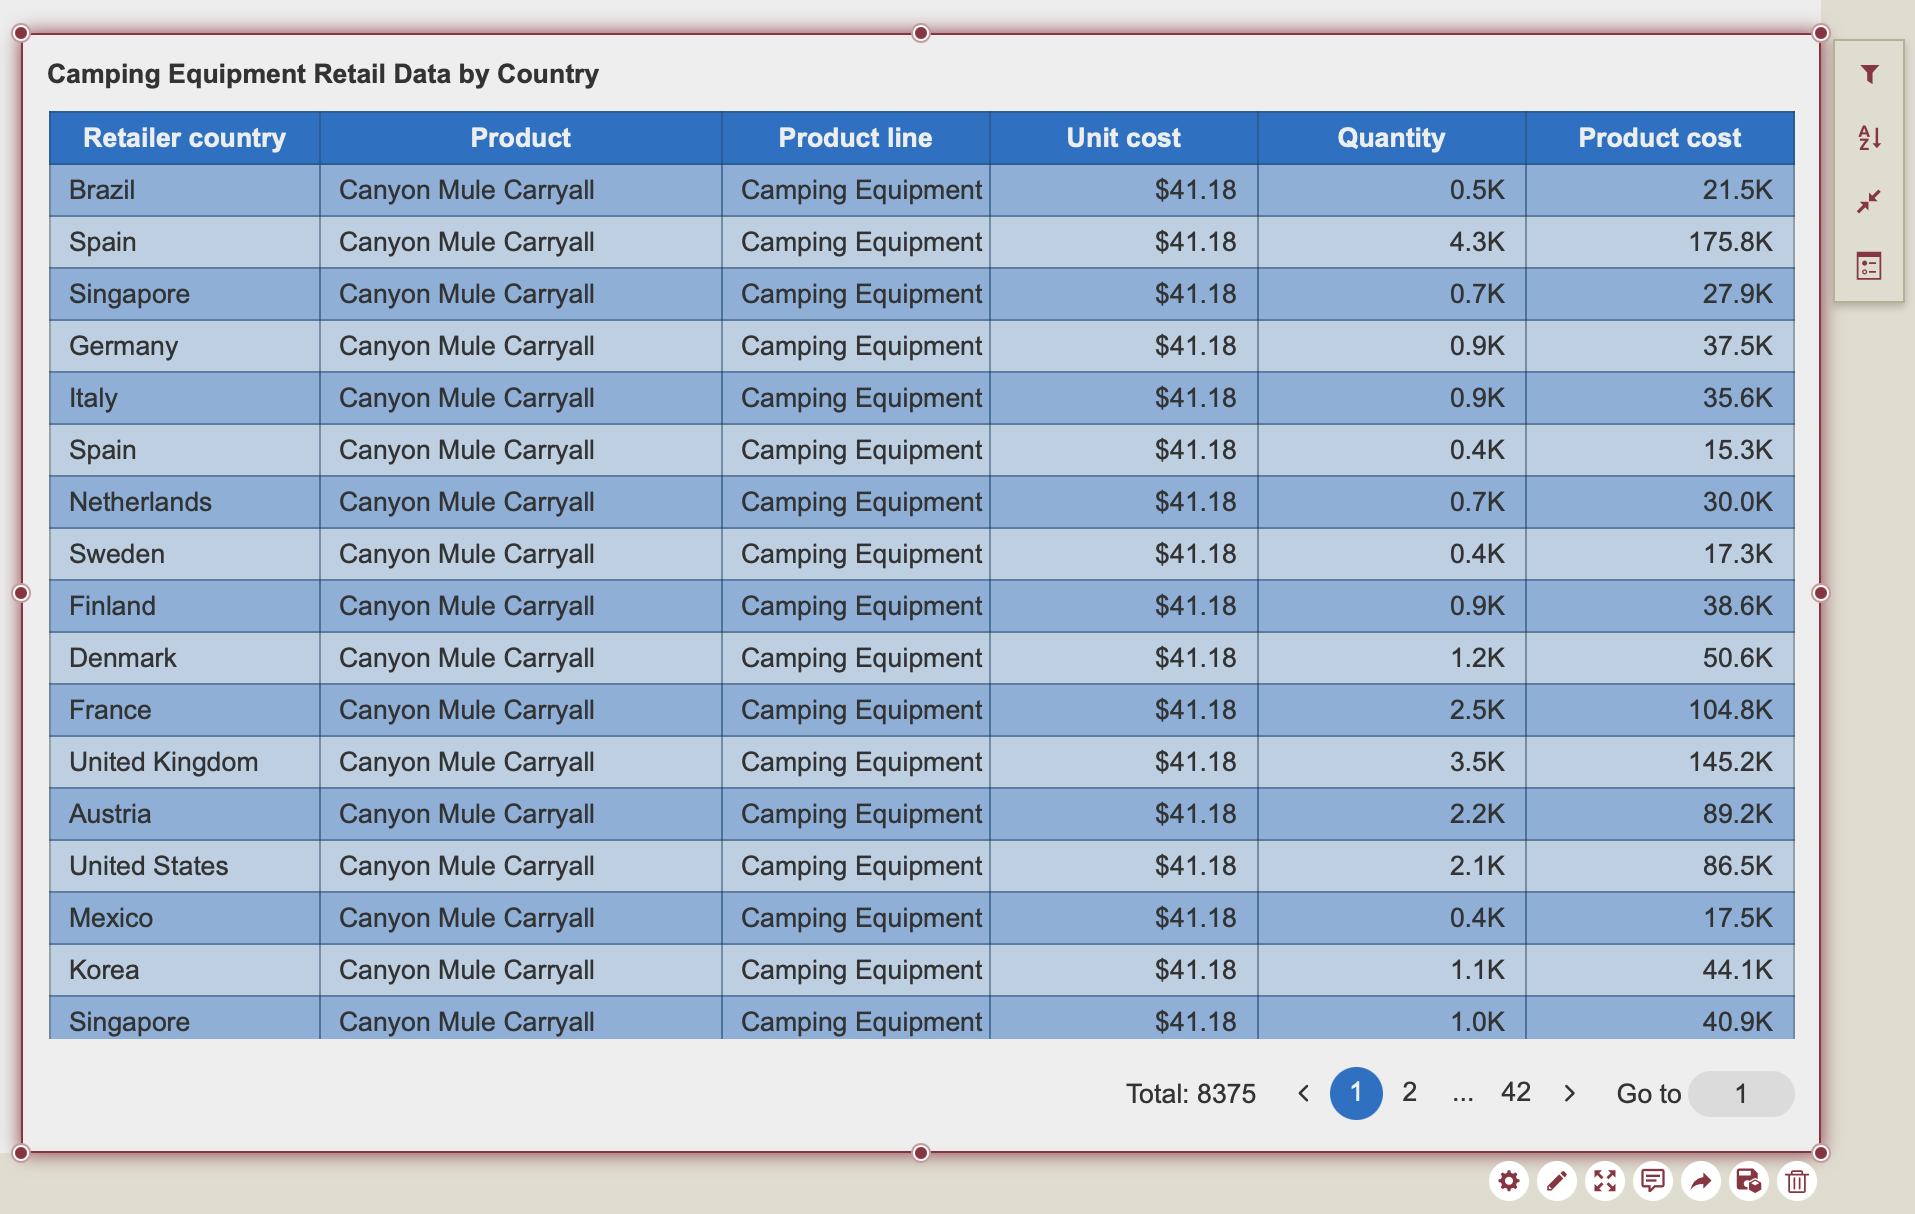
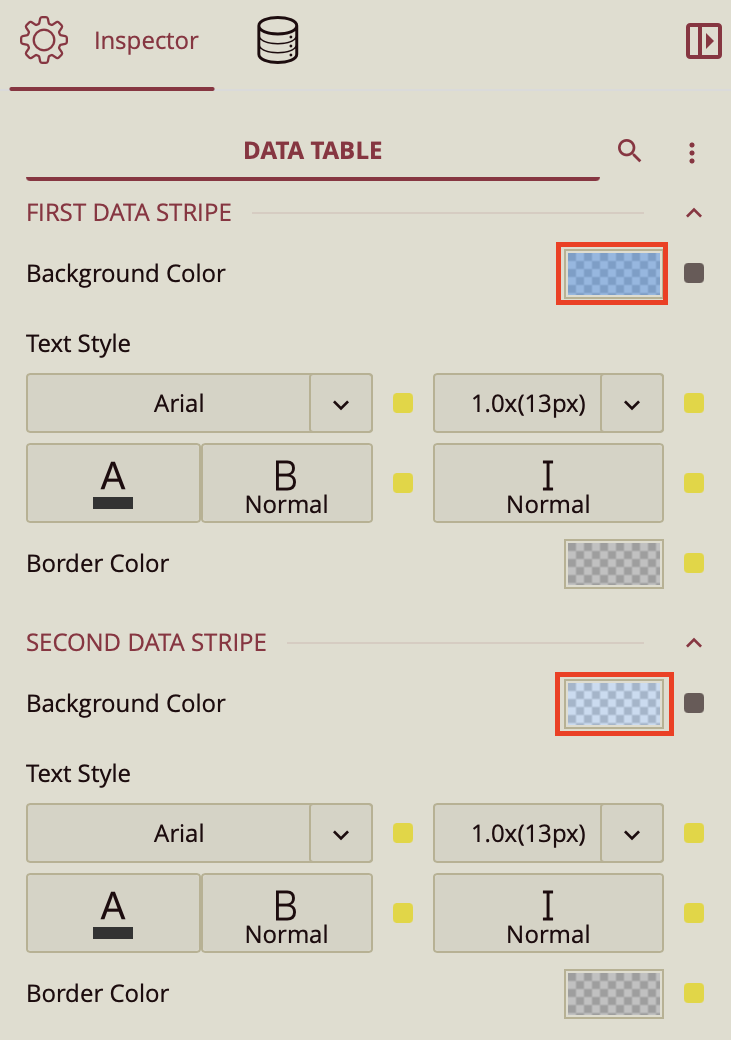
To change the color of the table stripes, you can change them using the First Data Stripe and the Second Data Stripe properties. Simply click on the Background Color to choose the color you wish to add to your stripe.
This is an example of a table with navy blue headers, a white first stripe, and a gray first stripe.
If you want to reset the colors of any of your table components, click on the adorner next to the Background Color property and click Reset.
Adjust Text Alignment
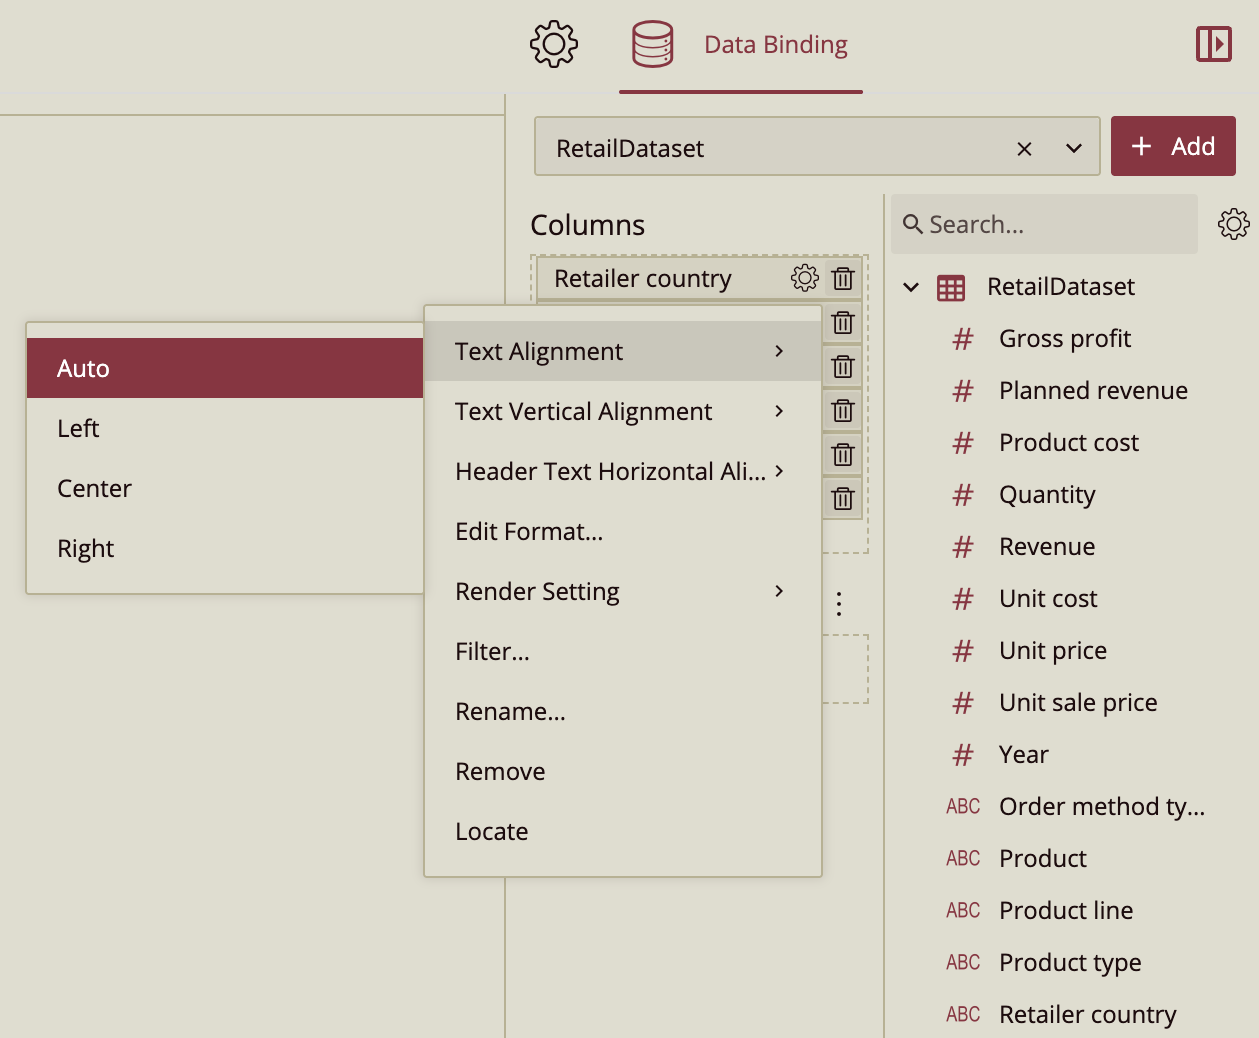
You can further customize your table in the Table Setting properties, located at the top of the Data Binding Tab. To change the text alignment in your data table, you can click on the gear icon next to the data attribute displayed on your table. You can then change the Text Alignment, the Text Vertical Alignment, and the Header Text Horizontal Alignment.
Customize Scrollbar
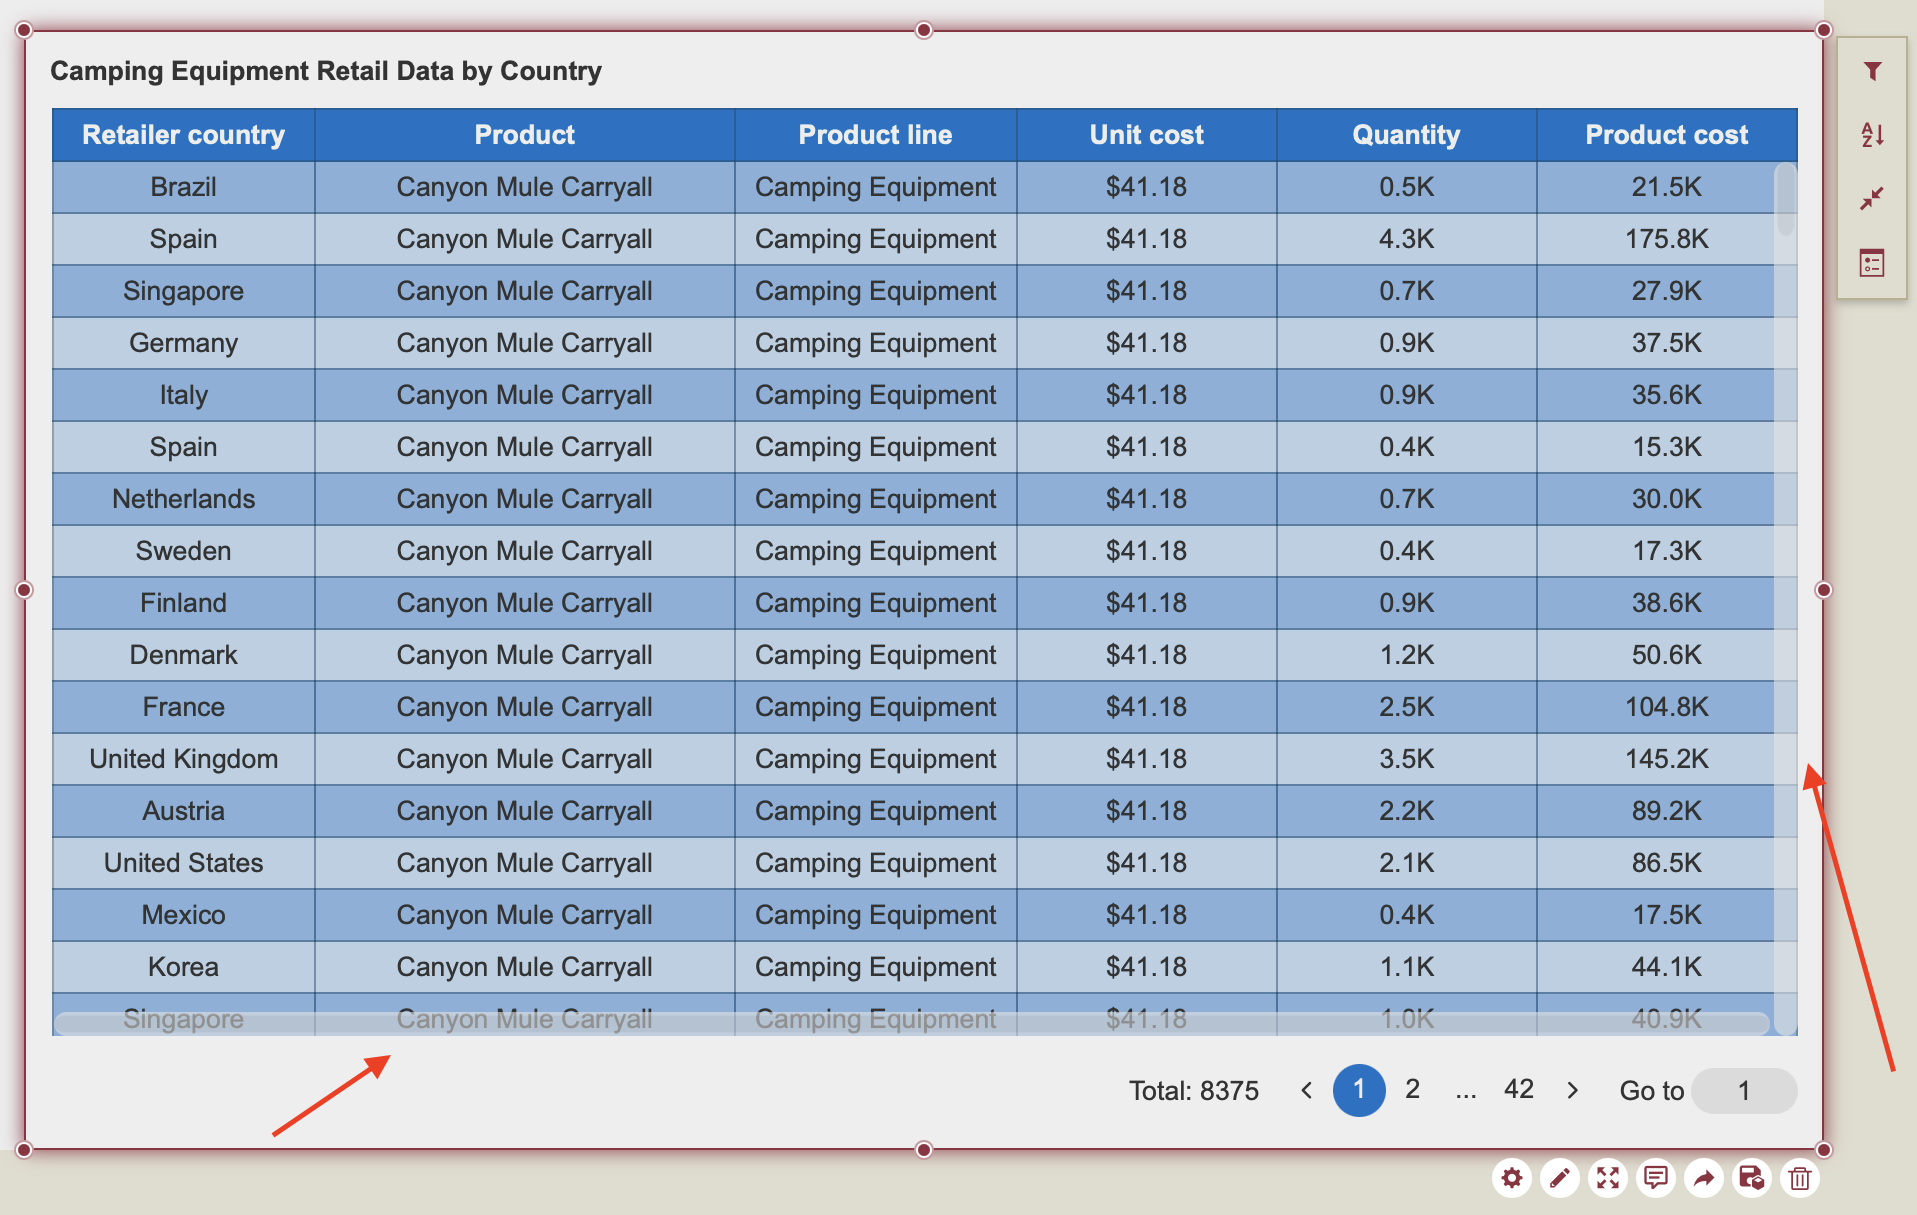
When you are displaying large amounts of data in your data table, you have the option of choosing whether you want your data table to be paginated or if you want to scroll through your data.
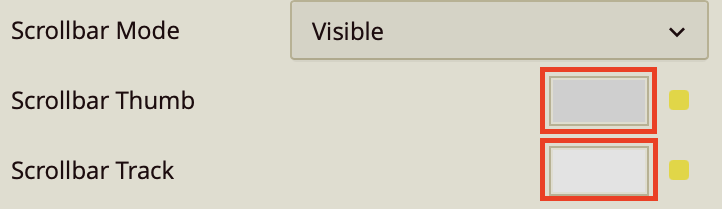
To scroll through your data, you want to find the Scrollbar Mode under the Table Setting properties. Click on the dropdown and choose whether you would like the scrollbar to be hidden (no scrollbar), whether you would want it to be visible, or whether you would want to hover over the data table to display (in the preview). In this case, we have chosen Visible.
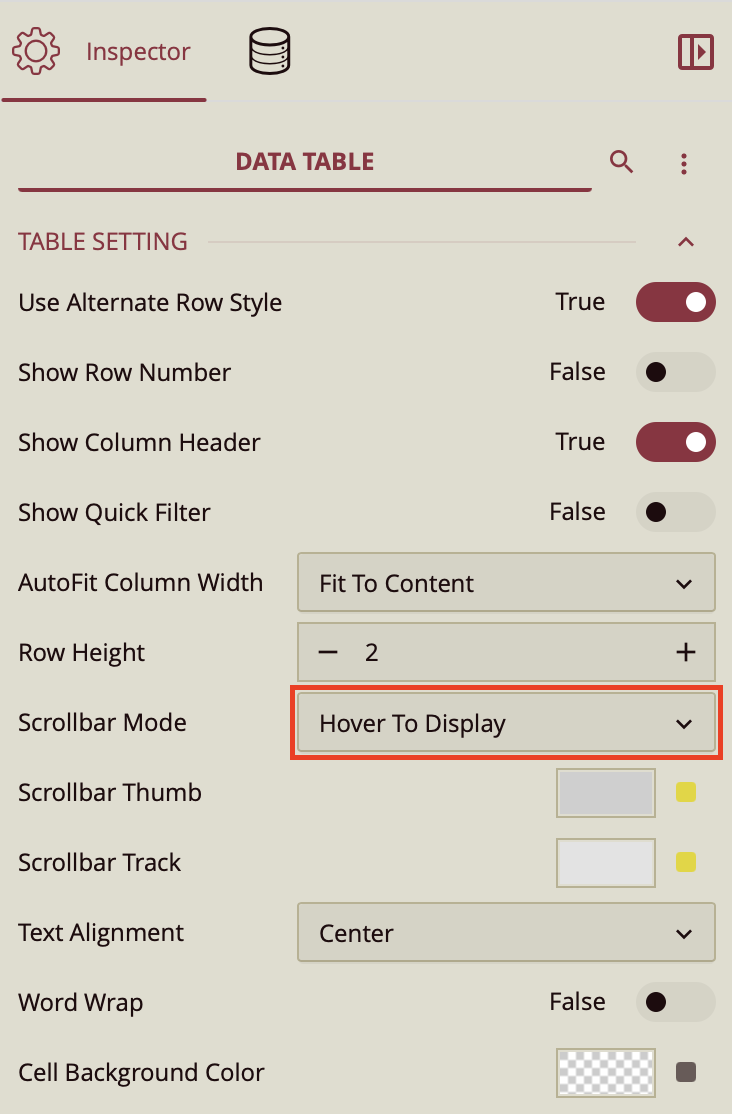
You can also customize the color of the Scrollbar Thumb and the Scrollbar Track. Just click on the color binding slot to open the color palette. From there, choose a color and click OK.
This is an example of a dark blue scrollbar thumb and a white scrollbar track.

Enable Automatic Scroll or Page Turning
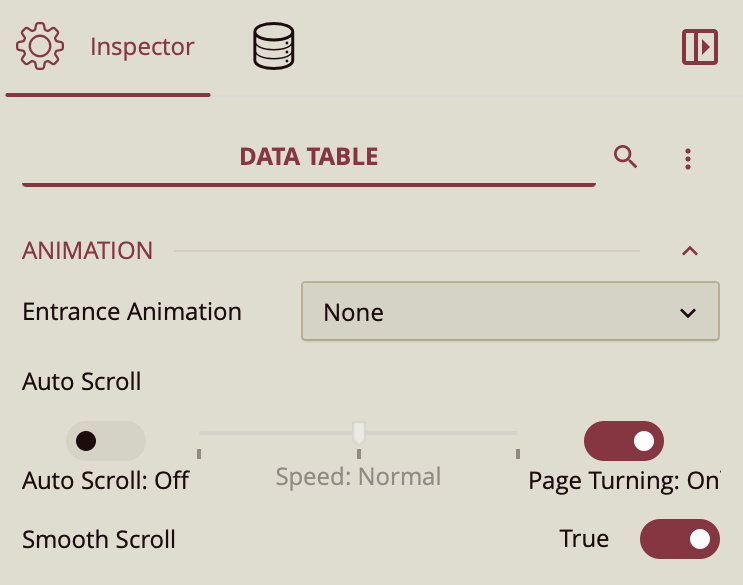
In addition to scrolling through your data, you can also enable automatic scroll, where your data table is automatically scrolled through in the dashboard preview. This can be enabled in the Animation properties in the Inspector tab. Set the toggle item above Autoscroll to On. In addition to this, you can set the Speed of the autoscroll.
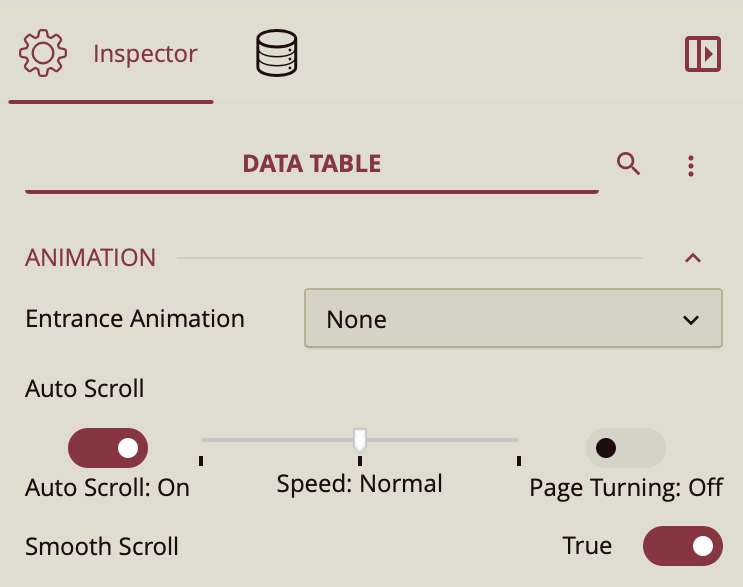
Alternatively, you can opt to have your data table be paginated, as it is by default, without enabling the scrollbar or auto scroll. In this case, you can set page turning to "On".
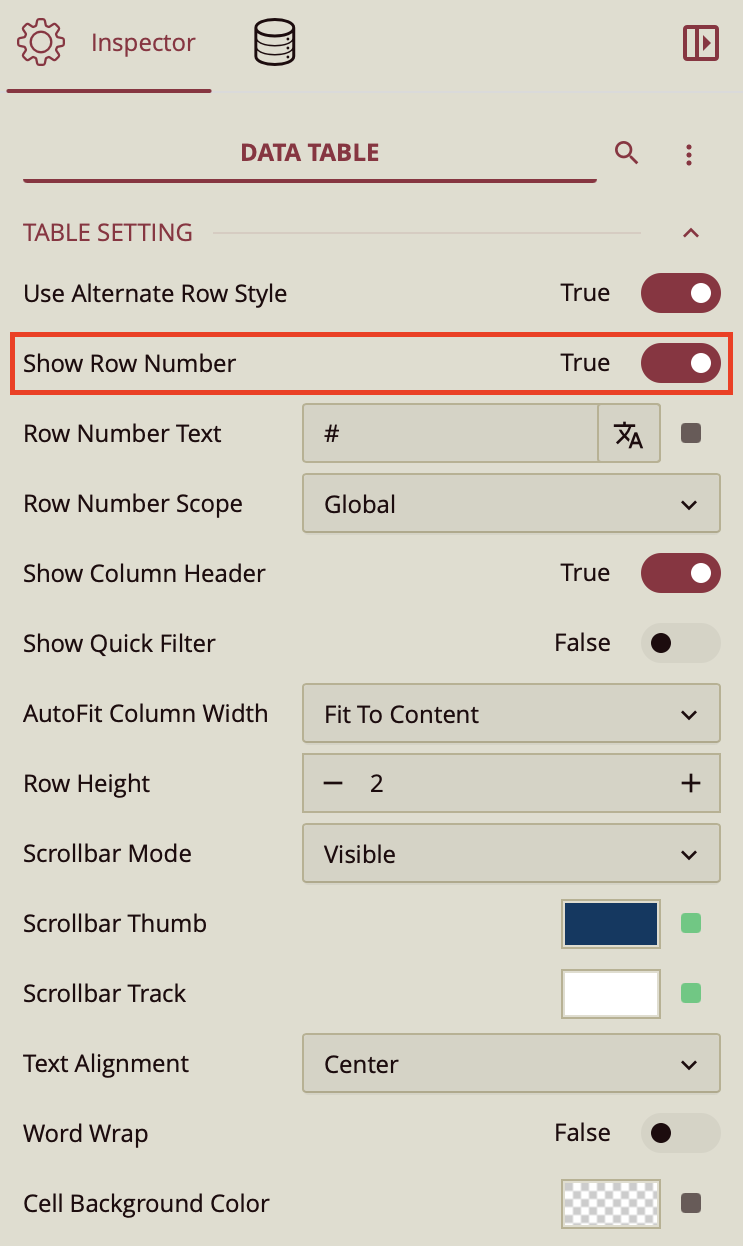
Show Row Number
Another feature of the data table is that you can number your data table rows. To do so, go to the Table Settings in the Inspector tab and set the Show Row Number setting to True. You can also change the number column title from "#" to something else. And set the scope of the row number to either "Global" or limit it to the "Page".
Edit Column Headers
The dashboard's data table also allows you to change the names of your data table headers. To do that, select your data table, and as you do, you will notice the action icons on the top of the data table. Click on the gear icon to open the Table Column Header Designer.
You can delete and rename your data table headers. Double-click on the data table header to replace the data header name.
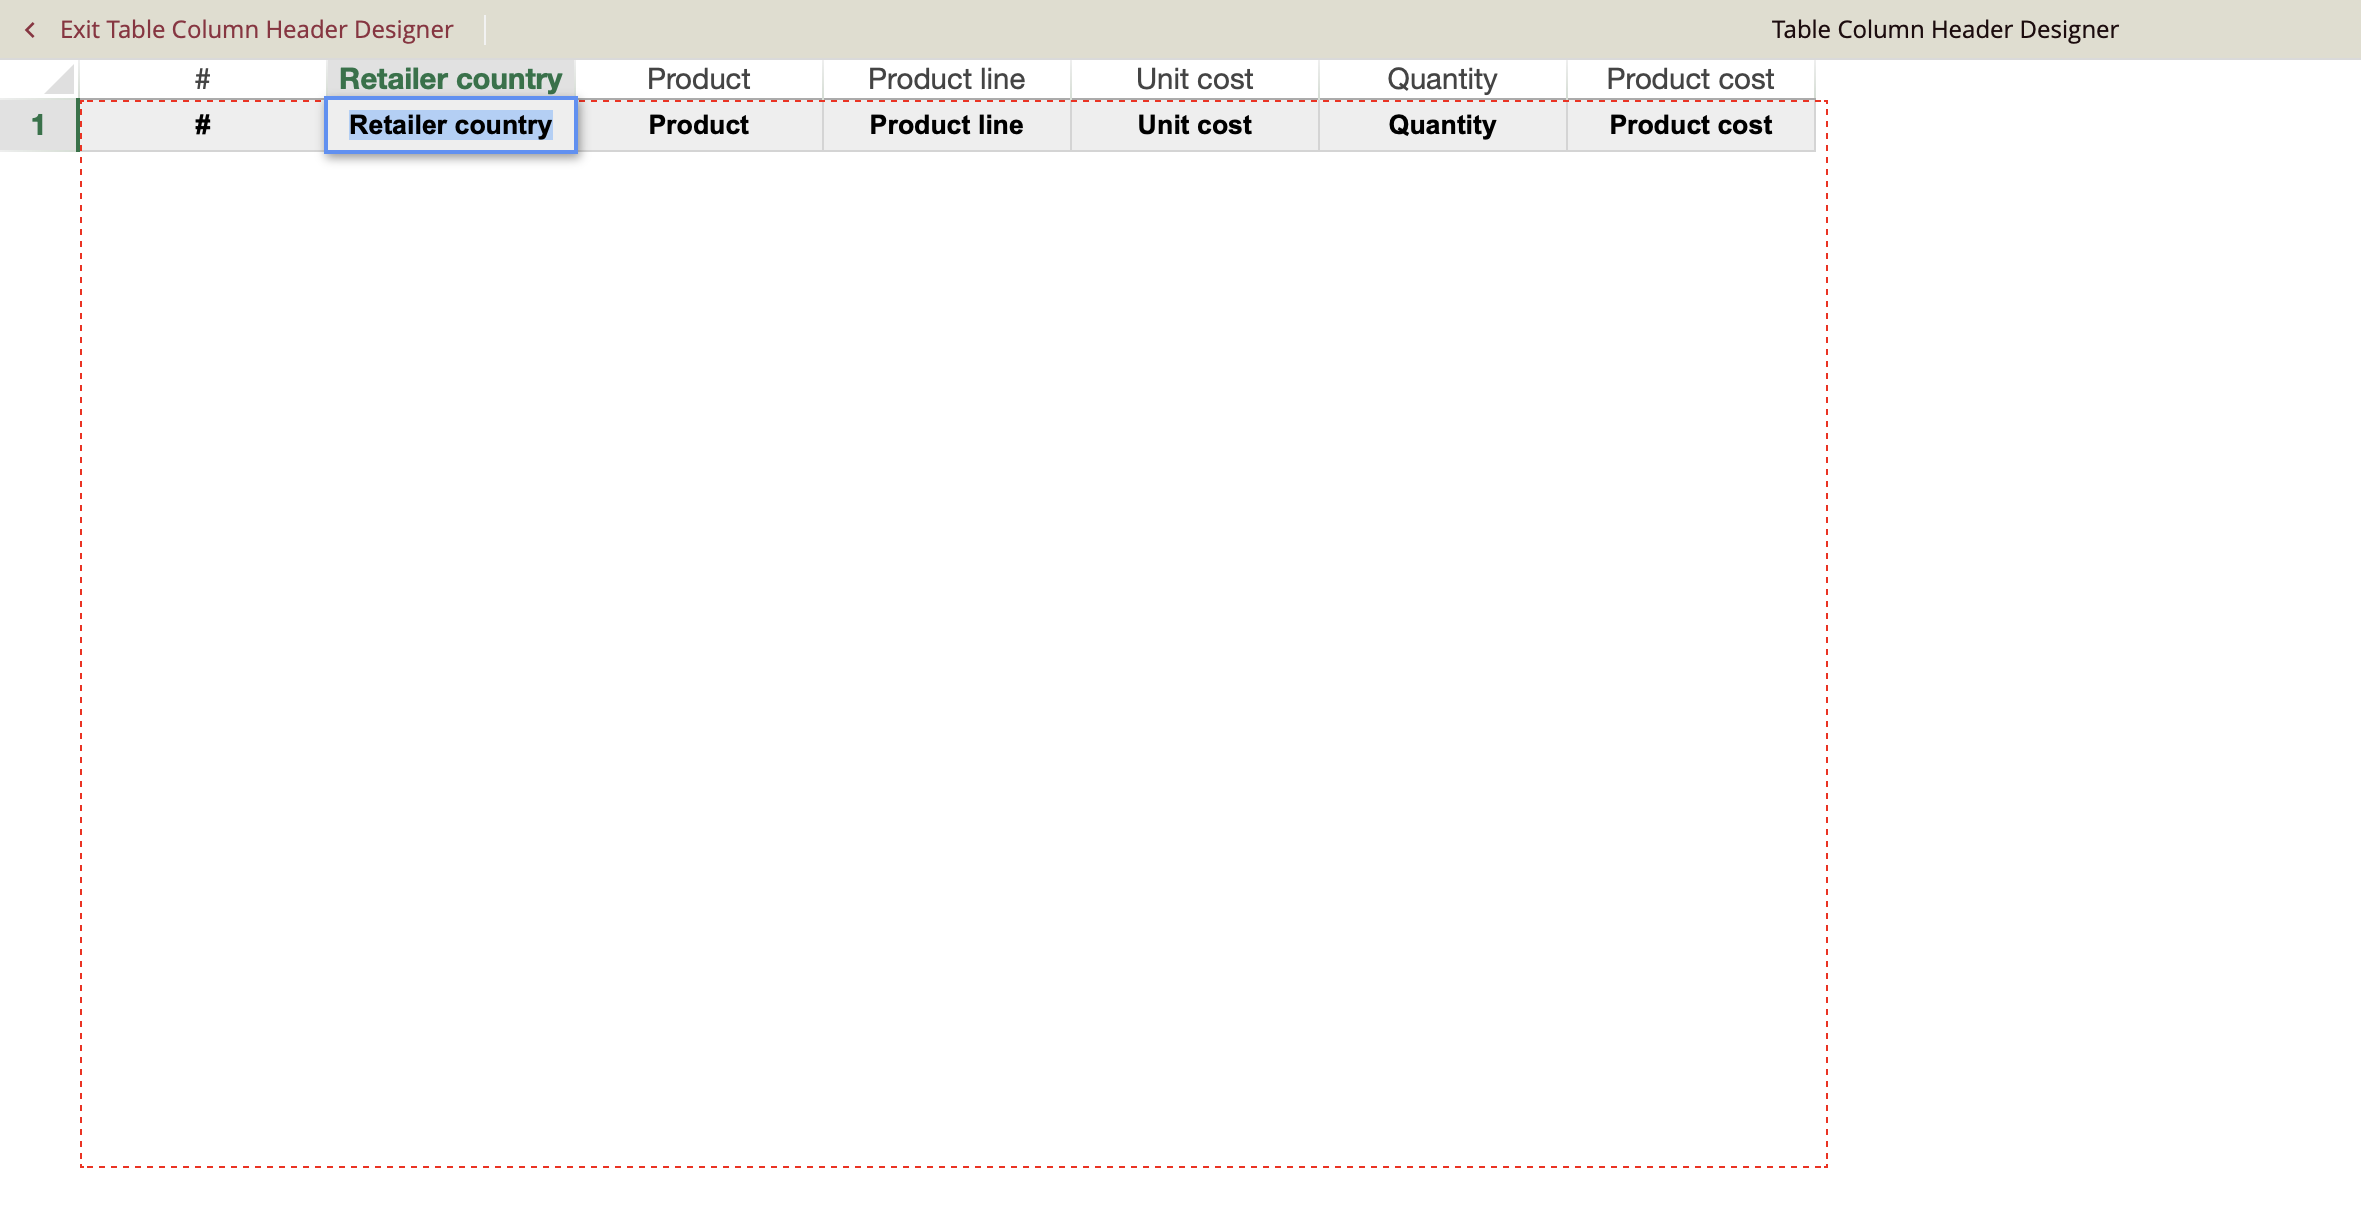
In this case, I have replaced "Retailer country" with "Country". Once you are done with your changes, click on the arrow to go back. Make sure to select Yes in the Save Table Column Header Changes window.
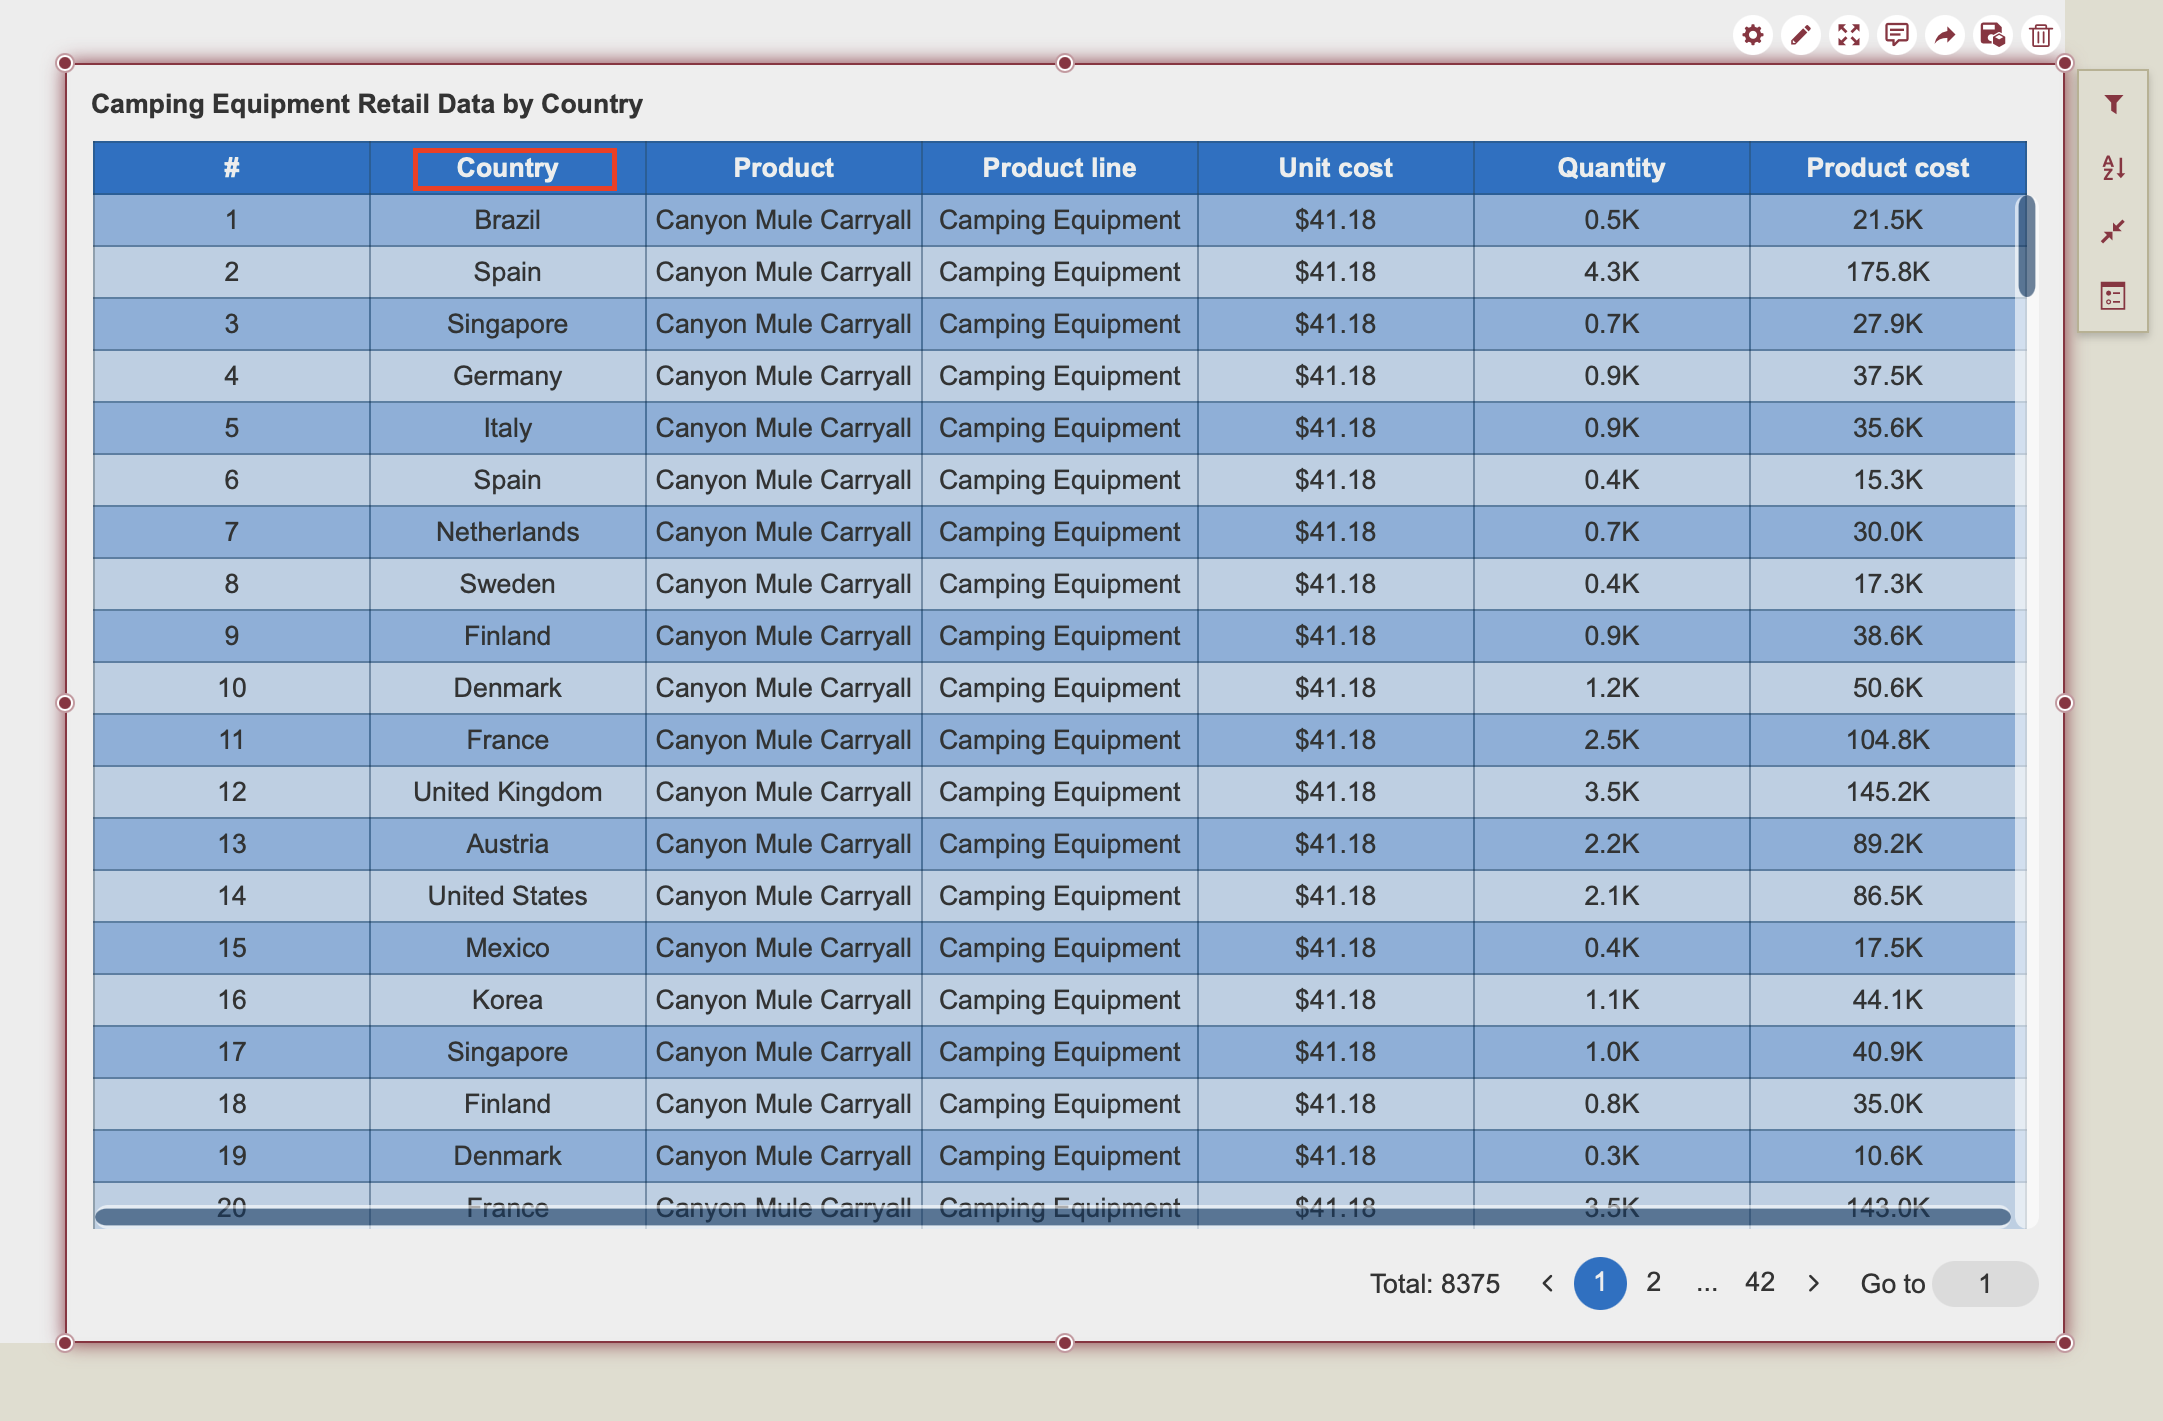
This is the table with the new header name.
Copy Table Content
To copy cell content, you can either copy data row by row or cell by cell. Simply preview the table, and left-click on your table to select table data and Ctrl+C.
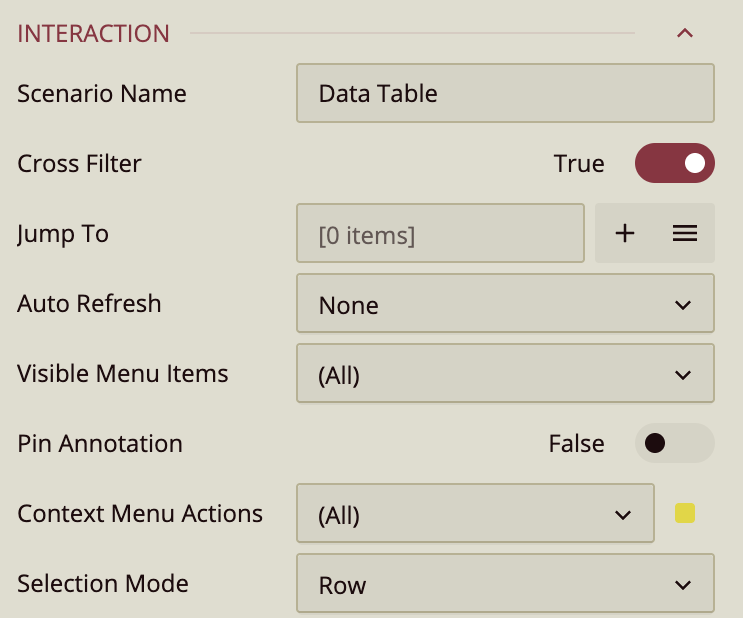
To select data cell by cell, go back to the dashboard designer, select the table, and locate the Selection Mode property in the Inspector Tab. Alternatively, search for it in the search bar. You will find Selection Mode under the Interaction group of properties. Switch Selection Mode to Cell.
Add Conditional Format
If you want to highlight specific values, you can add something called conditional formatting. Basically, this means setting a condition that your data needs to meet for it to be formatted a certain way.
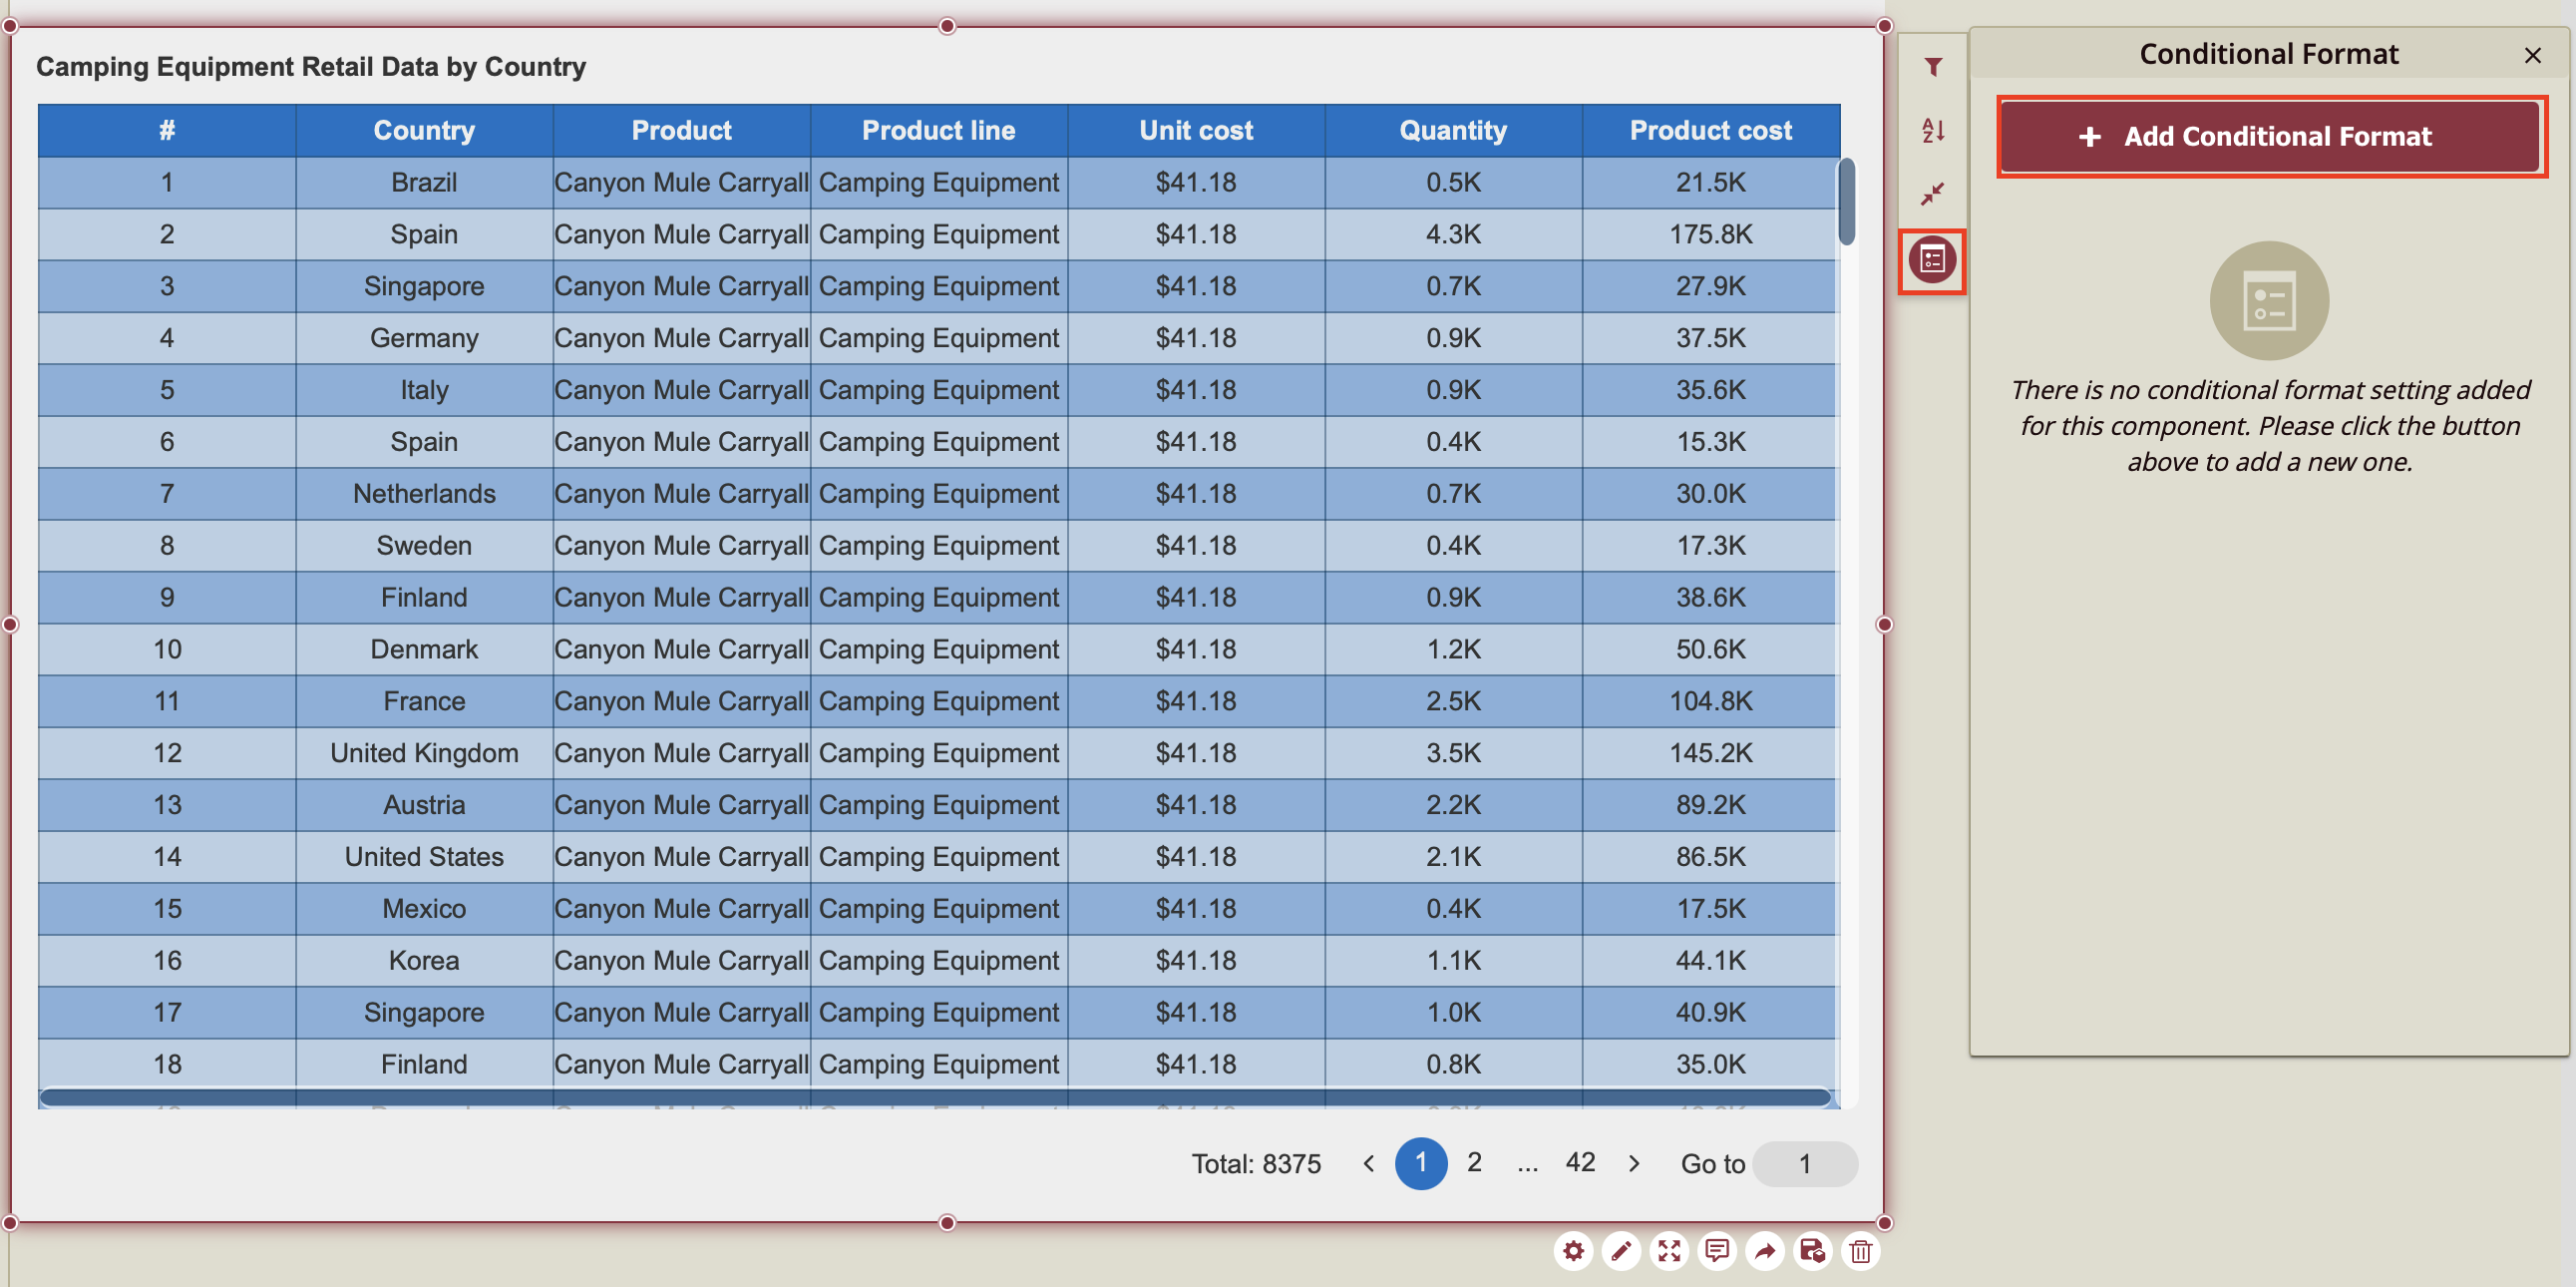
For example, say we want to highlight all the countries that exceeded a product quantity of 10.0K.
Click on the data table to select it. On the right-hand side quick action icons, click the table icon. In the window that opens, click + Add Conditional Format.
The condition that we want the data to meet is having a product quantity over 1.0K. This means we will set our conditional format for "Quantity". Click on the data binding slot to open the dropdown and select "Quantity".
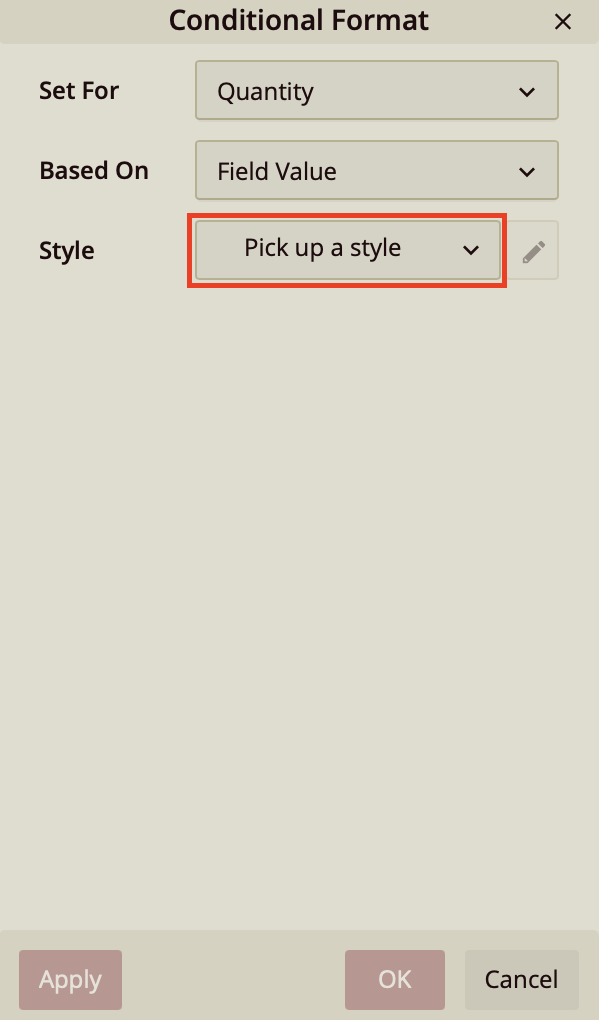
We're going to leave the Based On property to "Field Value", because the formatting is going to be based on the condition that the field we have chosen would fulfill, and not "Another Field". Nor are we going to make a "Comparison" as it states in the dropdown.
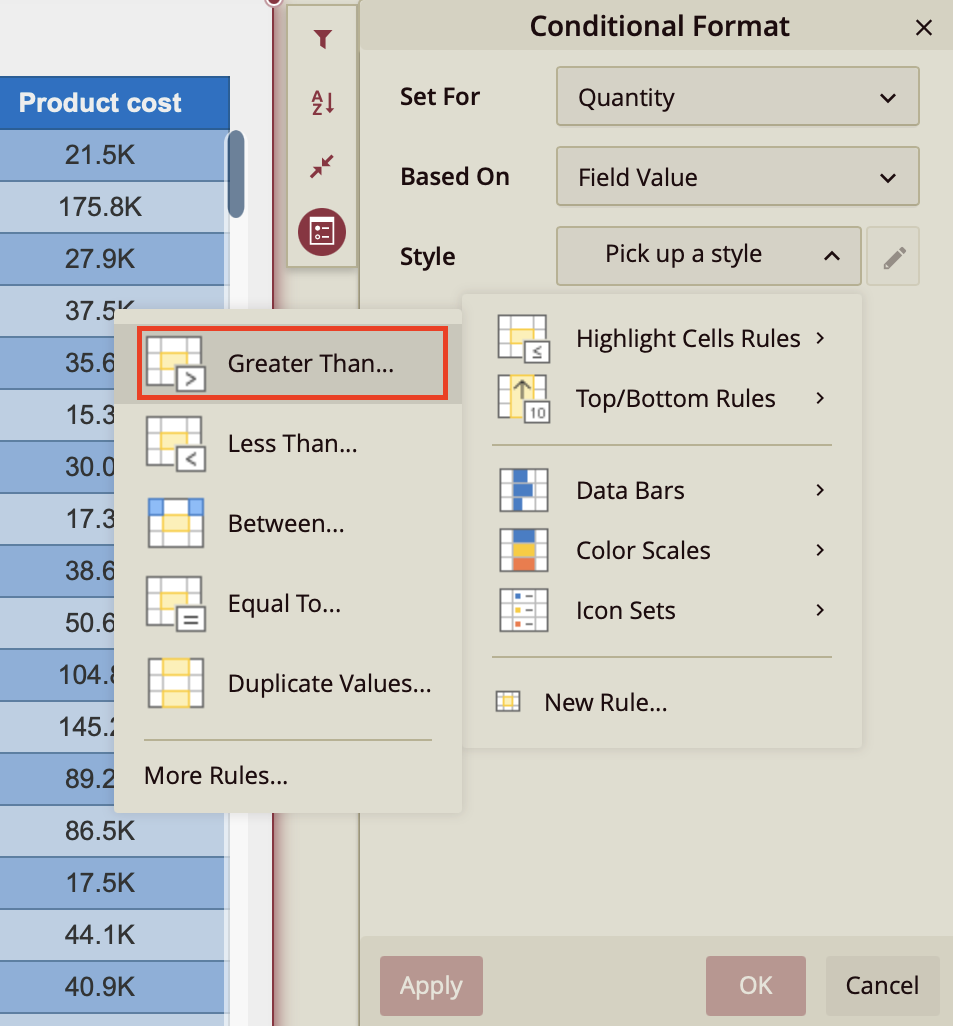
Click on "Pick up a style" to open the dropdown from which we will choose our formatting. Click "Highlight Cells Rules" and select "Greater Than".
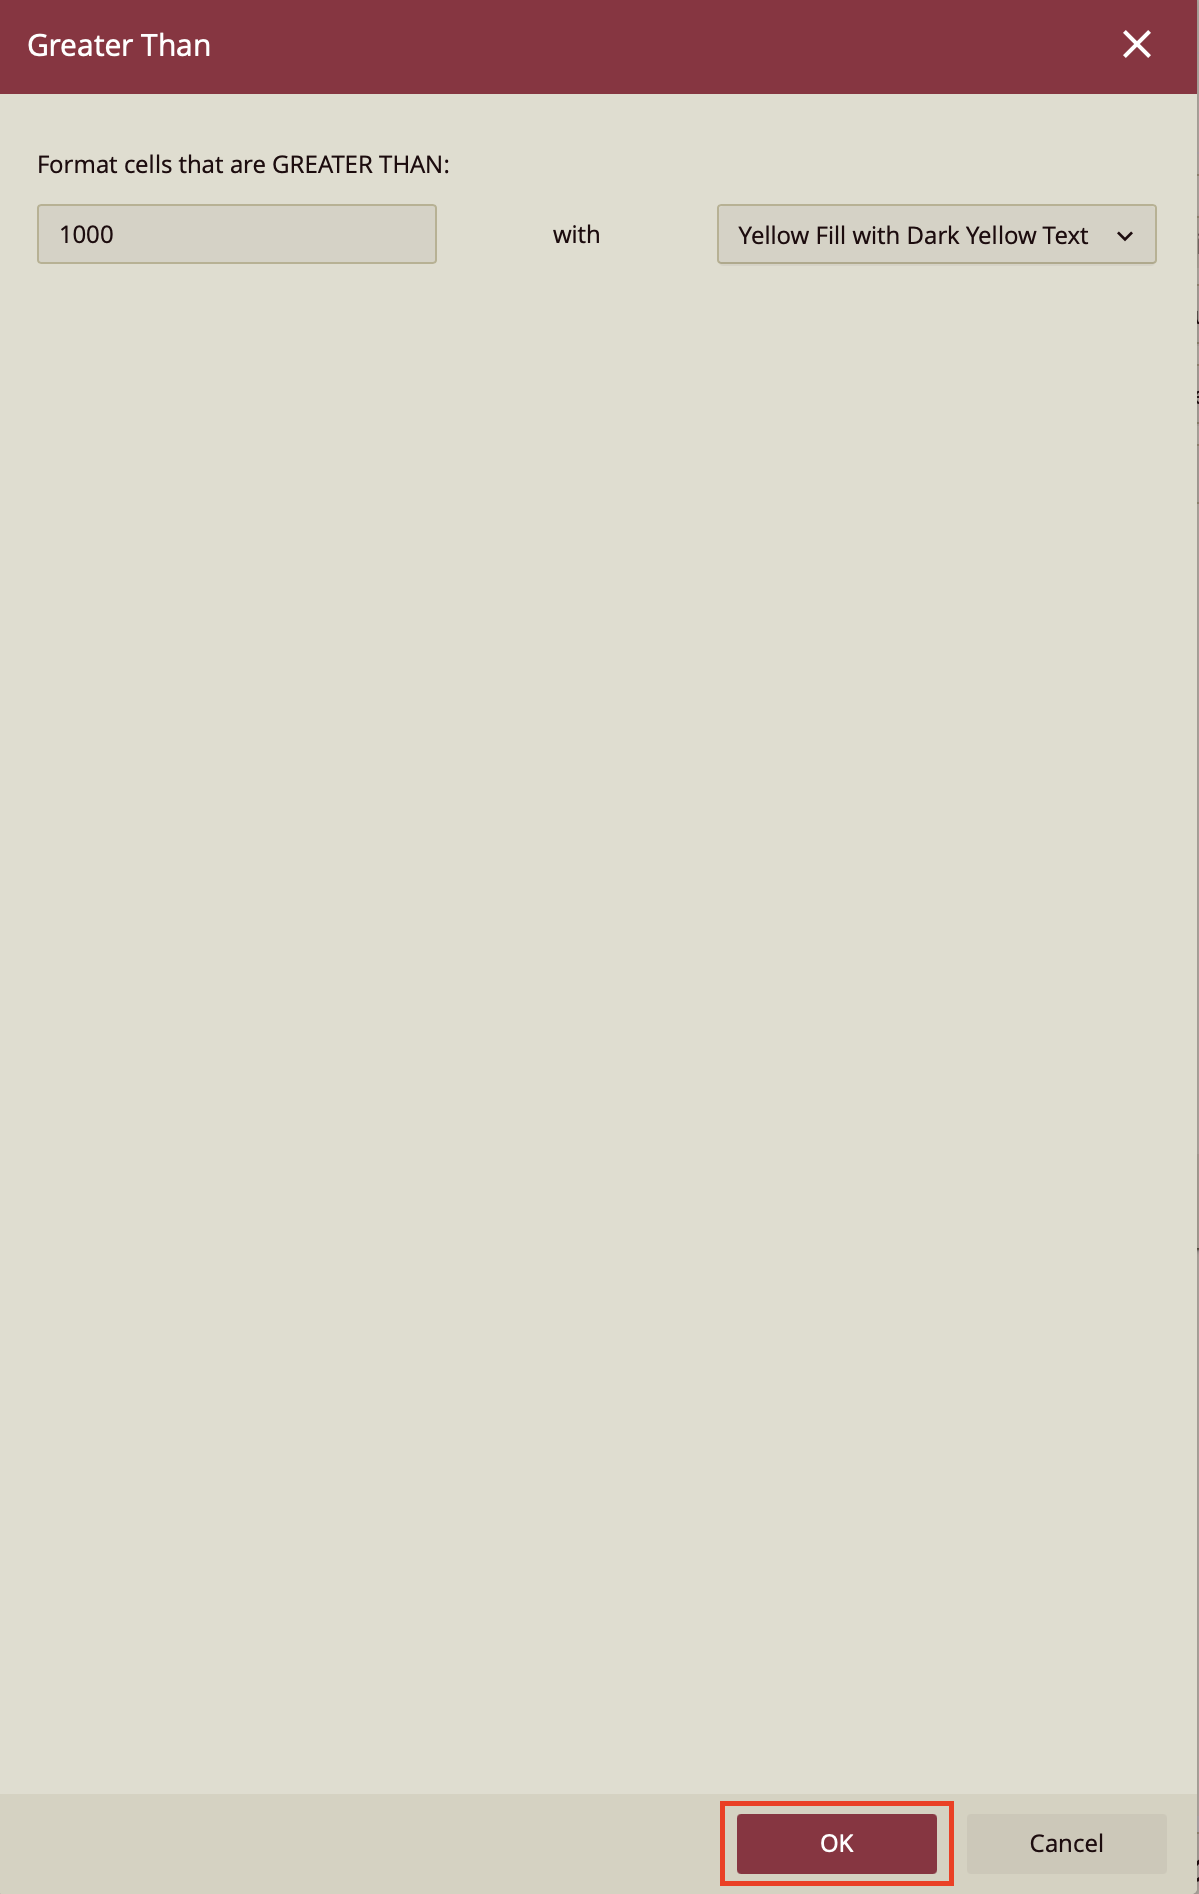
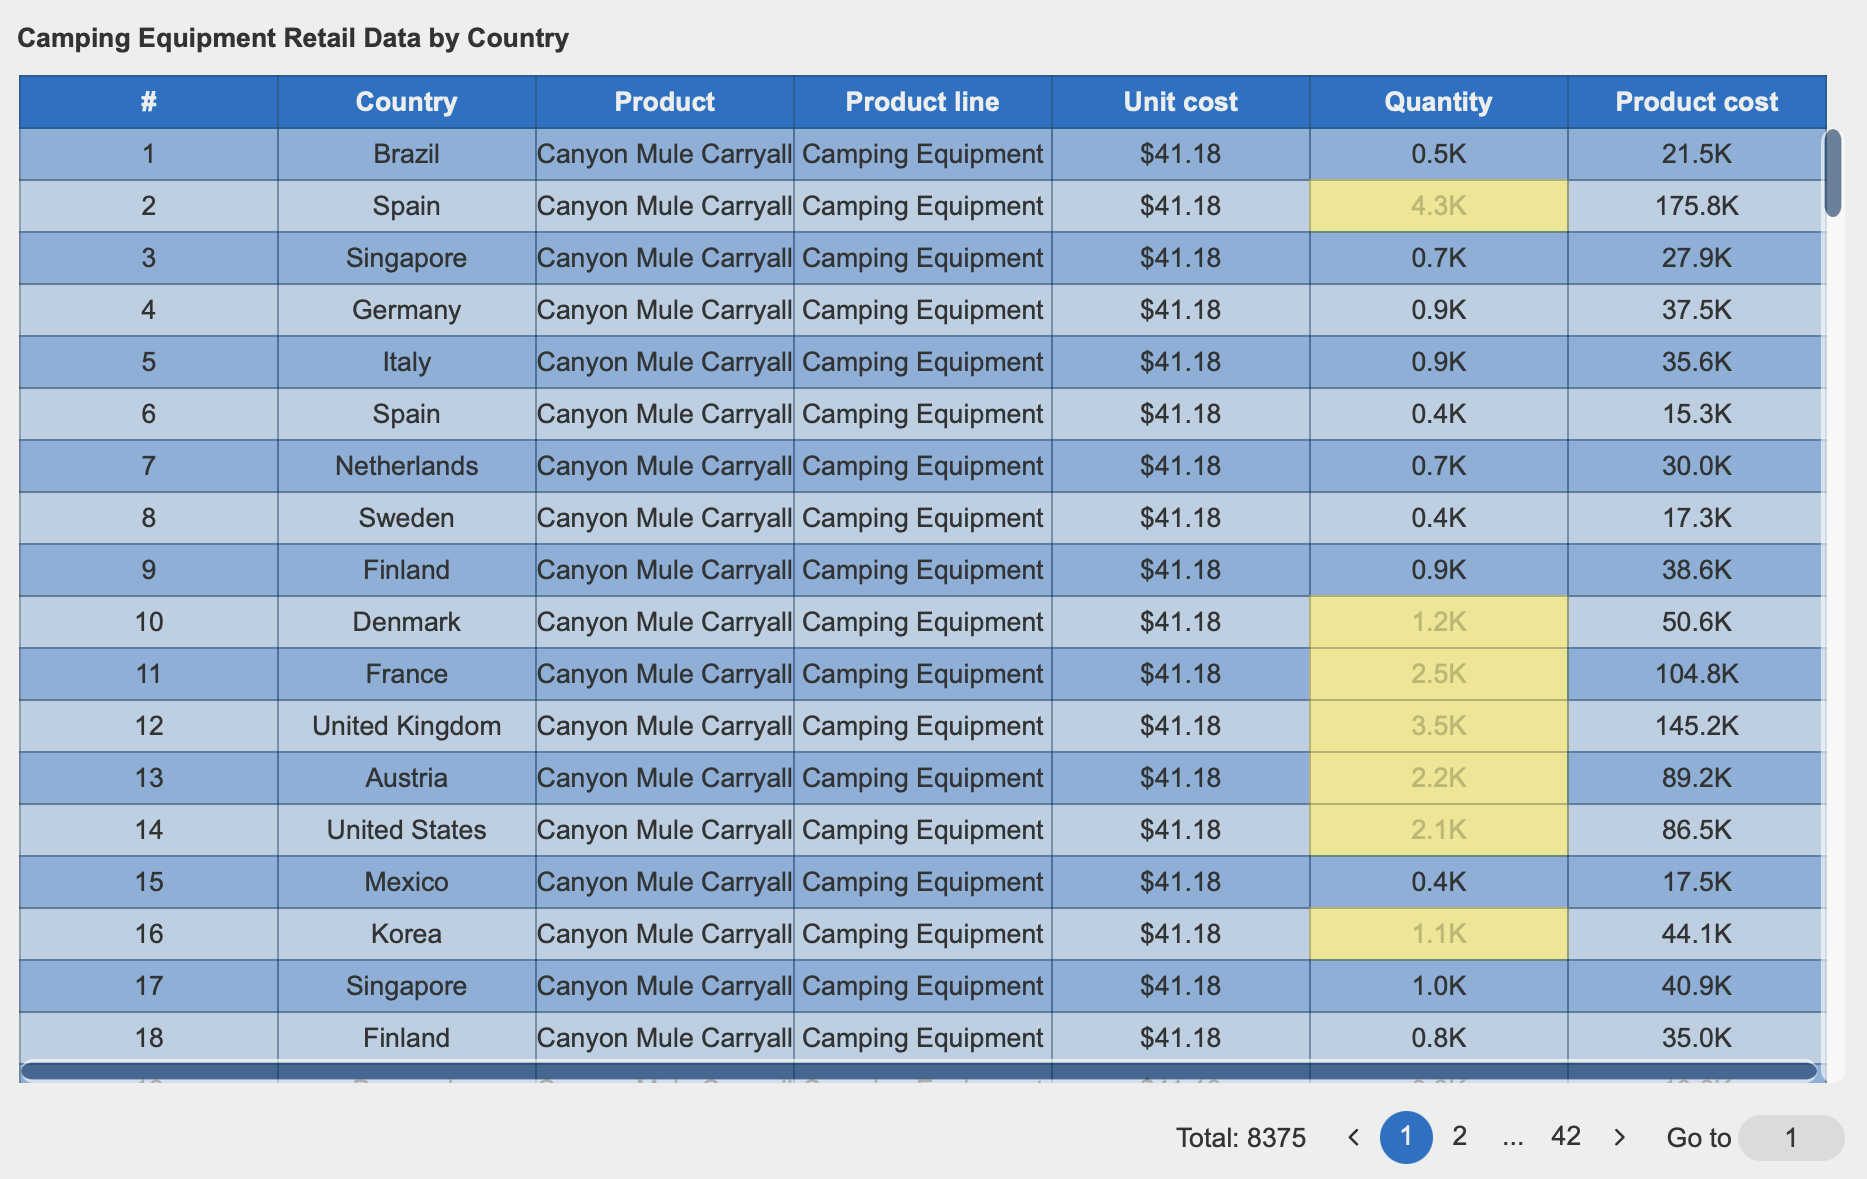
This will open a window, from which we will write the format. We're going to type out "1000" in the first data slot and then click on the next slot to open the dropdown from which we can choose our format. In this case, we have chosen "Yellow Fill with Dark Yellow Text". Click OK.
Allow Sorting
In addition to all the customization we have described, you can also customize your dashboard scenario to allow sorting in the preview. Click Preview on the designer ribbon to preview your dashboard.

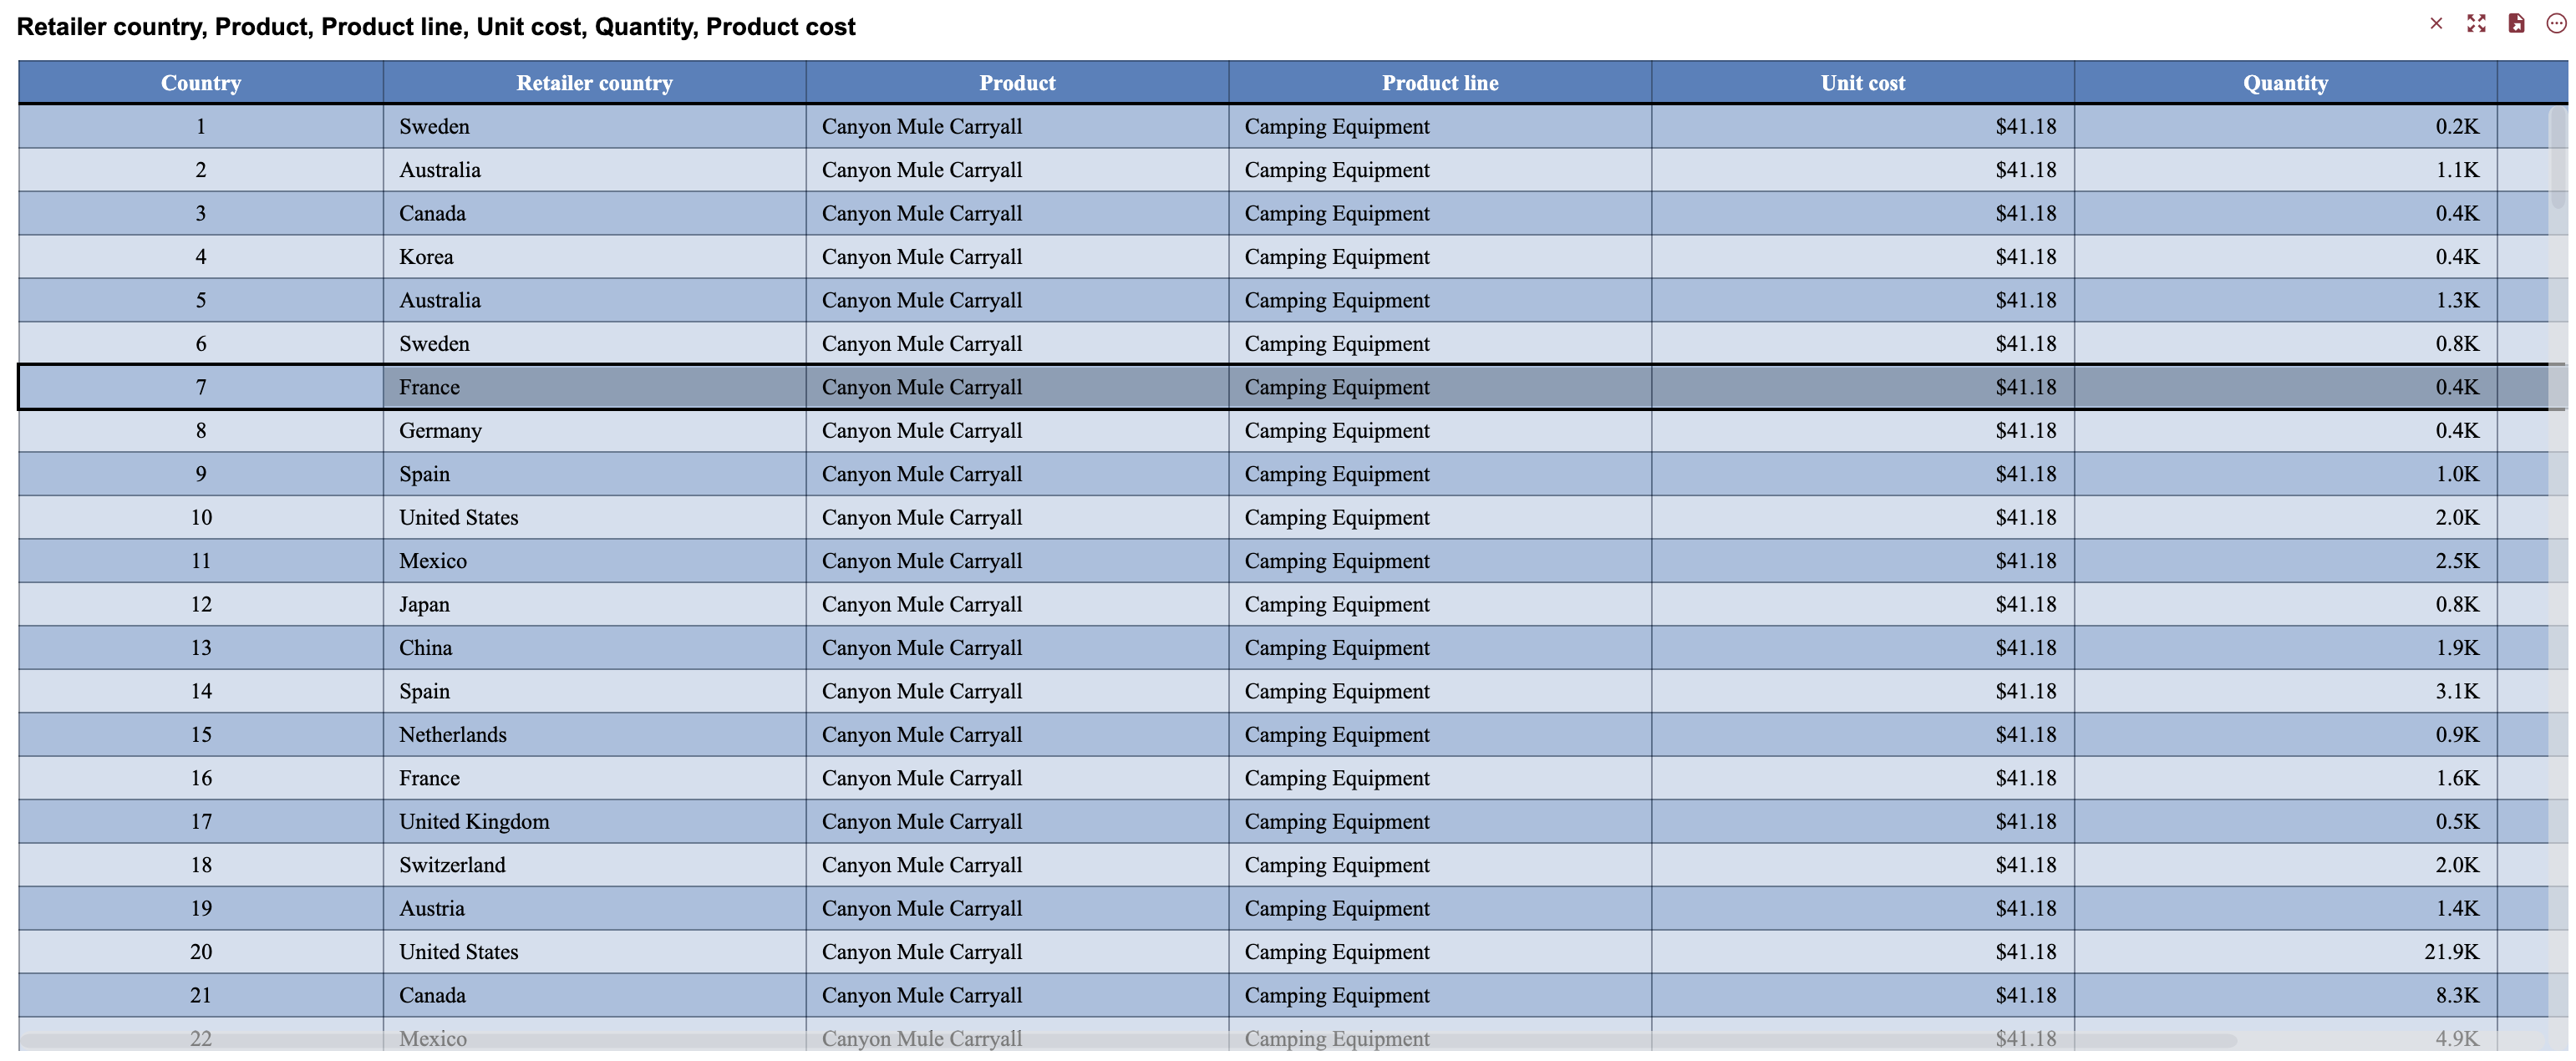
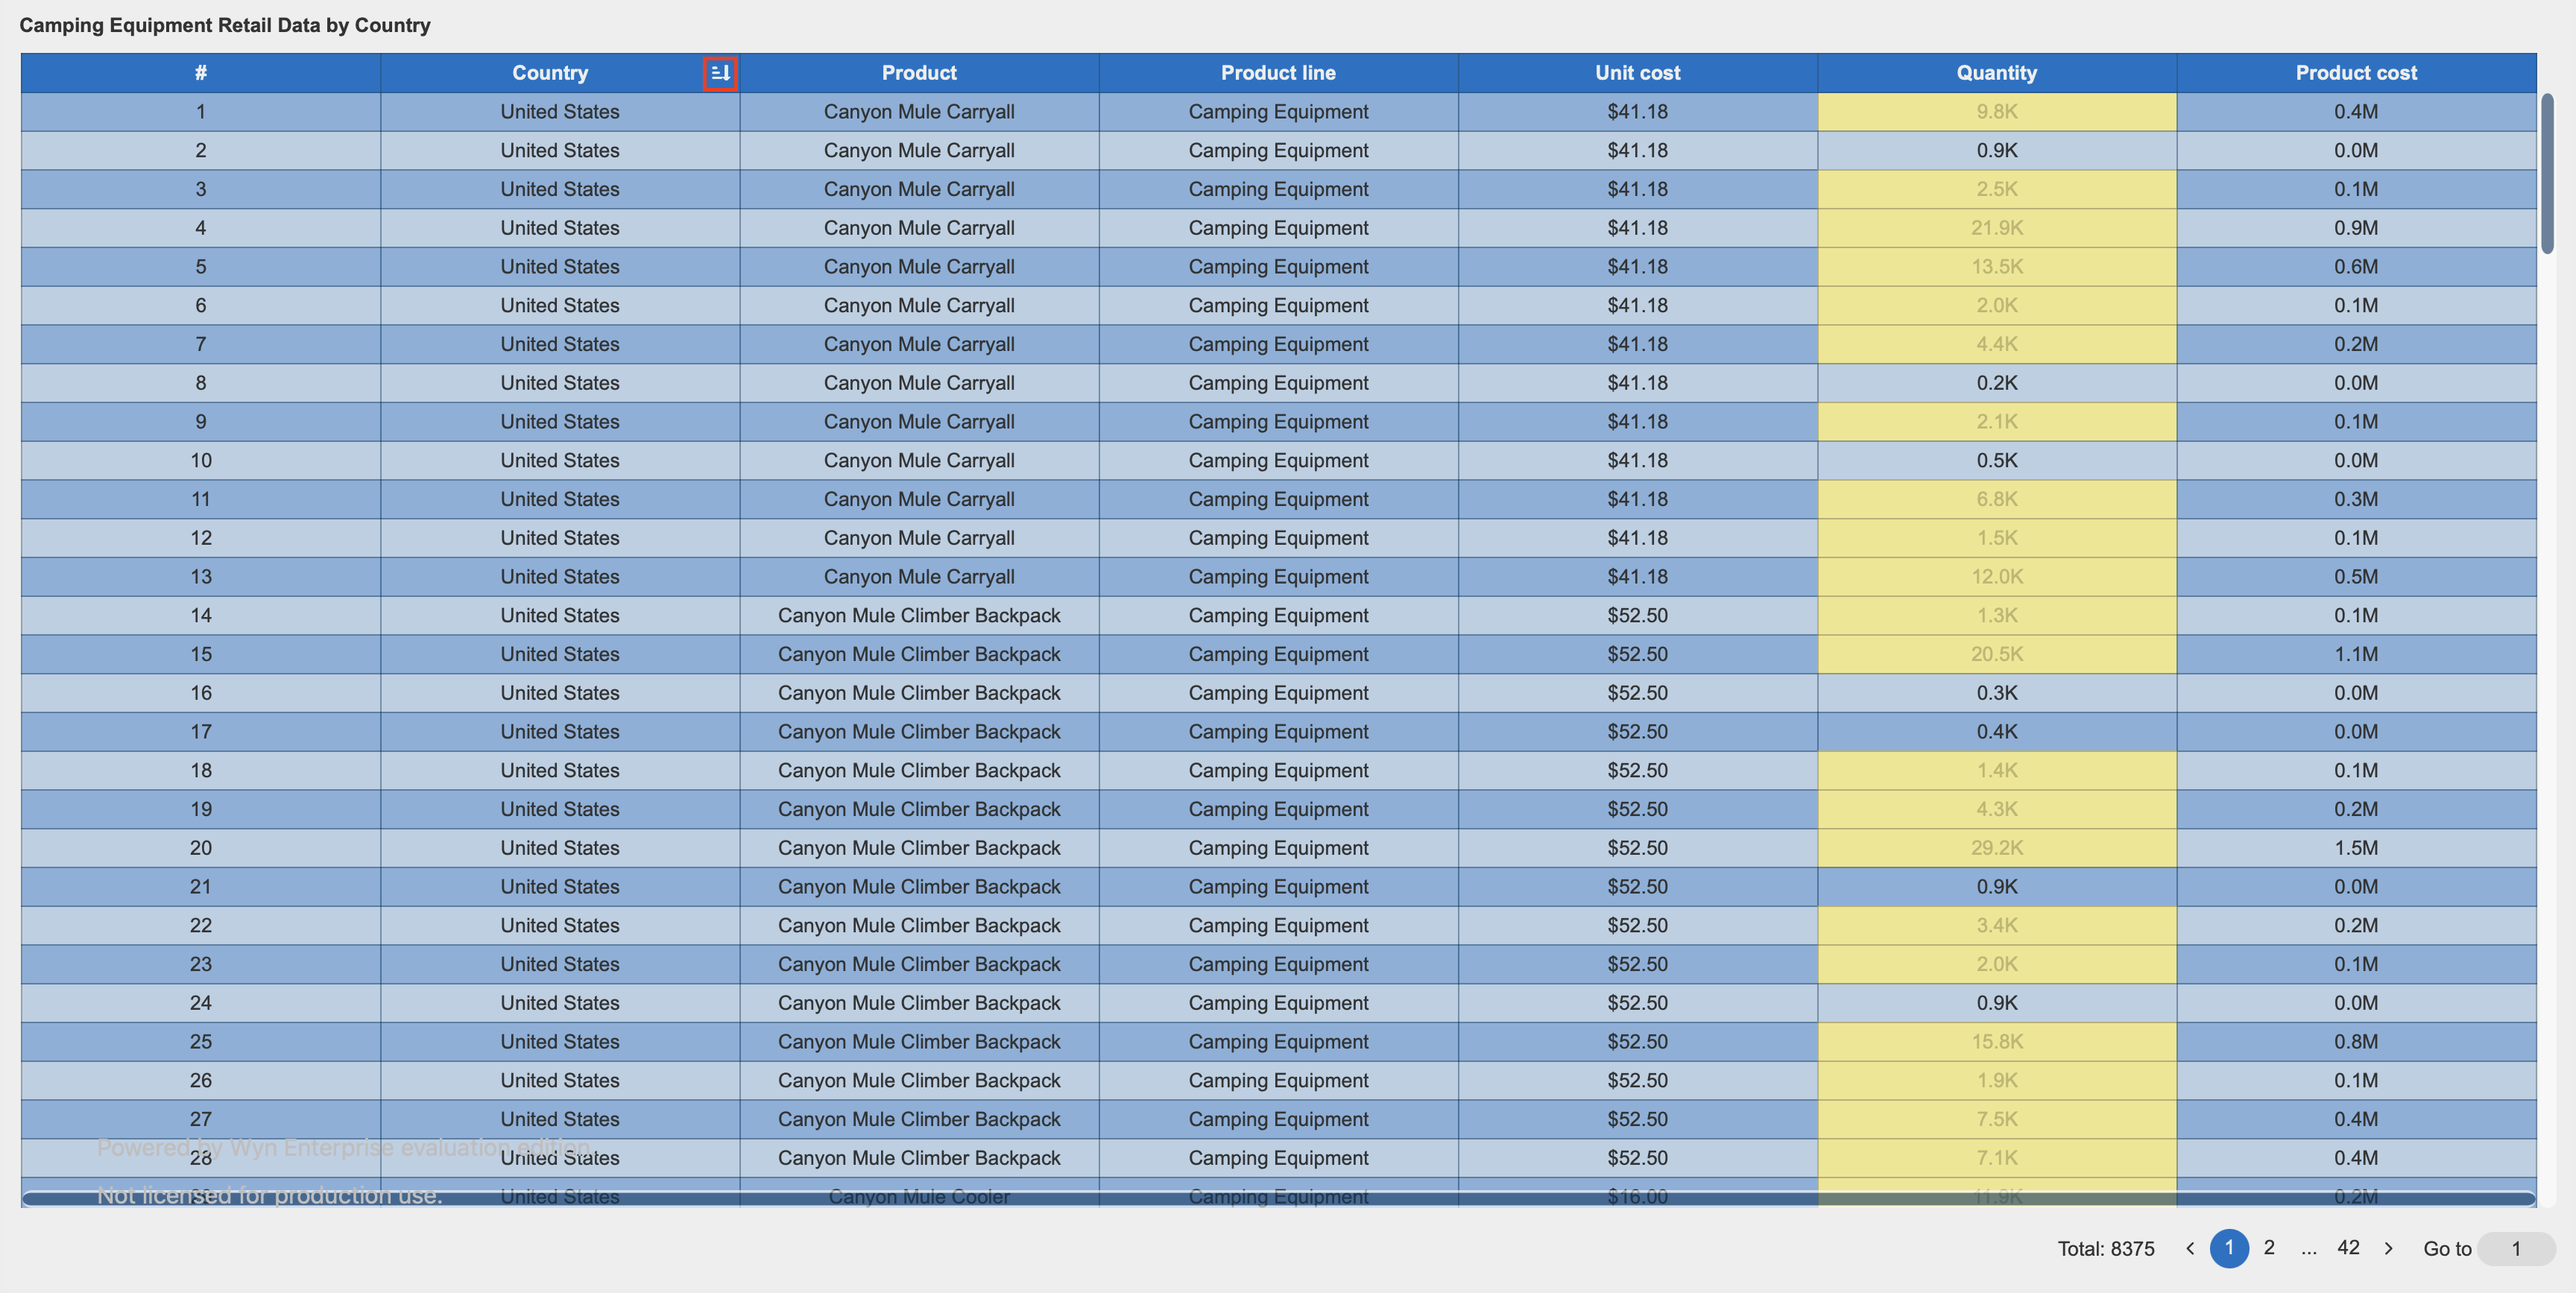
Double-click on any of the column headers, the data which you want to enable sort for. In this case, we have sorted by "Country" by double-clicking the "Country" column header. The screenshot below displays the data sorted by country in descending order. You can click on the ascending icon to change that.
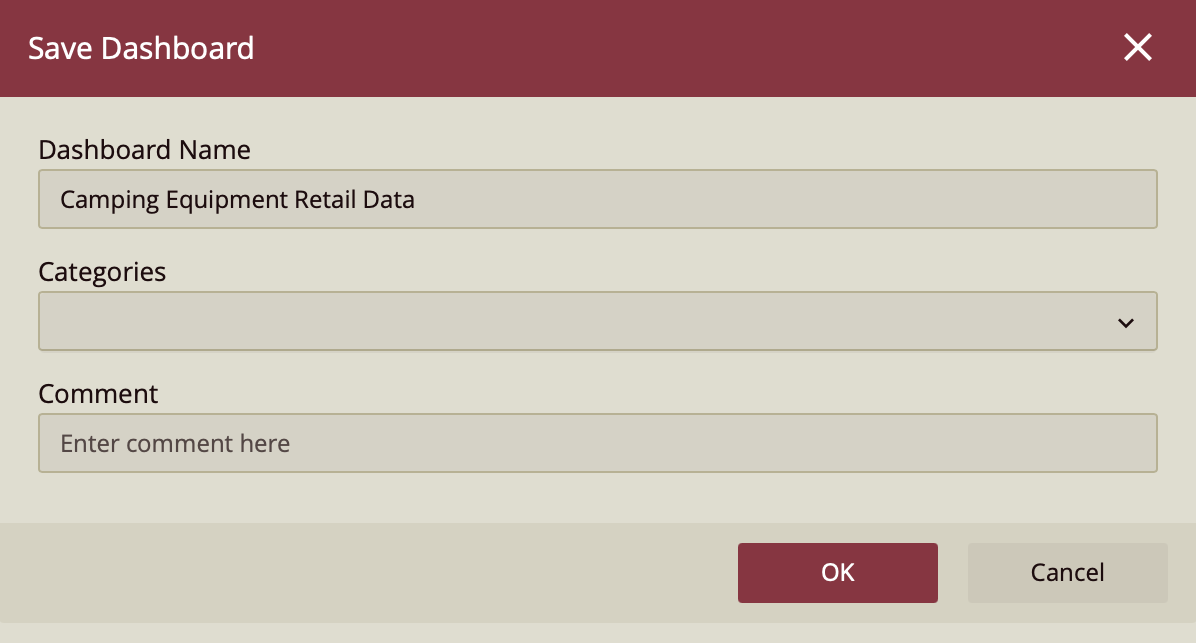
Save Your Dashboard
Save your dashboard by clicking on the save icon on the top ribbon.

Name your dashboard and click OK to save. You can also assign it to a category and/or add a comment, if you wish to do so.