- Getting Started
- Administration Guide
-
User Guide
- An Introduction to Wyn Enterprise
- Document Portal for End Users
- Data Governance and Modeling
- Working with Resources
- Working with Reports
-
Working with Dashboards
- Dashboard Designer
- Selecting a Dataset
- Data Attributes
- Dashboard Scenarios
- Dashboard Templates
- Component Templates
- 3D Scene
- Explorer
- Visualization Wizard
- Data Analysis and Interactivity
- Dashboard Appearance
- Preview Dashboard
- Export Dashboard
- Dashboard Lite Viewer
- Using Dashboard Designer
- Animating Dashboard Components
- Document Binder
- Dashboard Insights
- View and Manage Documents
- Understanding Wyn Analytical Expressions
- Section 508 Compliance
- Subscribe to RSS Feed for Wyn Builds Site
- Developer Guide
Filter View
When viewing your dashboard, you may choose to apply a filter to view the subset of data you wish to see visualized. Moreover, you can save this filter, and create and apply other filters. This feature is called Filter View. Its use is covered by the following topics:
Save Filter View
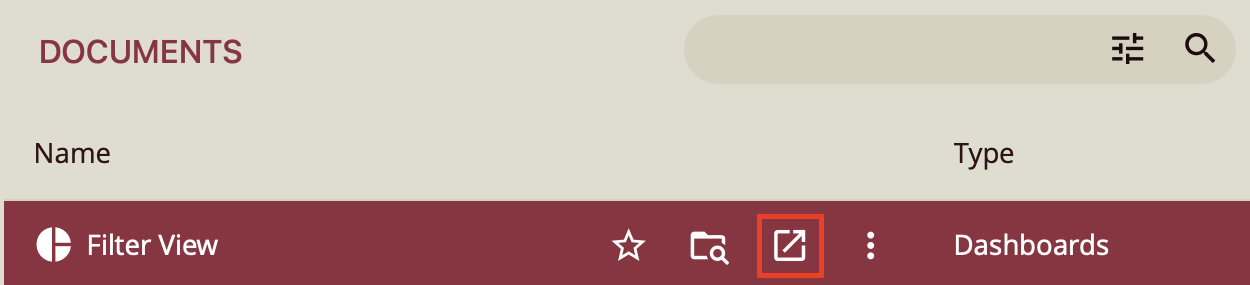
To open your dashboard viewer, click on the View Dashboards in new window icon.
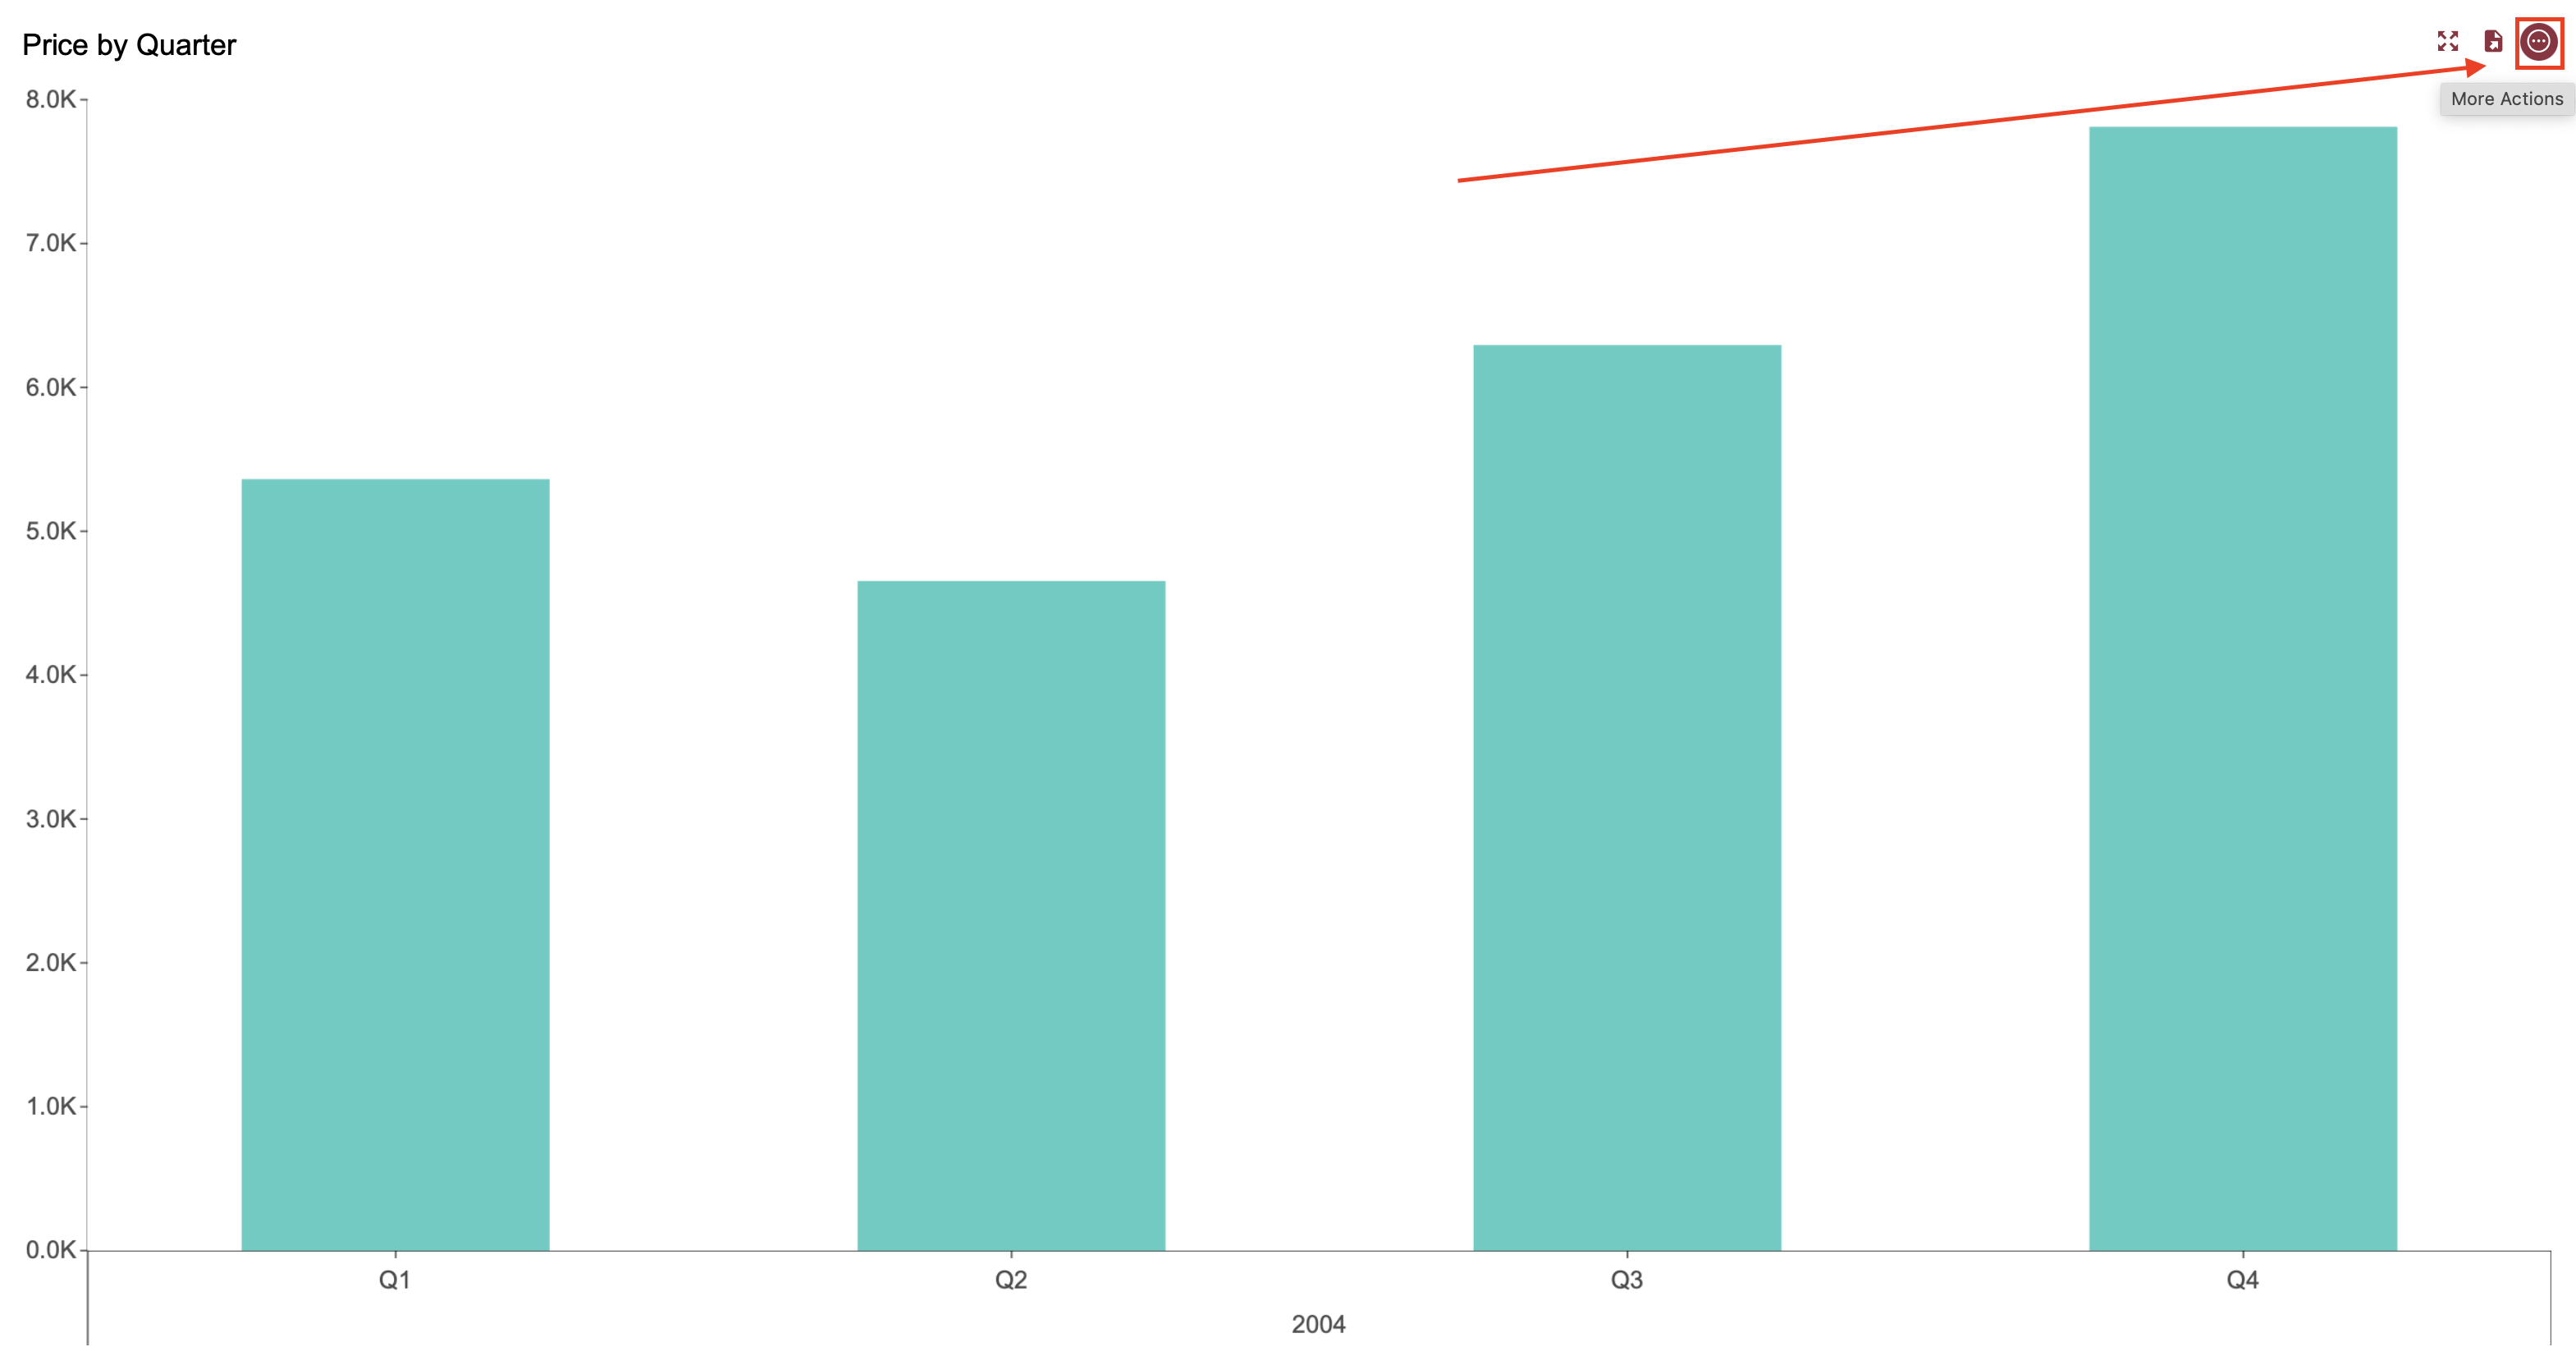
You can see the filters applied to your dashboard scenario by clicking on the visualization. On the upper right-hand side, click on the ellipsis button to open the dashboard menu.
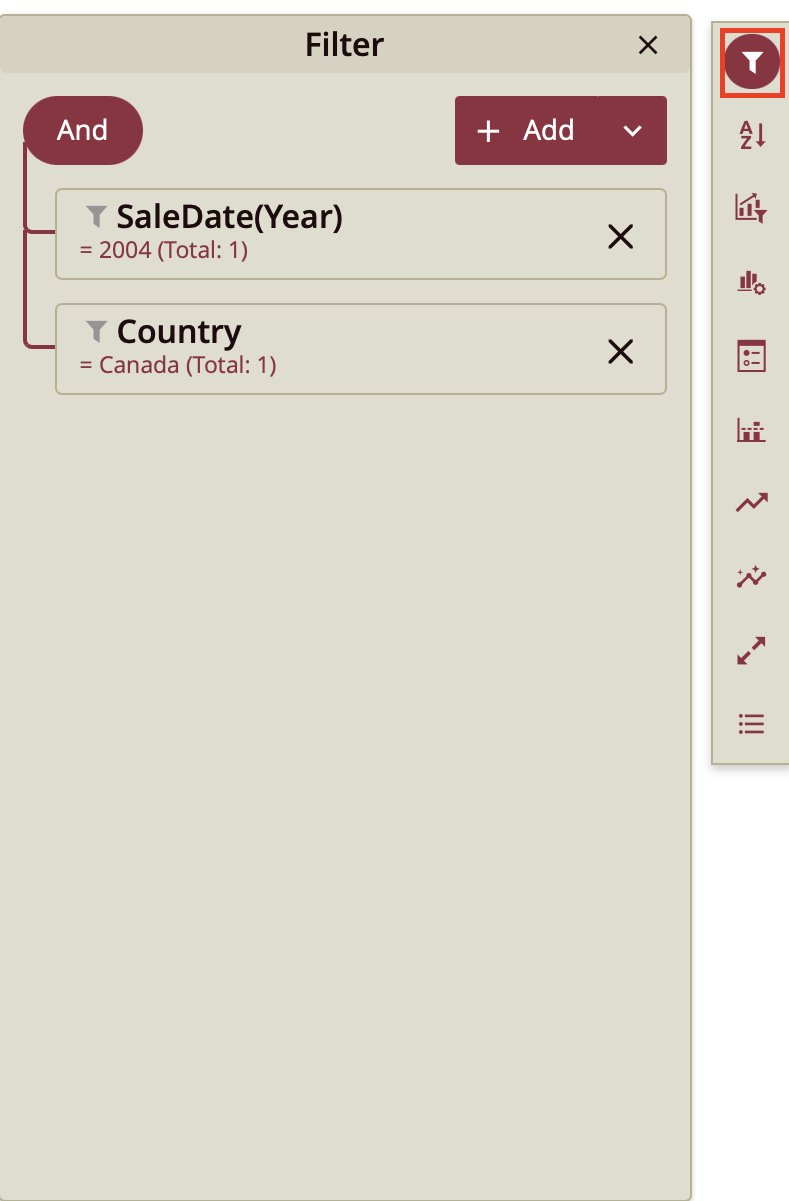
Click on the funnel icon to view the filters applied to your visualization.This dashboard has been filtered by sale date (year) and by country.
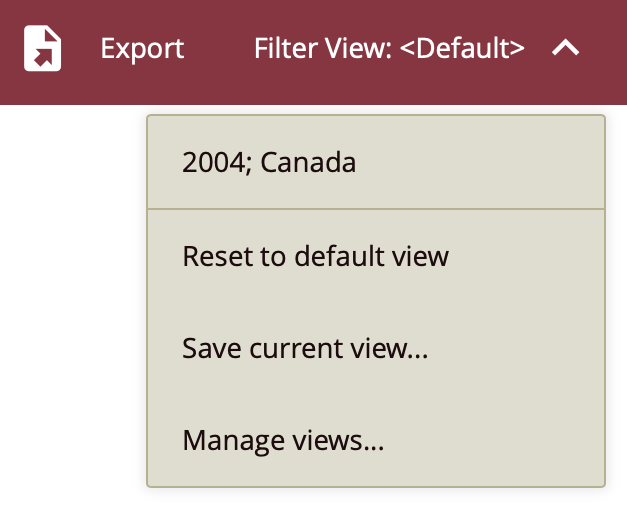
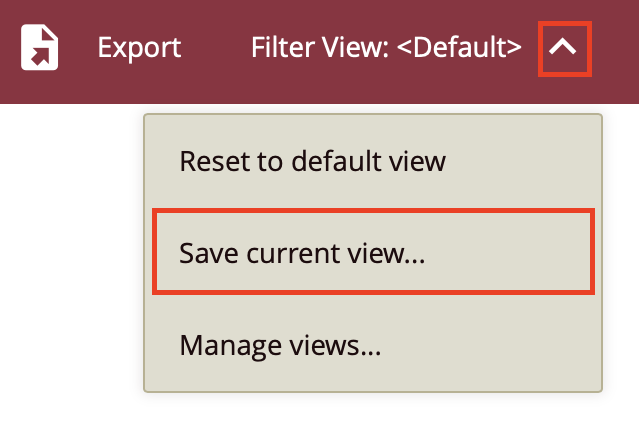
To save these filters to your visualization, click on the Filter View menu on the top ribbon to open the dropdown. Select Save current view... to save the filters previously applied to your visualization as a filter view.
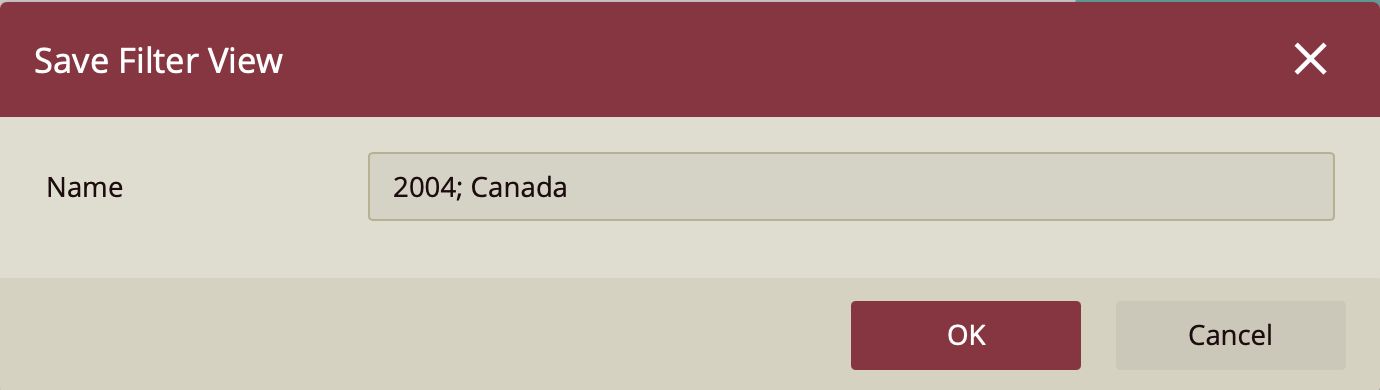
In the Save Filter View... window, type in the name of your filter and click OK.
If you would like to apply a new filter to your dashboard, repeat steps 2-3 to open the filter window. To learn more about setting a filter, you can read the Filter Data article.
Delete Filter View
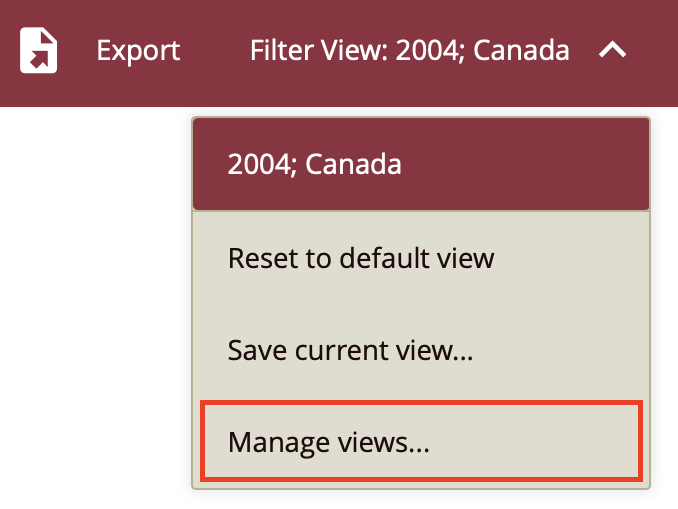
To delete a filter view, click on the Filter View menu and select Manage Filter Views.
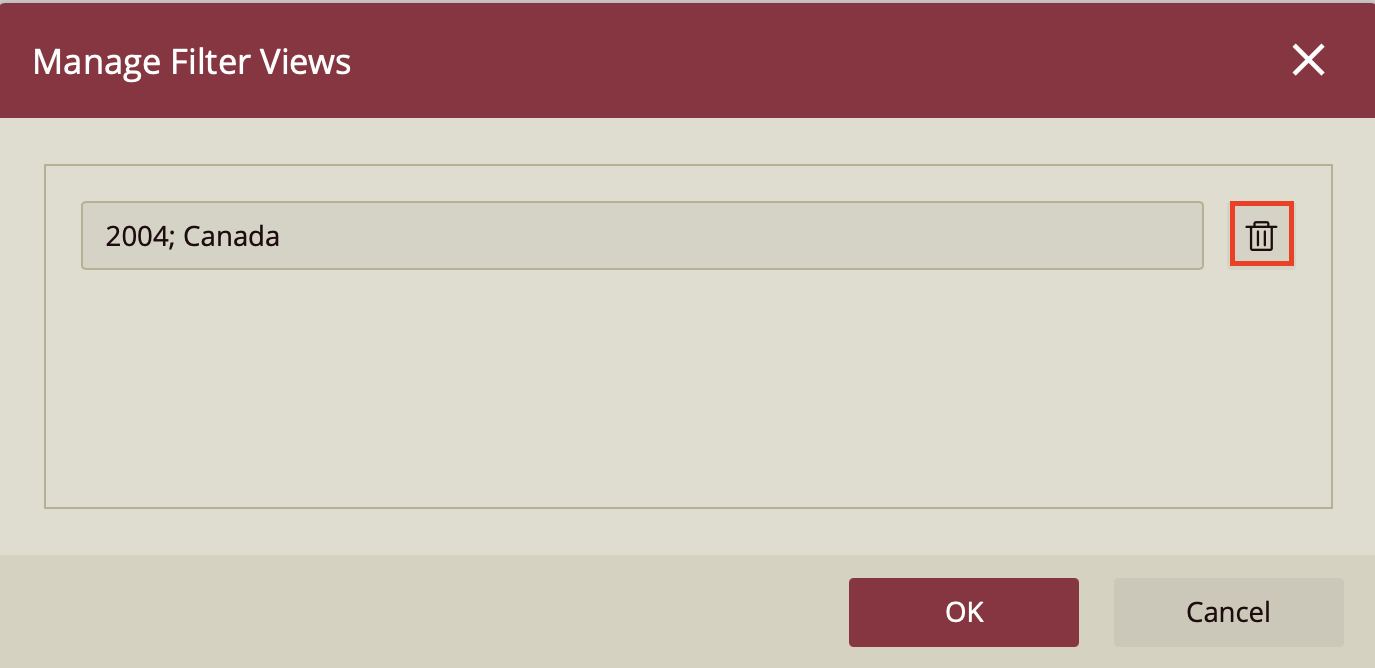
In the Manage Filter Views window, click the trashbin icon to delete a view. Click OK to save.
Reset Dashboard Filters
To reset your dashboard scenario to its original display, click on the Filter View menu and select Reset to Default View. Your dashboard will display its original values.
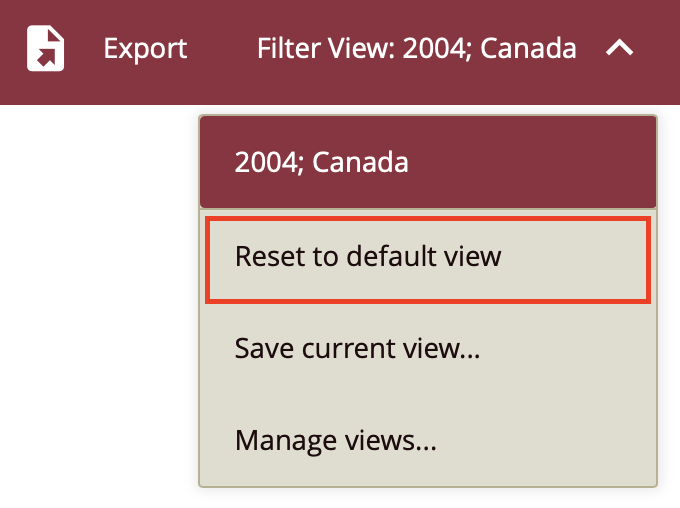
However, you can still go back to your previously created filter view in the dropdown, that is, if you haven't deleted it.