- Getting Started
- Administration Guide
-
User Guide
- An Introduction to Wyn Enterprise
- Document Portal for End Users
- Data Governance and Modeling
- Working with Resources
- Working with Reports
-
Working with Dashboards
- Dashboard Designer
- Selecting a Dataset
- Data Attributes
- Dashboard Scenarios
- Dashboard Templates
- Component Templates
- 3D Scene
- Explorer
- Visualization Wizard
- Data Analysis and Interactivity
- Dashboard Appearance
- Preview Dashboard
- Export Dashboard
- Dashboard Lite Viewer
- Using Dashboard Designer
- Animating Dashboard Components
- Document Binder
- Dashboard Insights
- View and Manage Documents
- Understanding Wyn Analytical Expressions
- Section 508 Compliance
- Subscribe to RSS Feed for Wyn Builds Site
- Developer Guide
Filter Data
Filtering data helps you display relevant data and hence building an effective dashboard.
You can add filters (or filter groups) from the measures and dimensions in the dataset, or specify your filter values and conditions. Use filter groups when you want to nest multiple filter conditions joined in an AND (where all the filter conditions are true) or OR (where either one filter condition or the other is true) relationship. The options available for setting the filter conditions available under the different tabs of the Filter dialog are described below.
You should choose the General tab if you want to add filters from the available dimensions, measures, or dashboard parameters.
Field | Description |
|---|---|
Target Field | Specify the data attribute on which you want to apply the filter. |
Use custom value | To use a custom value to filter data |
Use a new parameter | To use a parameter to filter data |
Sort | Sort the data in ascending or descending values |
Exclude Matched | Set to True or False to exclude or include the matched attribute values, respectively |
Switch to the Value Range tab if you want to specify your filter values and conditions for measures.
Field | Description |
|---|---|
Condition | Specify the condition for filtering - Equal To, Not Equal To, Greater Than, Greater Than or Equal To, etc. |
Use custom value | To use a custom value to filter data |
Use a new parameter | To use a parameter to filter data |
Switch to the Matching Rules tab if you want to specify your filter values and conditions for dimensions (excluding the date attributes).
Field | Description |
|---|---|
Match Type | Specify the matching condition - Contains, Start With, End With, Exactly Match |
Case Sensitive | Specify if the filter should match case |
Match Value | Specify the value to match with according to the filter condition |
Switch to the Date Range or Relative Range tab if you want to specify your filter values and conditions for date attributes.
Field | Description |
|---|---|
Start Date | Use a custom value or parameter to filter data |
End Date | Use a custom value or parameter to filter data |
Date Unit | Specify the data unit - Year, Quarter, Month, Week, Day, Hour, Minute, etc. |
Condition | Specify the relative date condition for filtering data, such as Previous Year, This Year, Next Year, Last, Next, etc. |
Year | Use a custom value or parameter to filter data |
Exclude Matched | Set to True or False to exclude or include the matched attribute values, respectively |
Add a Filter
Refer to the following example, where a filter is applied on the 'Month' dimension in a chart to show the number of tickets for the first three months of the year. Select the dashboard scenario in the design area for which you want to filter the data. Note that an Action Bar automatically appears on the right of the selected scenario.
In the Document Portal, from the Favorites menu, select the IT Help Desk Analysis sample dashboard.
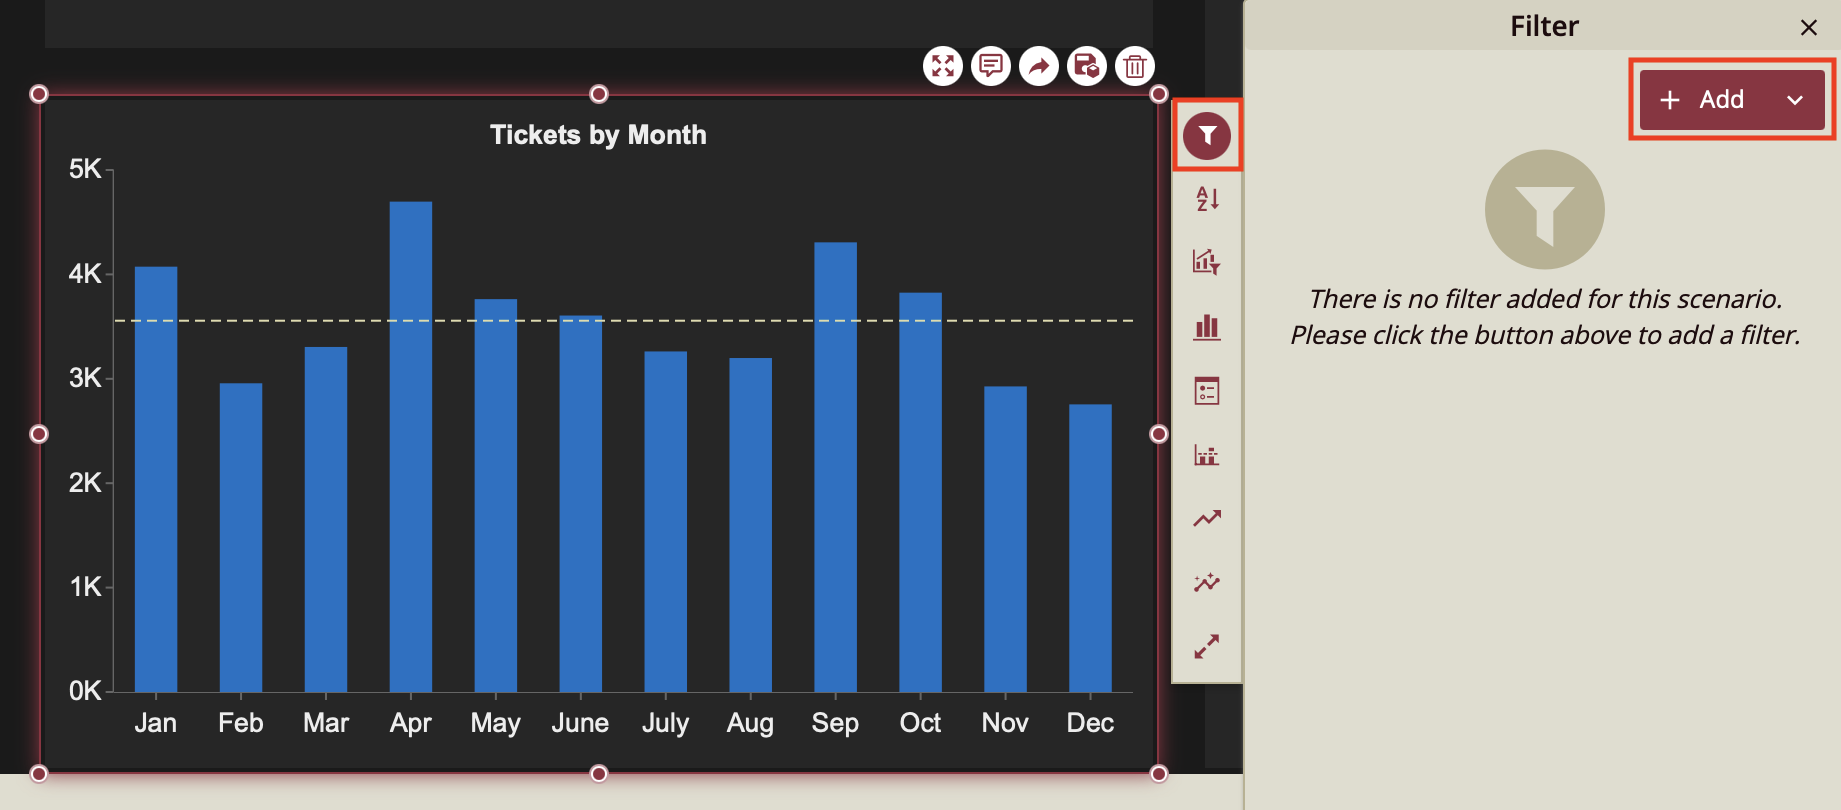
From the Action Bar, select Filter action
 .
.In the Filter dialog box that appears, click the Add button to specify the filter condition and attribute.
Choose General since we want to add a filter from the available measures.
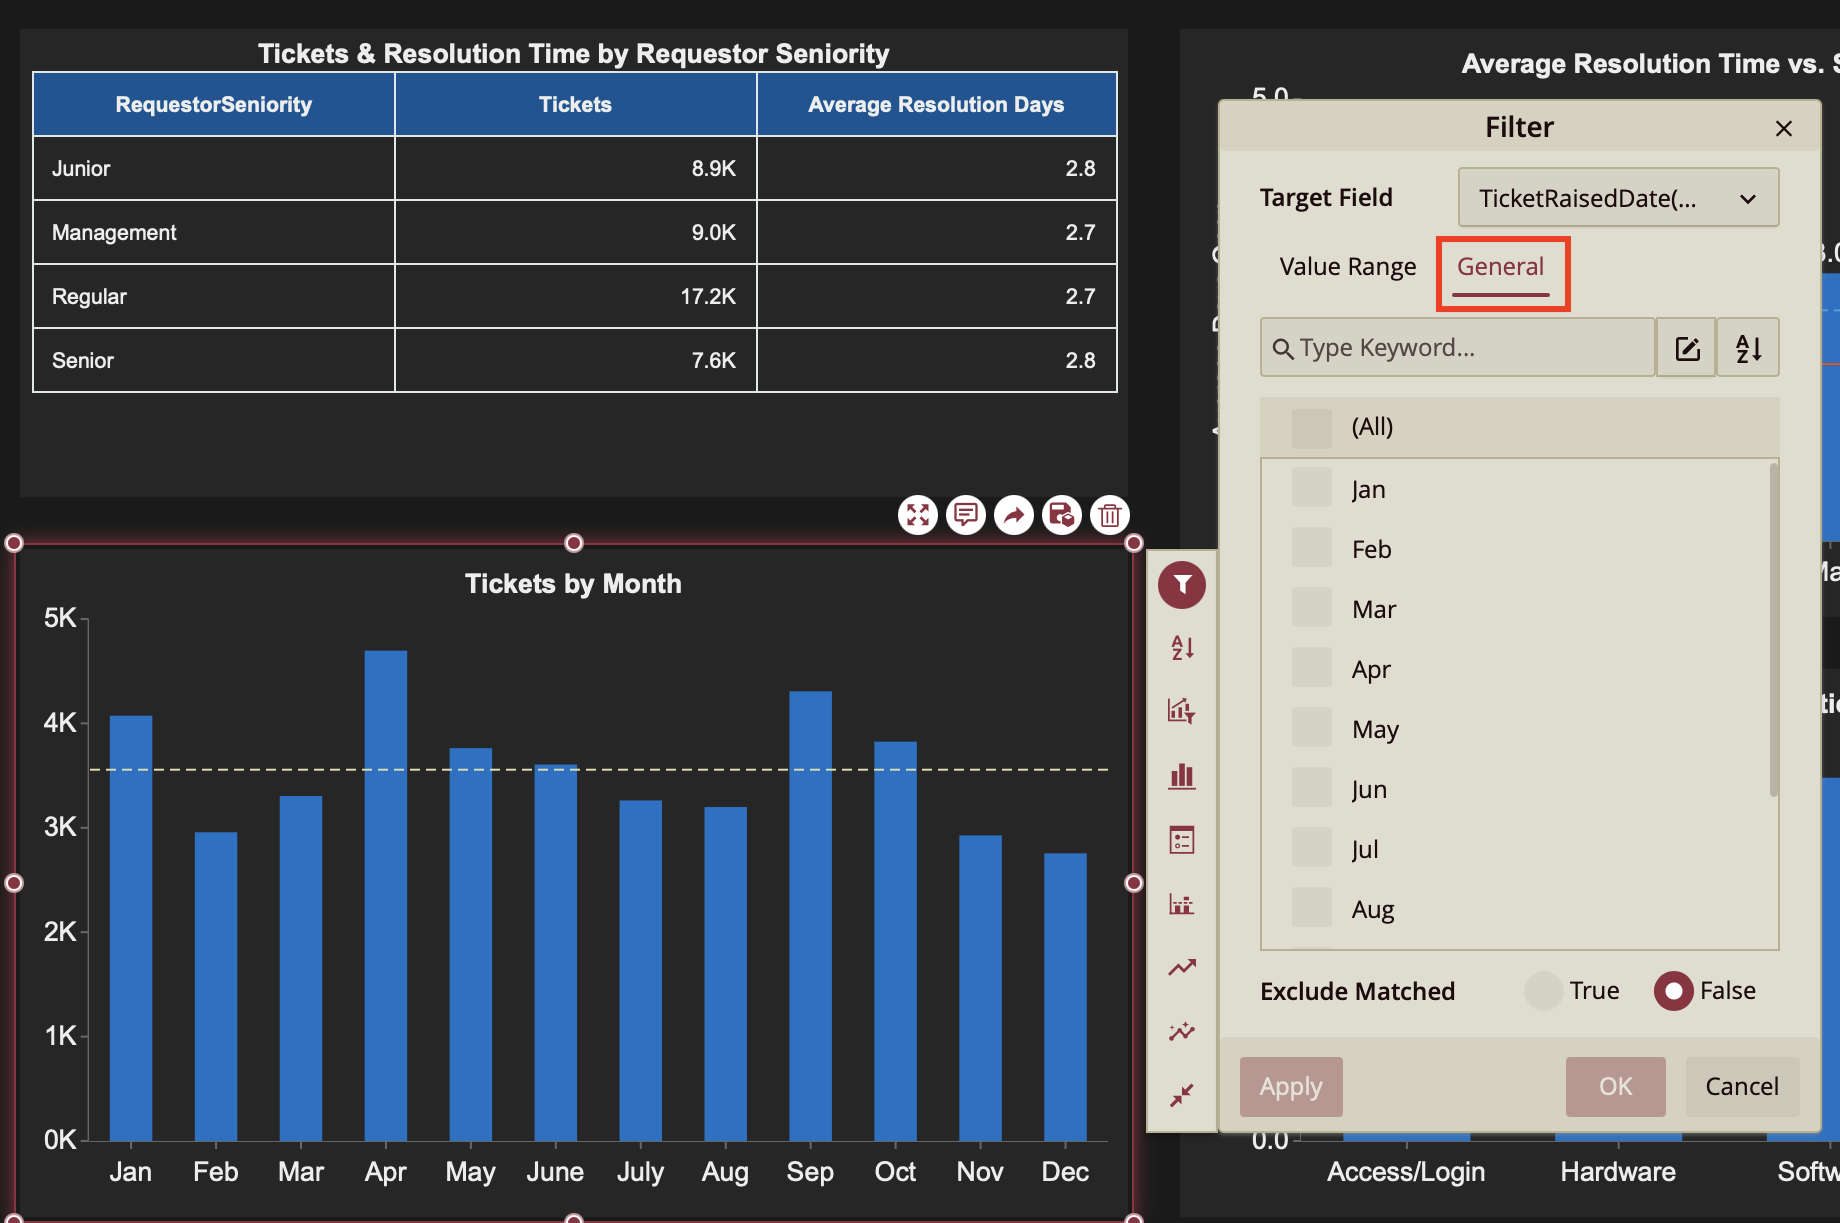
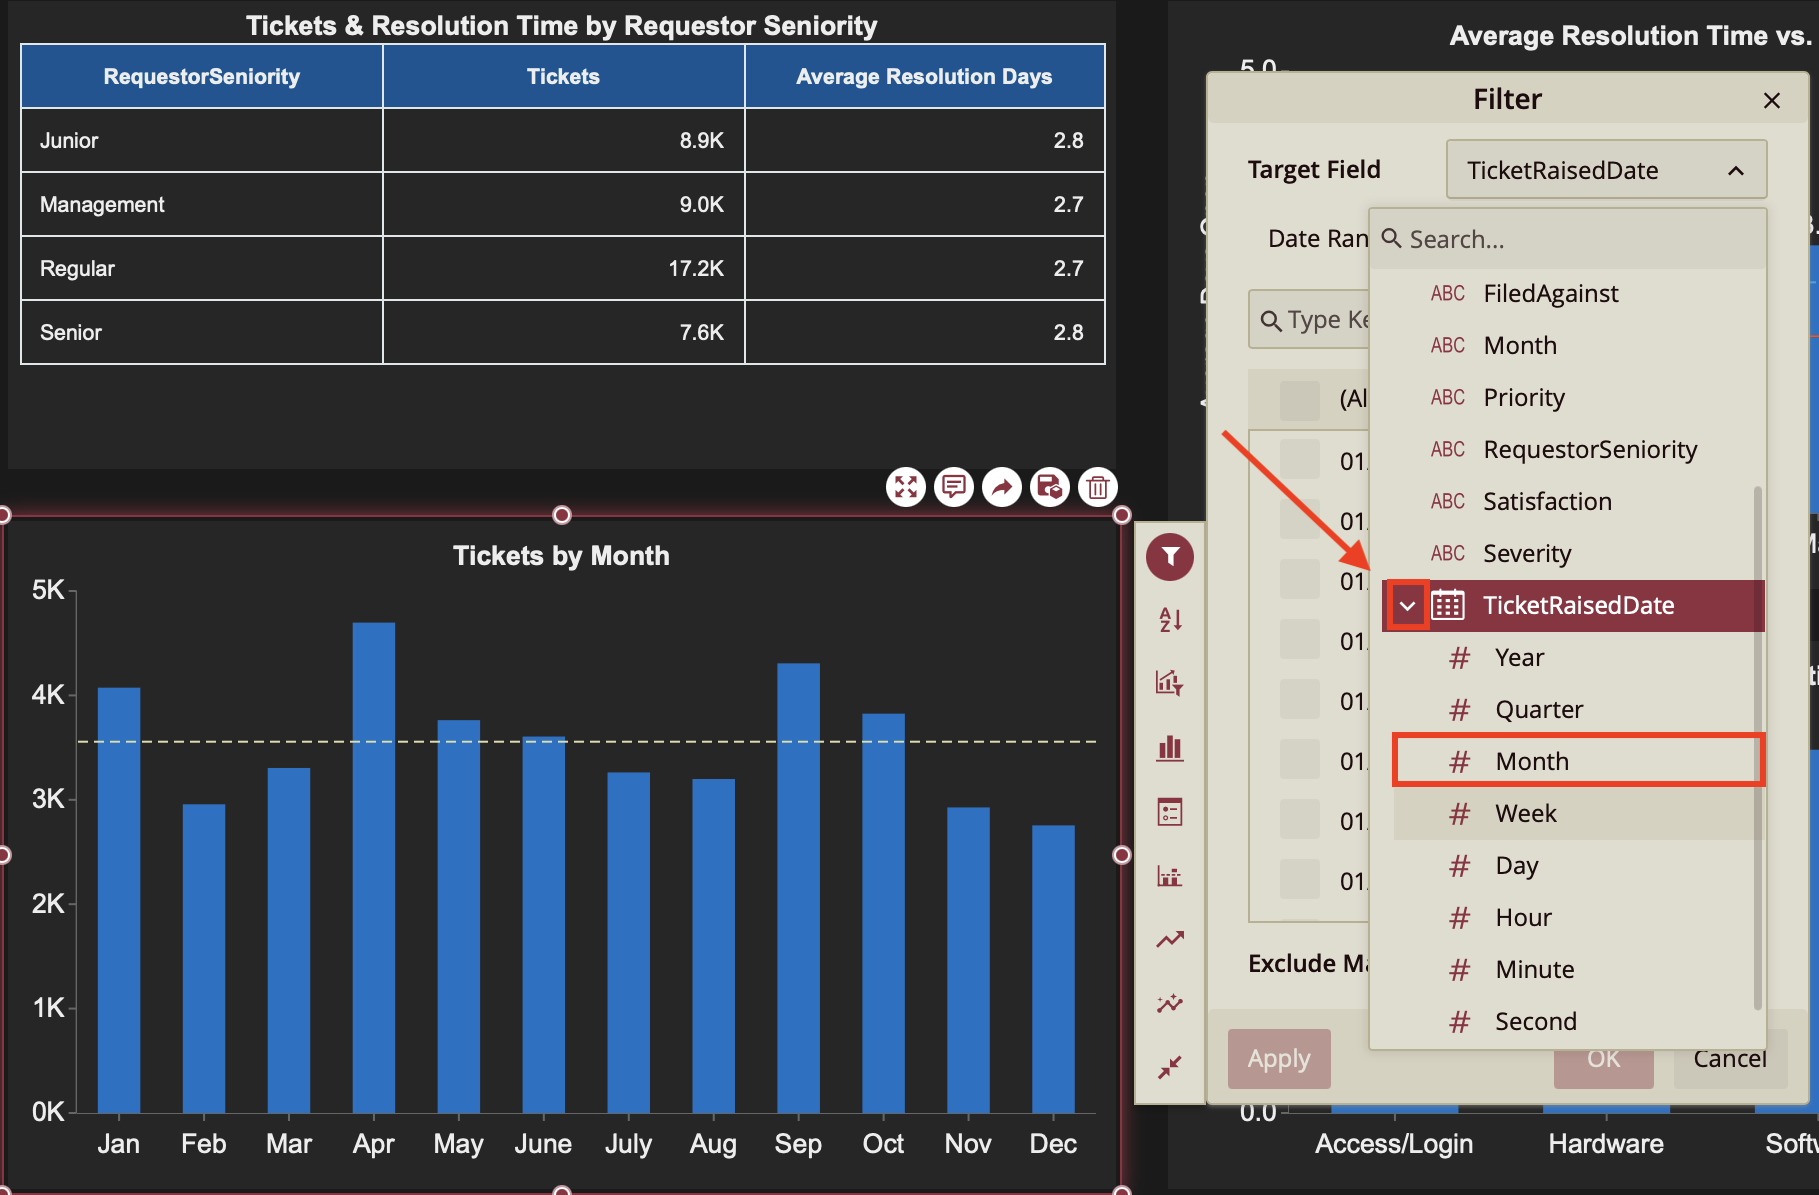
Set the Target Field to TicketRaisedDate. Click the > Button to open the dropdown menu for the time period you are interested in filter the dashboard by. In this case, that is Month.
Then, select the Month values as Jan, Feb, and Mar to see the data for only these months in the scenario.
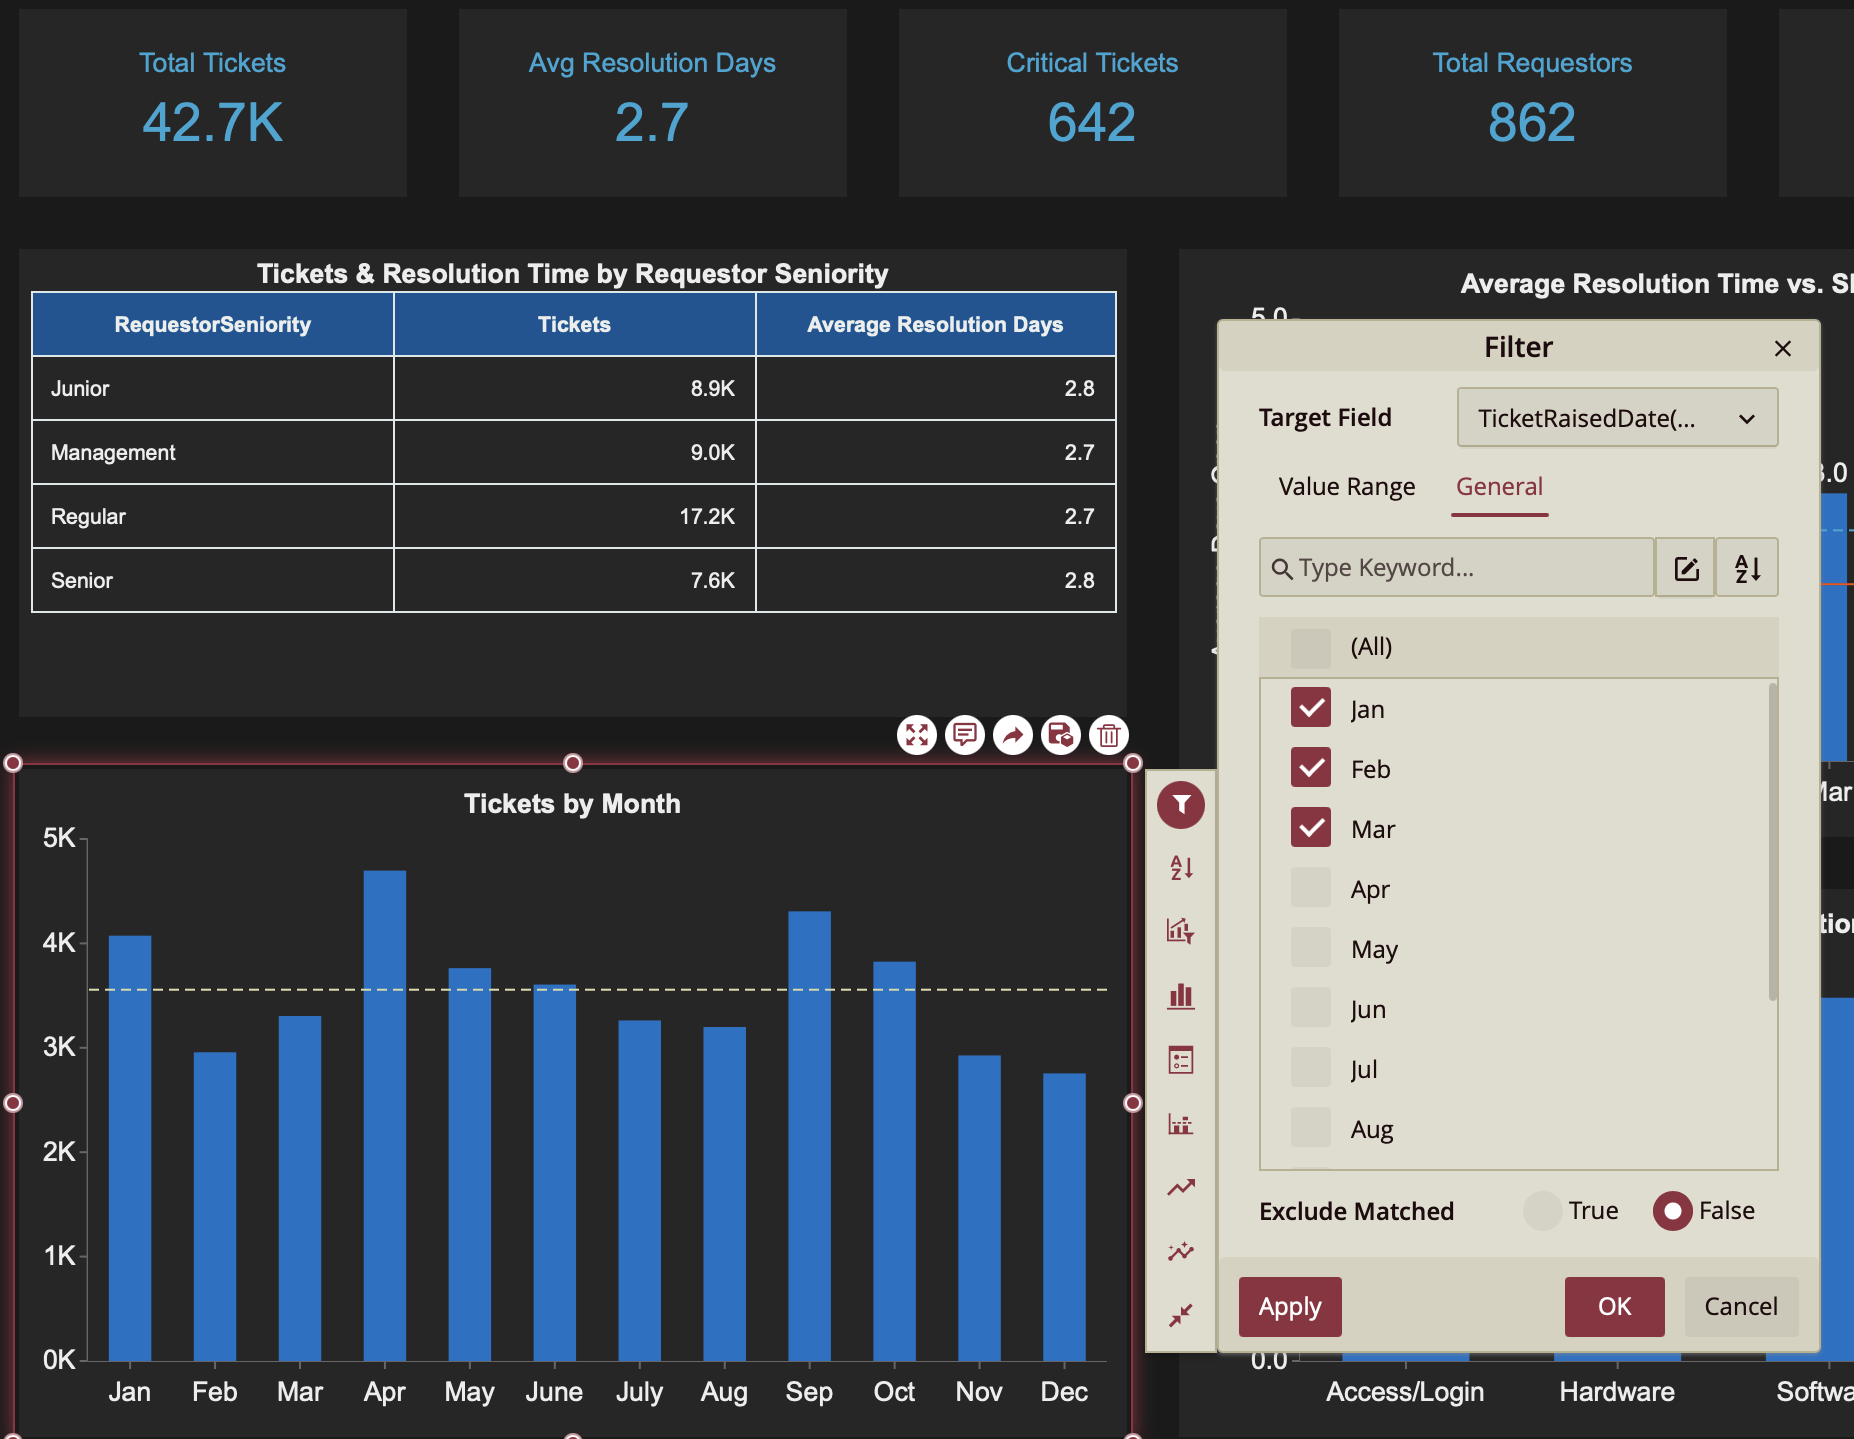
Keep Exclude Matched to 'False'.
Finally, click the Apply button and then the OK button to save the changes made.
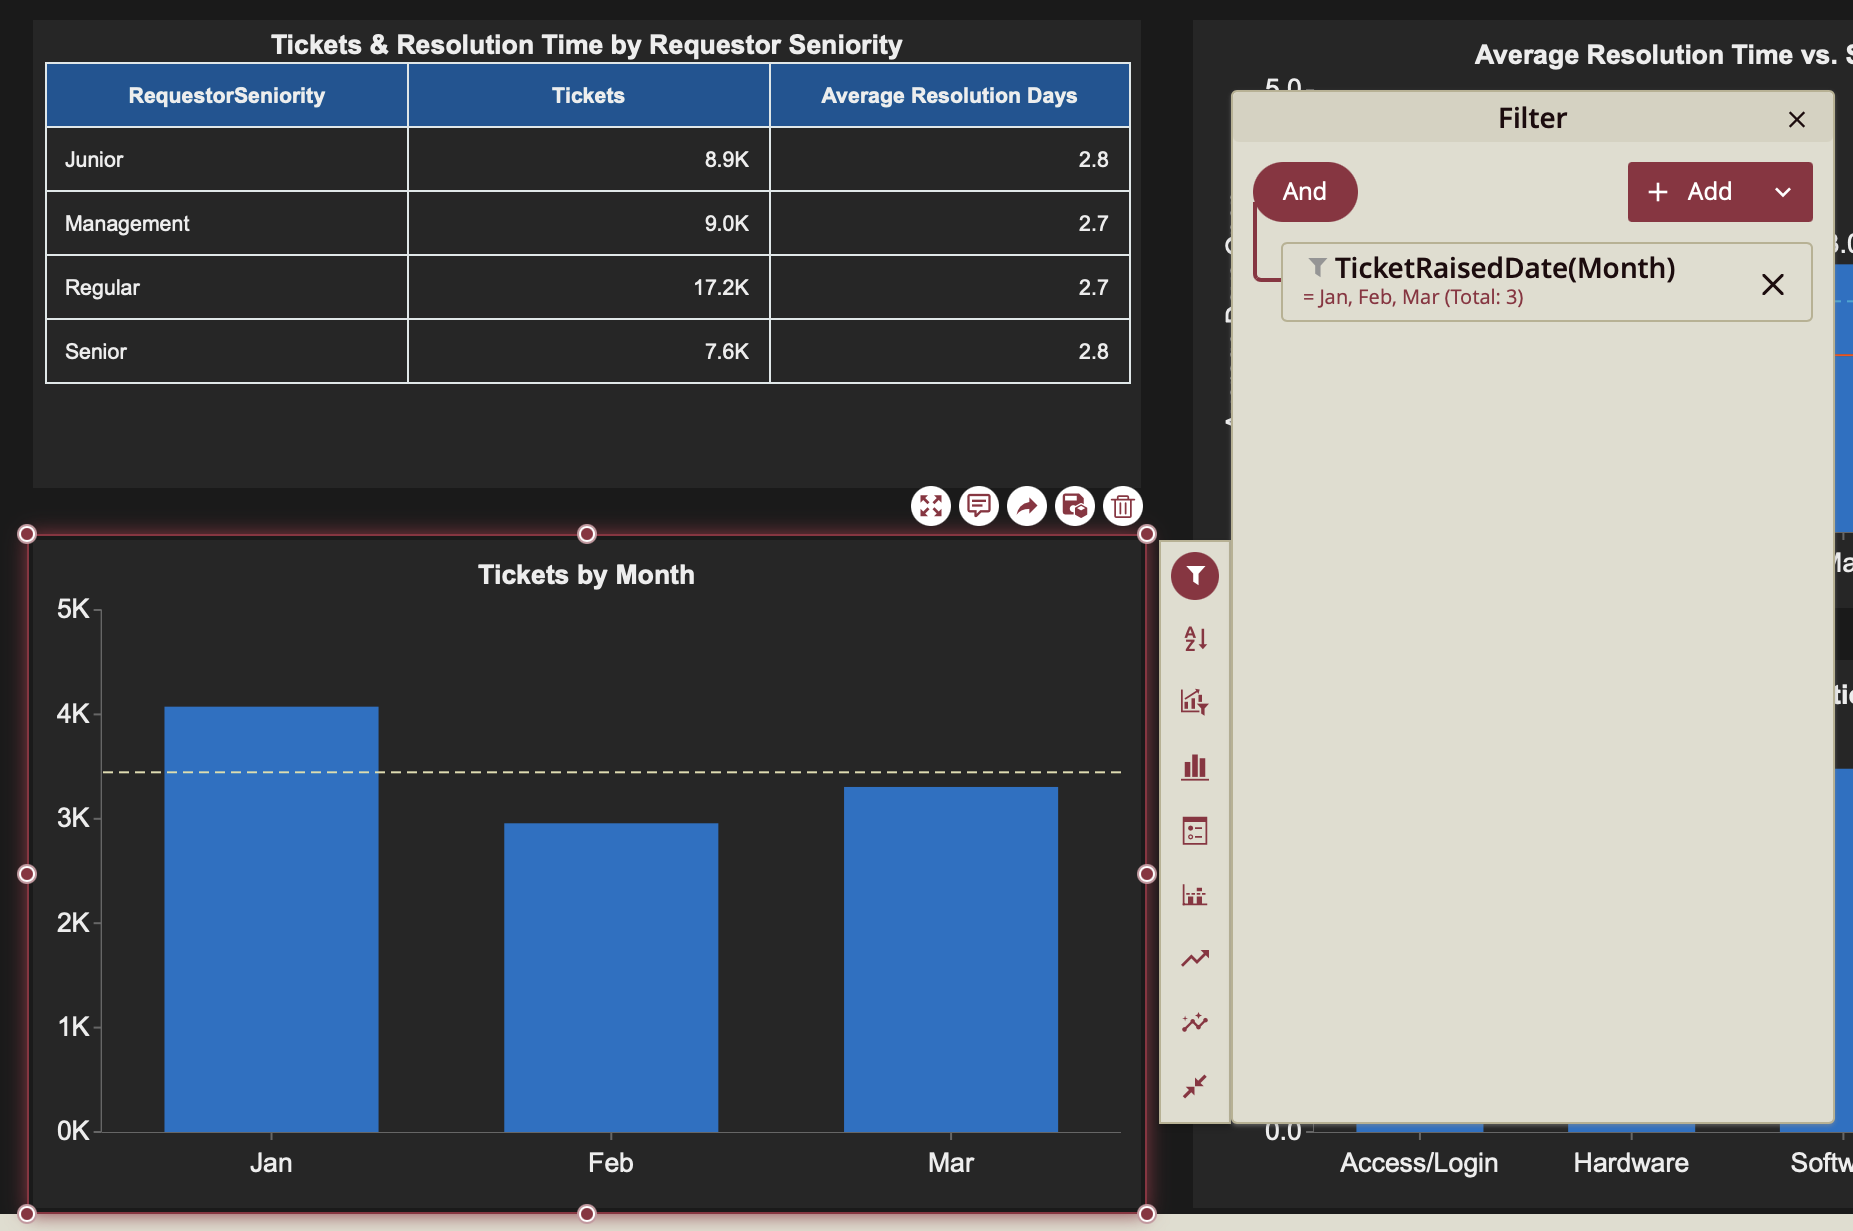
You can now view the result.
Add a Filter Group
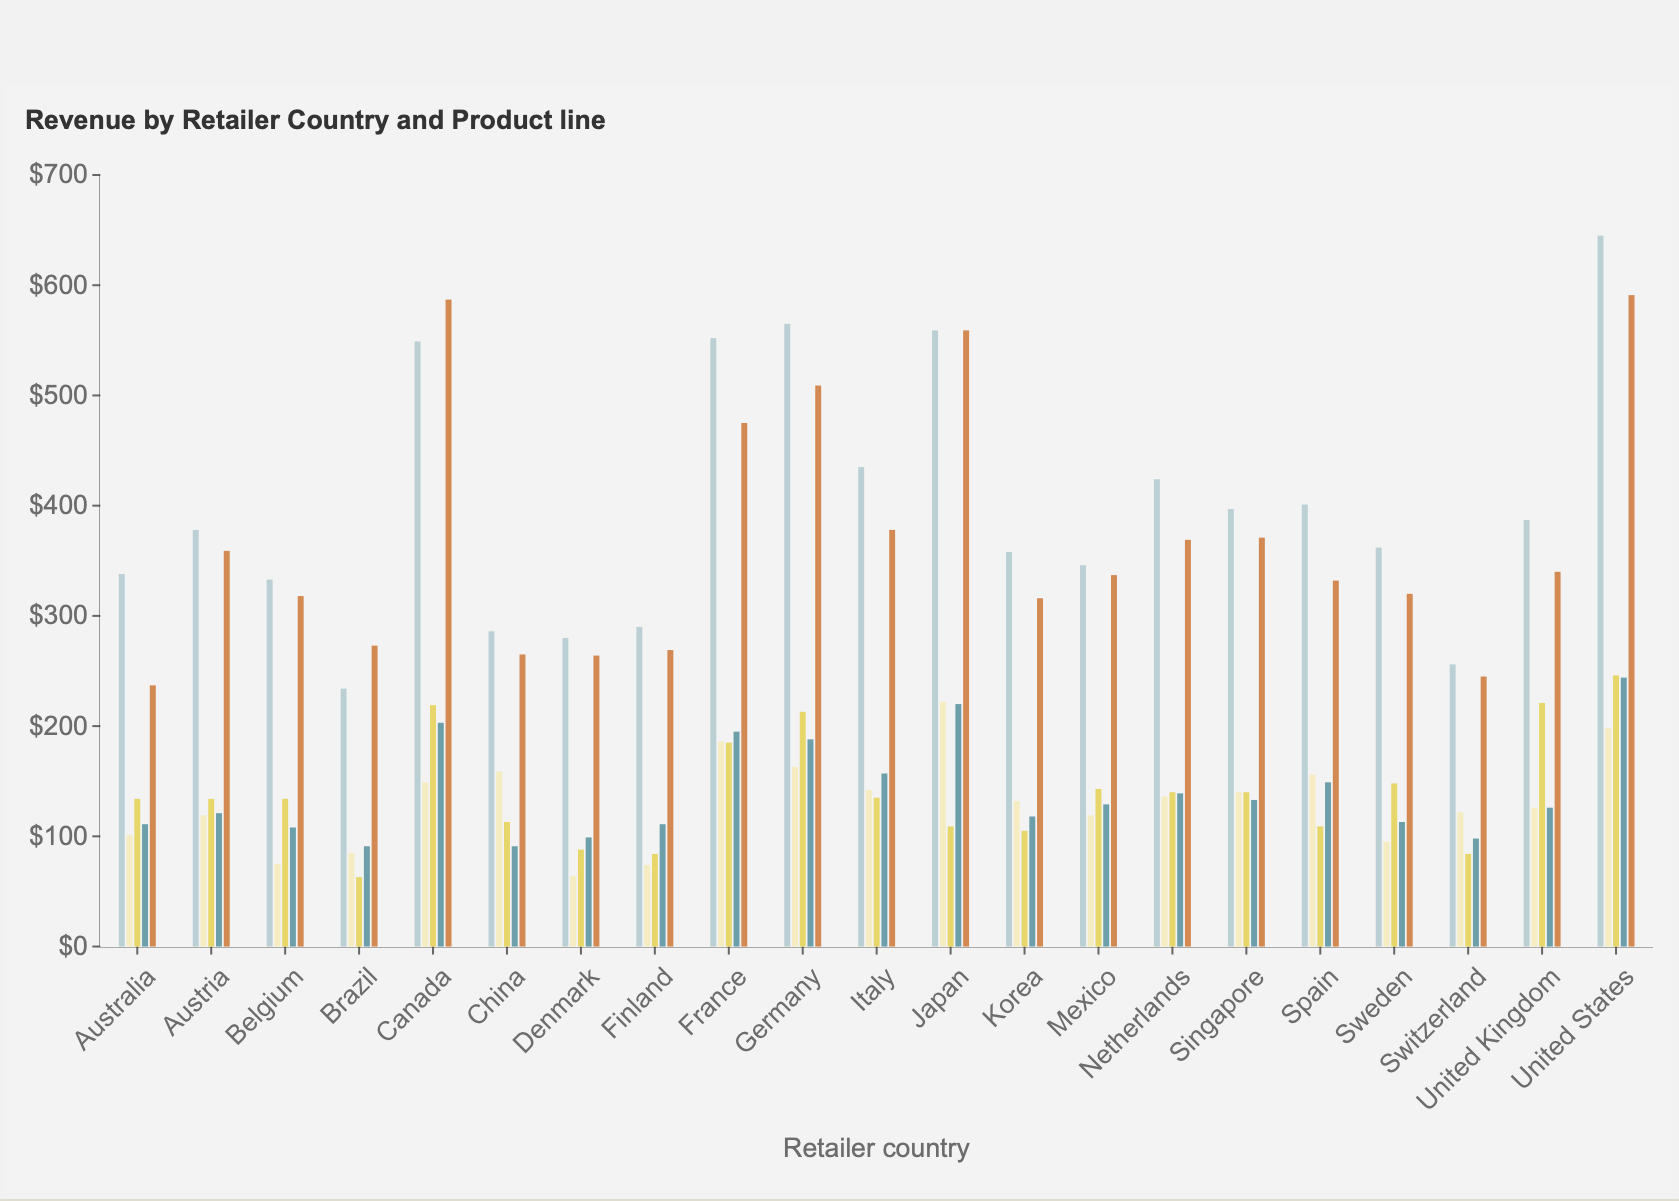
A filter group allows you to filter a dashboard using multiple values. In this scenario, a dashboard that displays the revenue by retailer country and product line, will be filtered by both product line and retailer country. Wyn Dashboards allows you to nest multiple filter conditions and group them using the AND or OR operator. The dashboard below was created using the RetailDataset. To start, simply create a column chart in the Visualization Wizard, using these three values: Revenue, Product Line, Retailer Country.
Note: You can add a filter group on the dashboard scenarios using the Actions Bar, but you cannot add a filter group on data attributes through the Settings icon in the Data Binding panel.
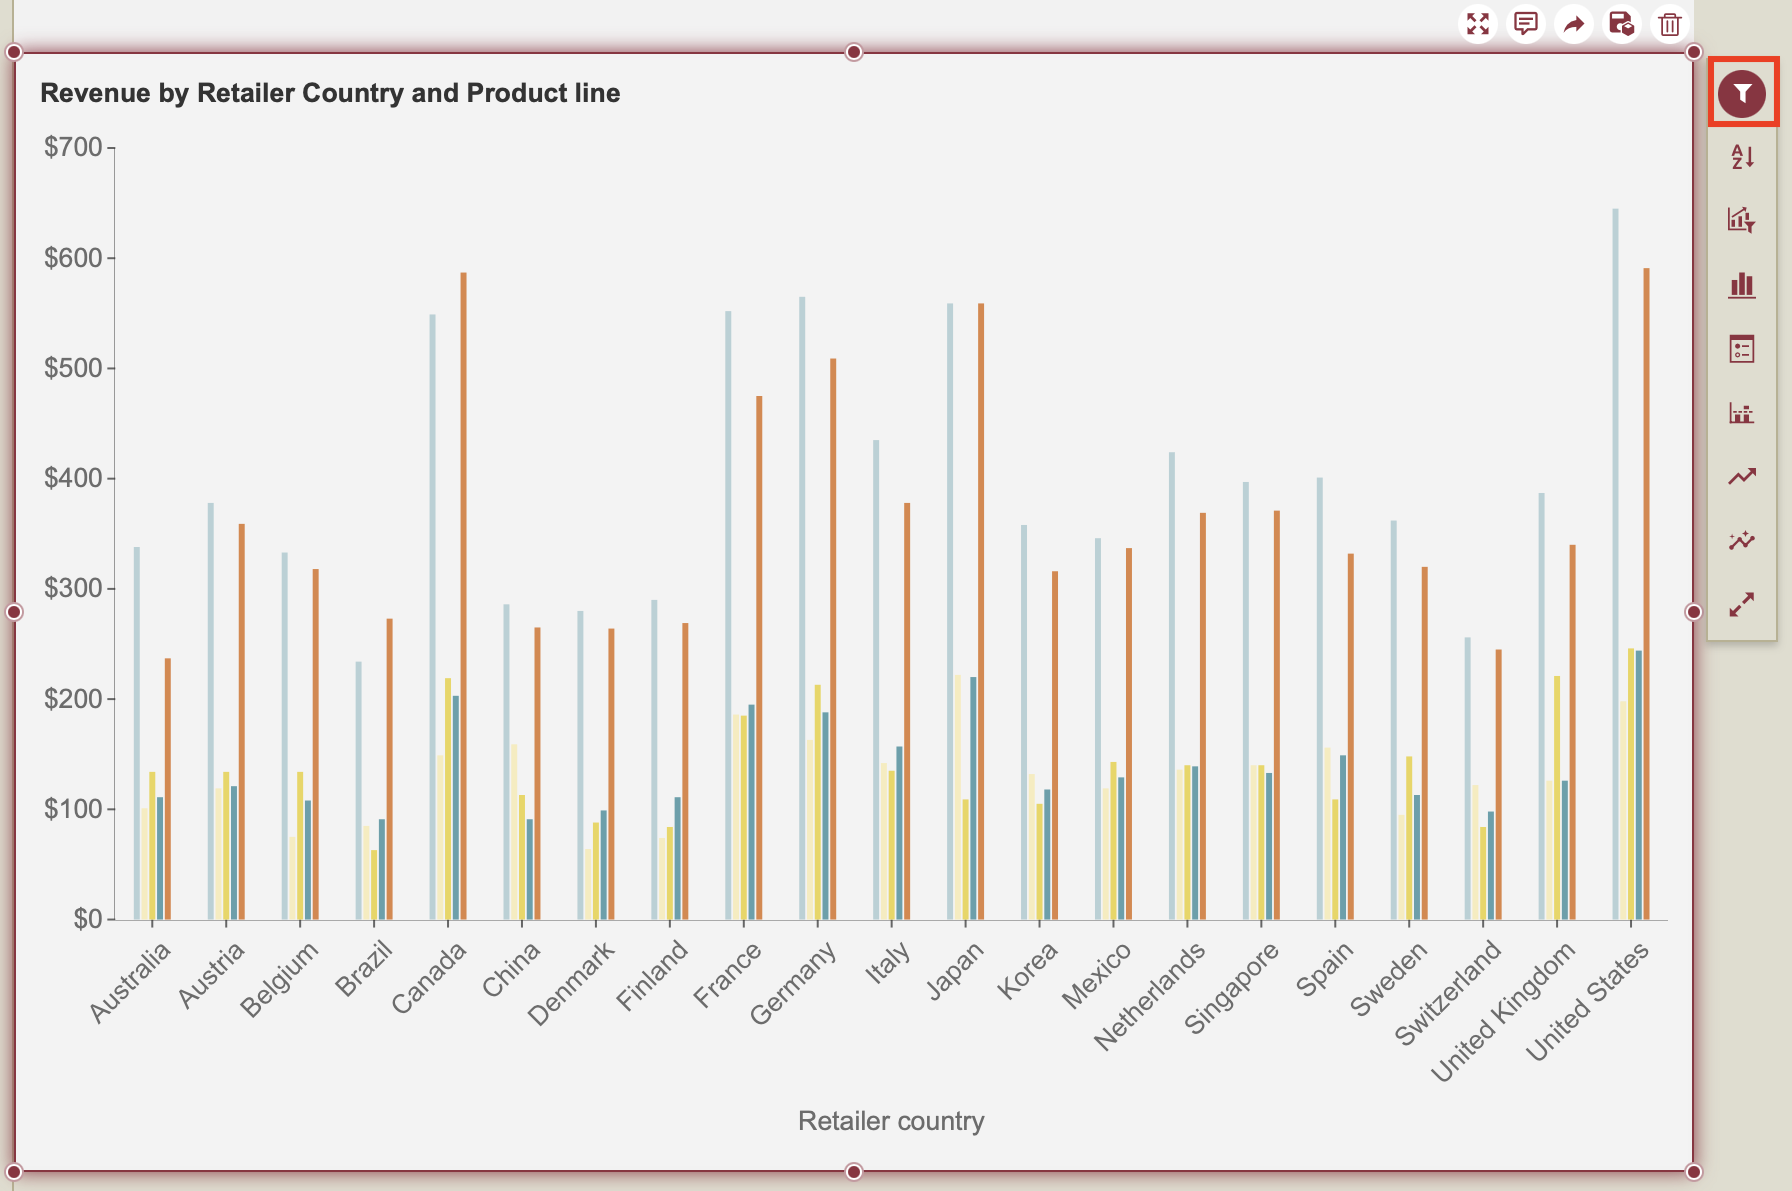
Select the dashboard you have just created using the aforementioned values. Note that an Action Bar automatically appears on the right of the selected scenario.
From the Action Bar, click on the Filter action
.
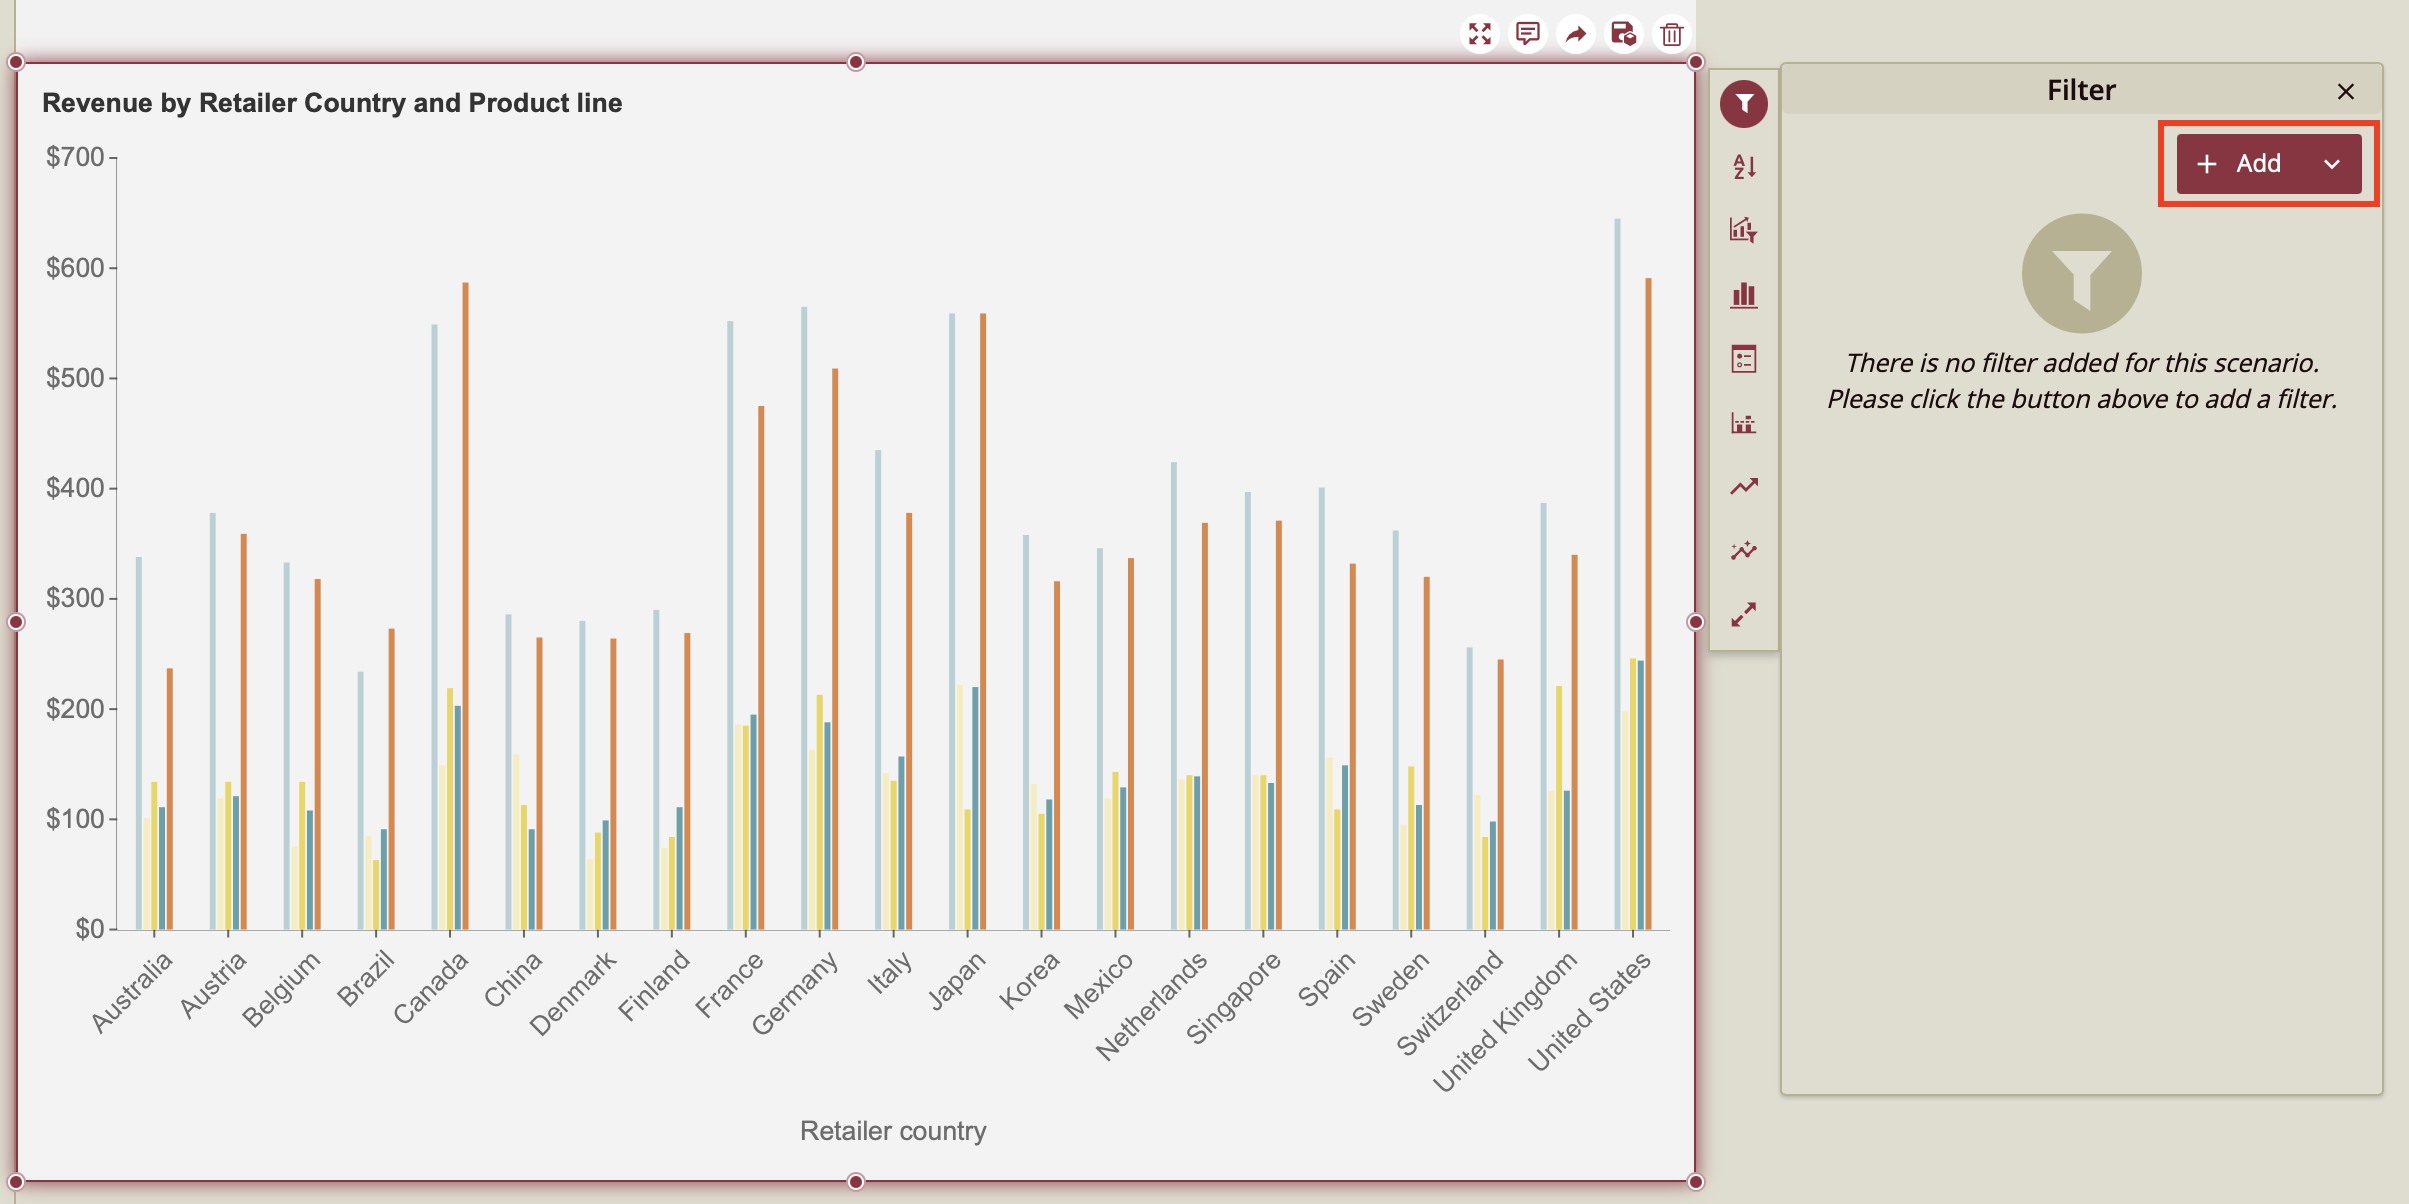
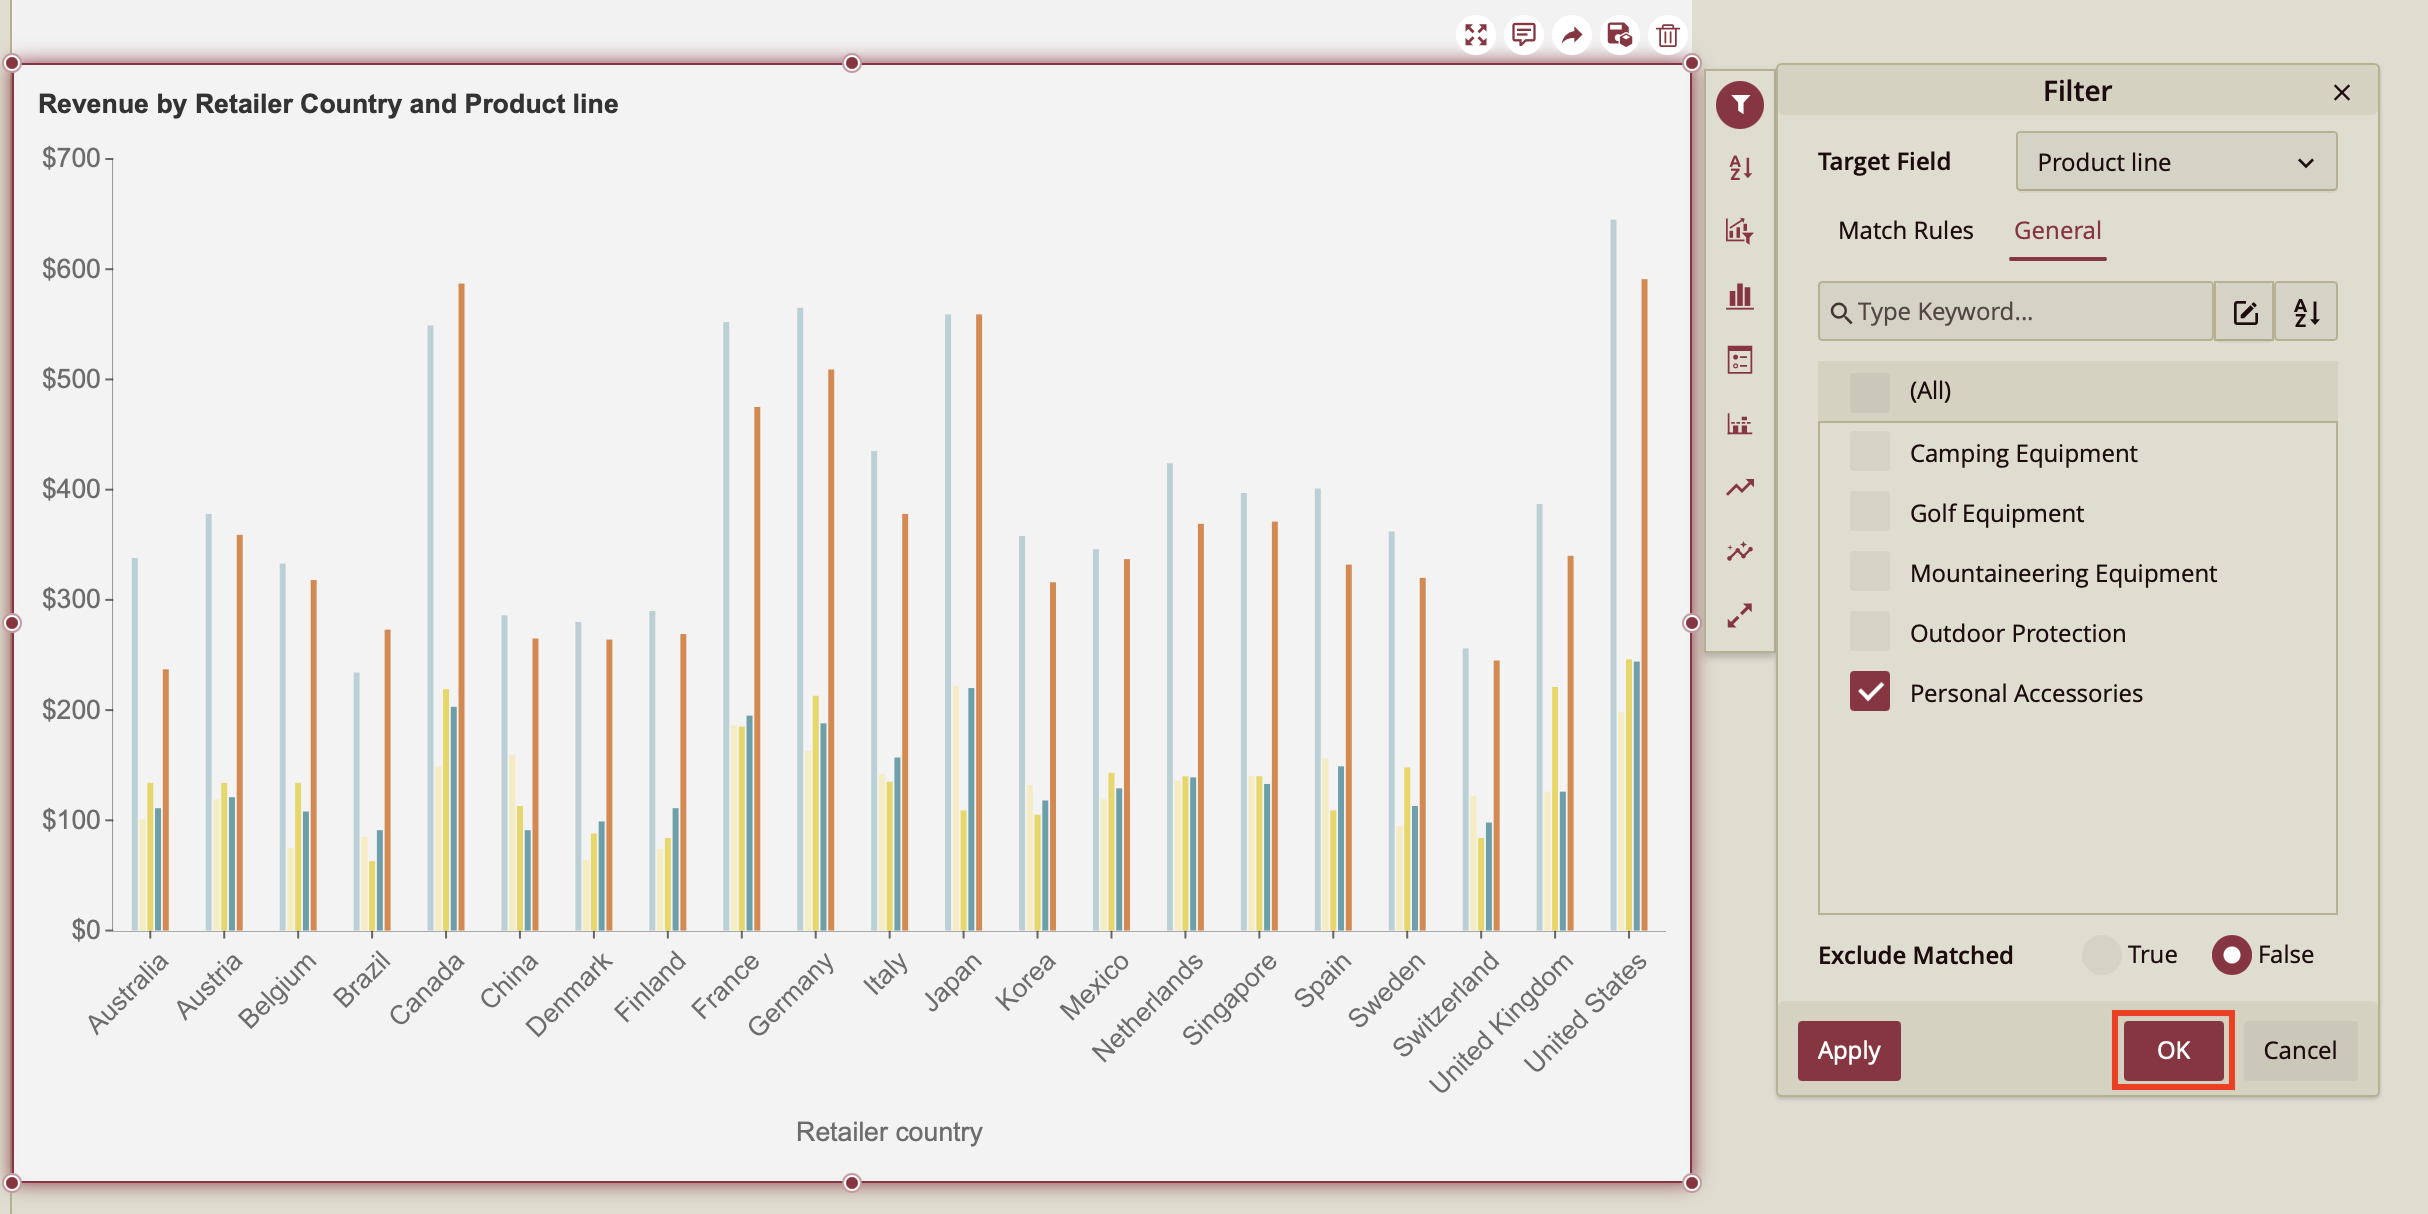
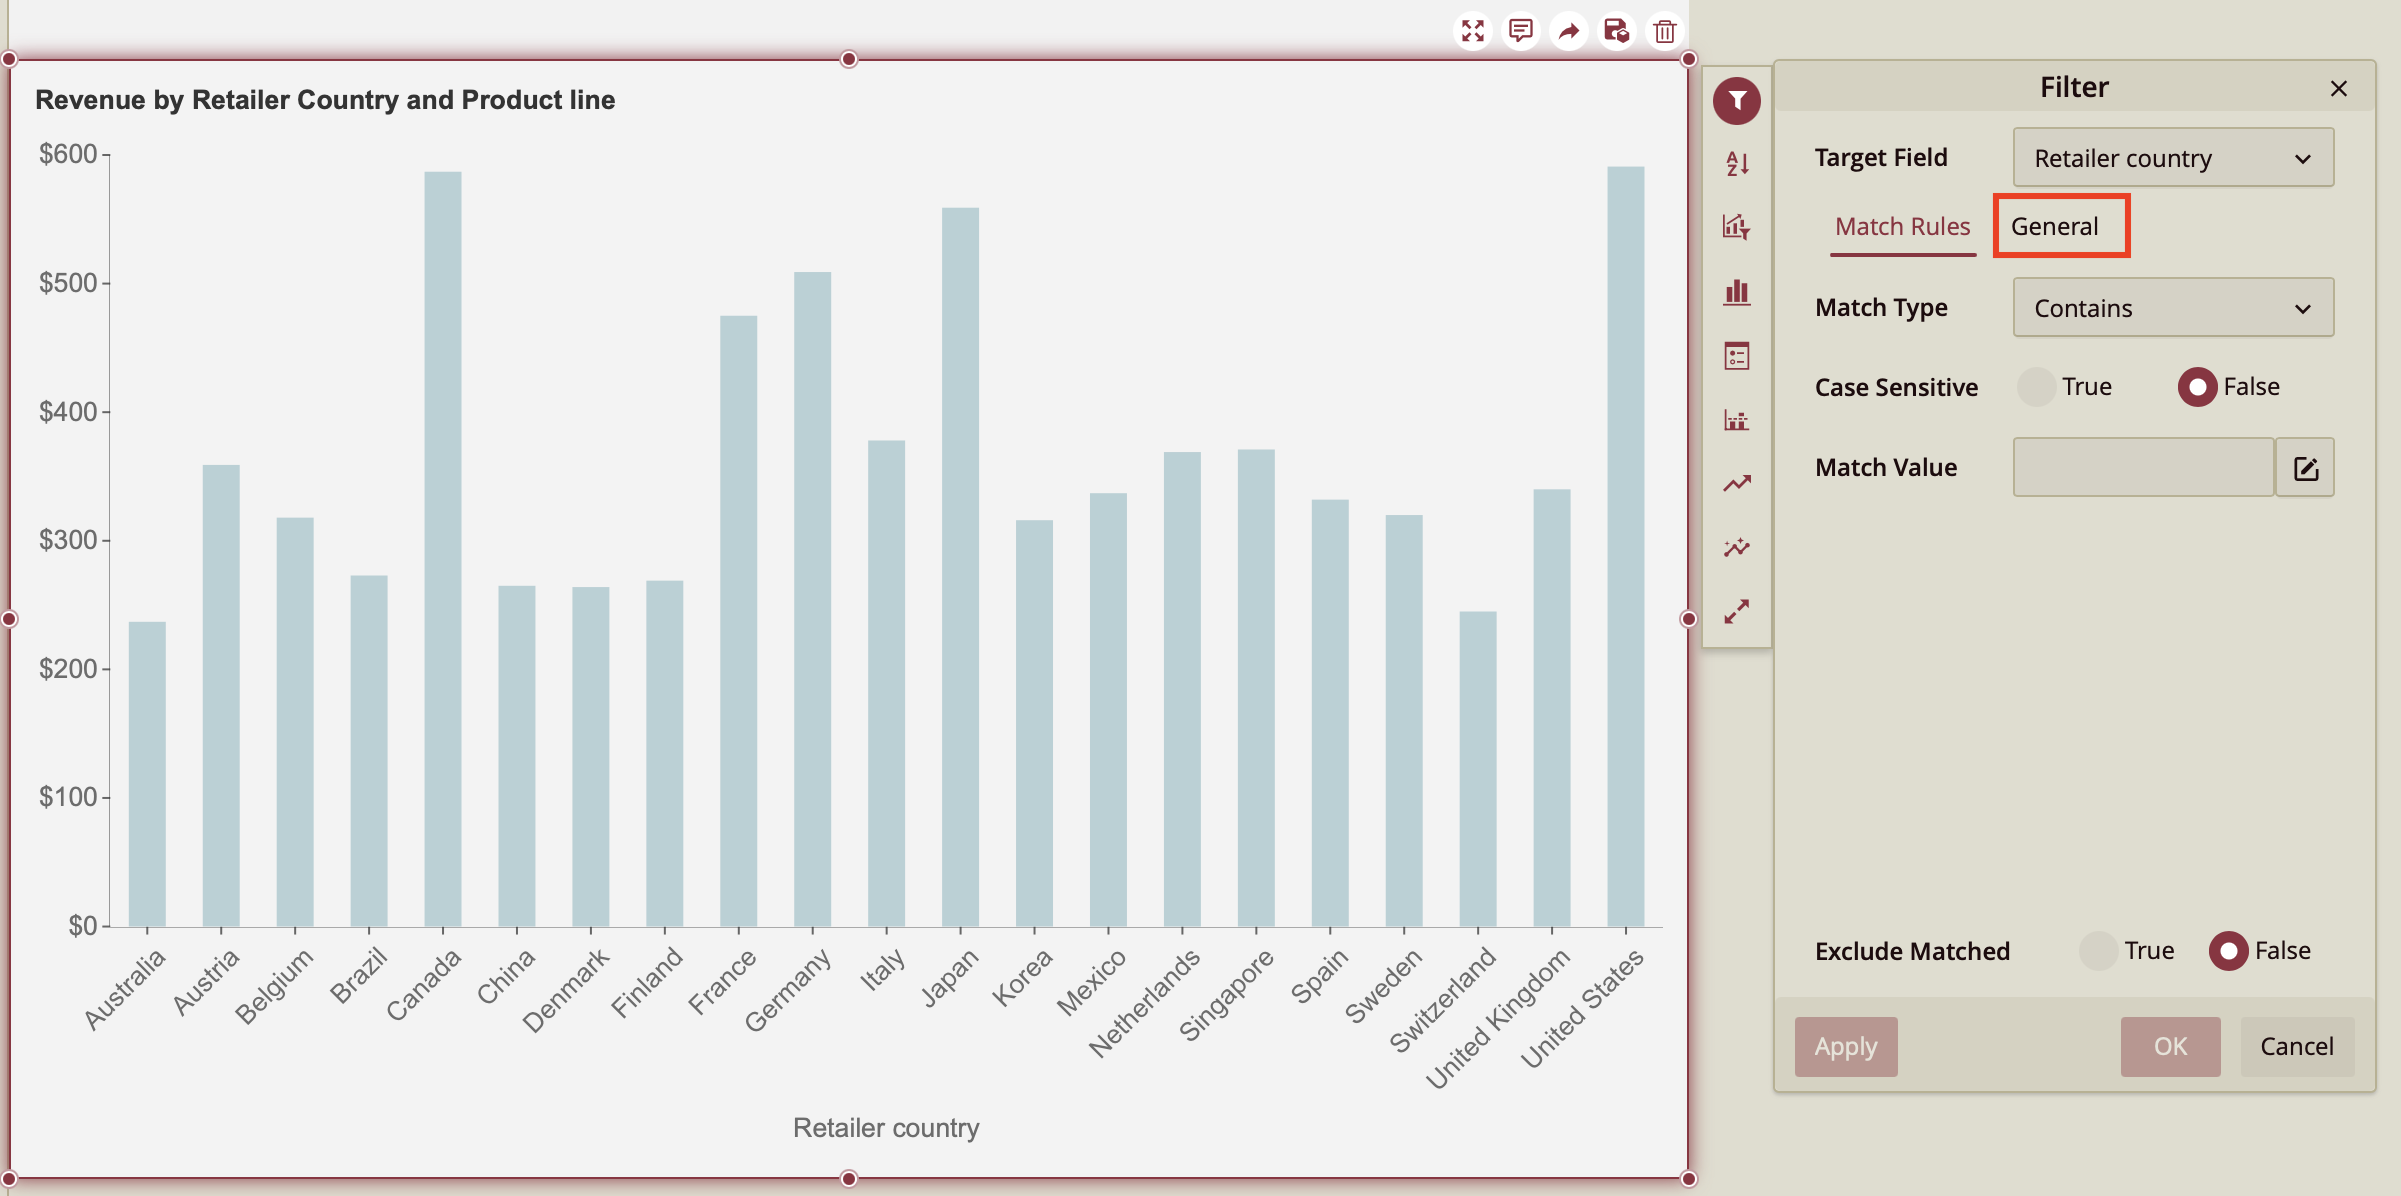
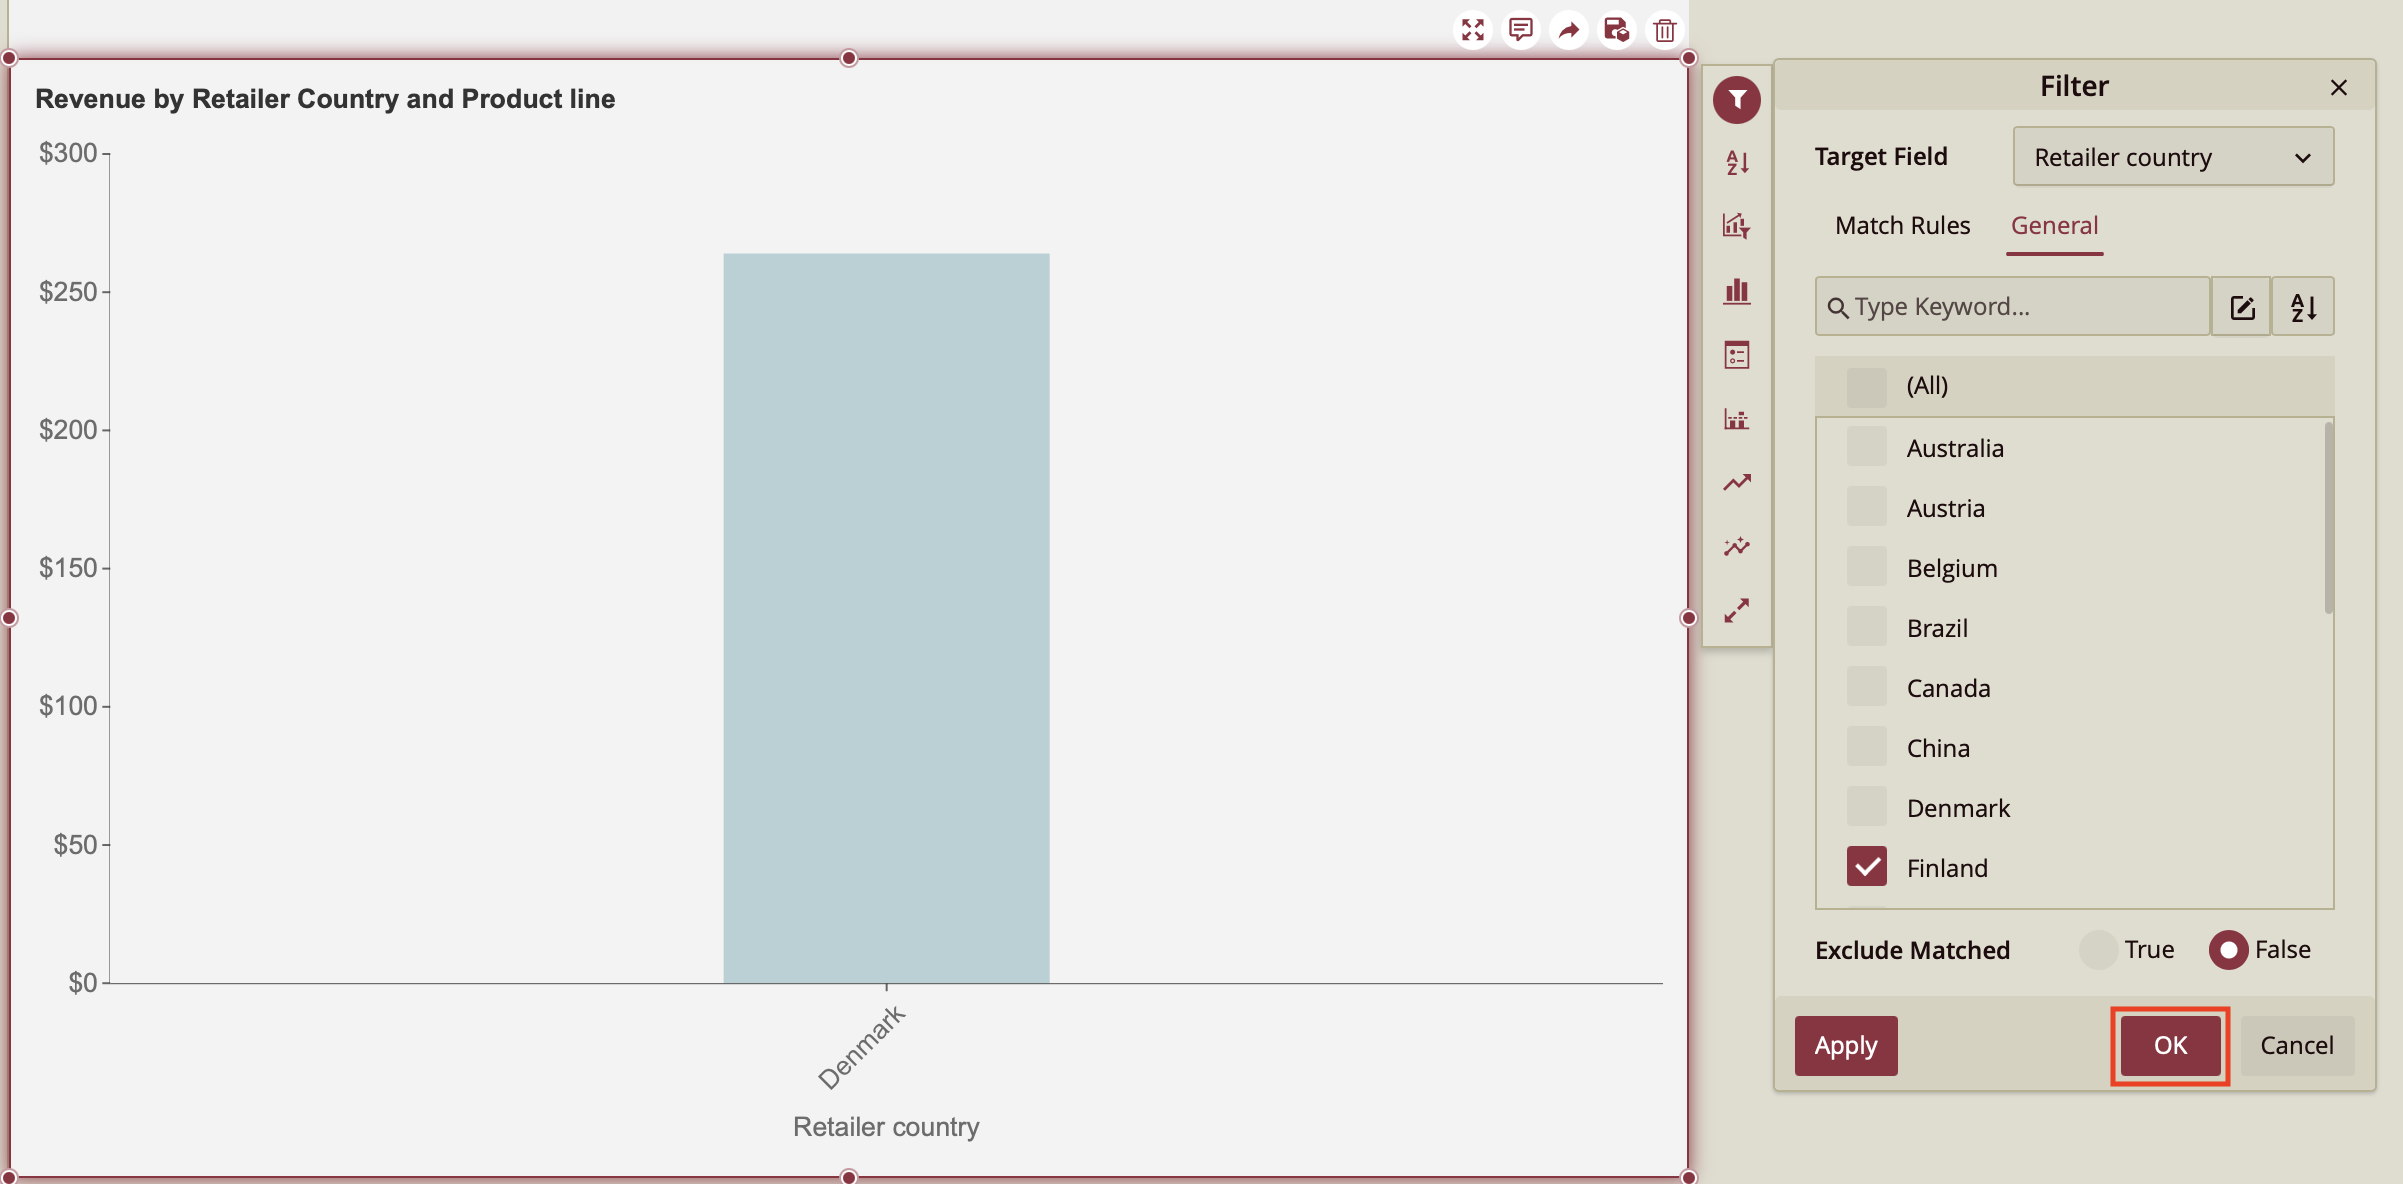
In the Filter dialog that appears, click the + Add button.
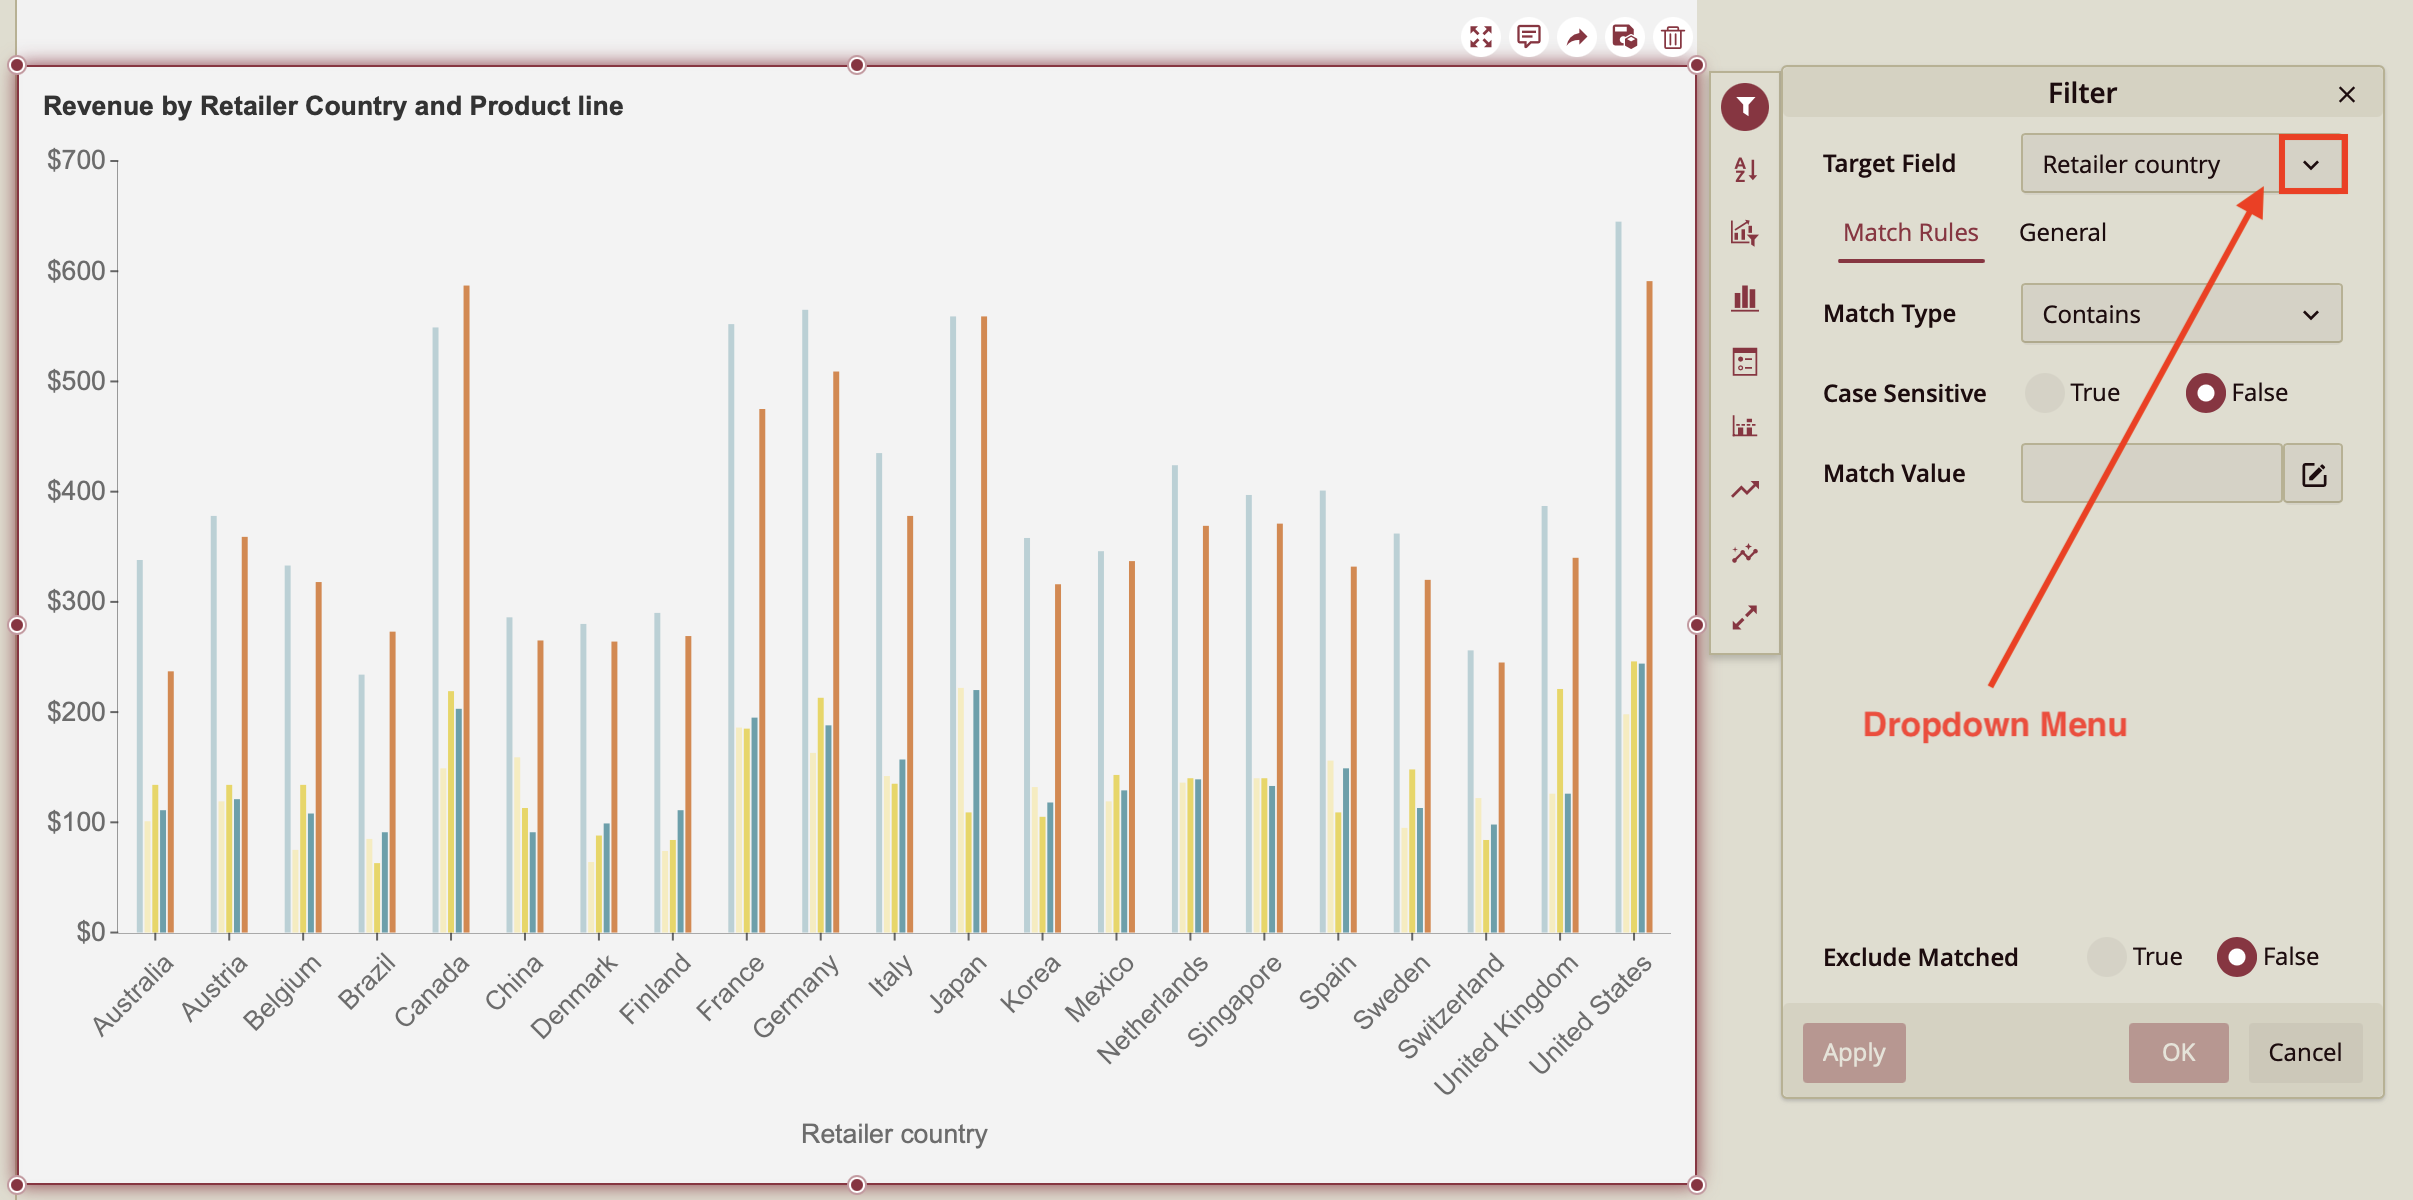
4. Click the side button to open the dropdown menu.
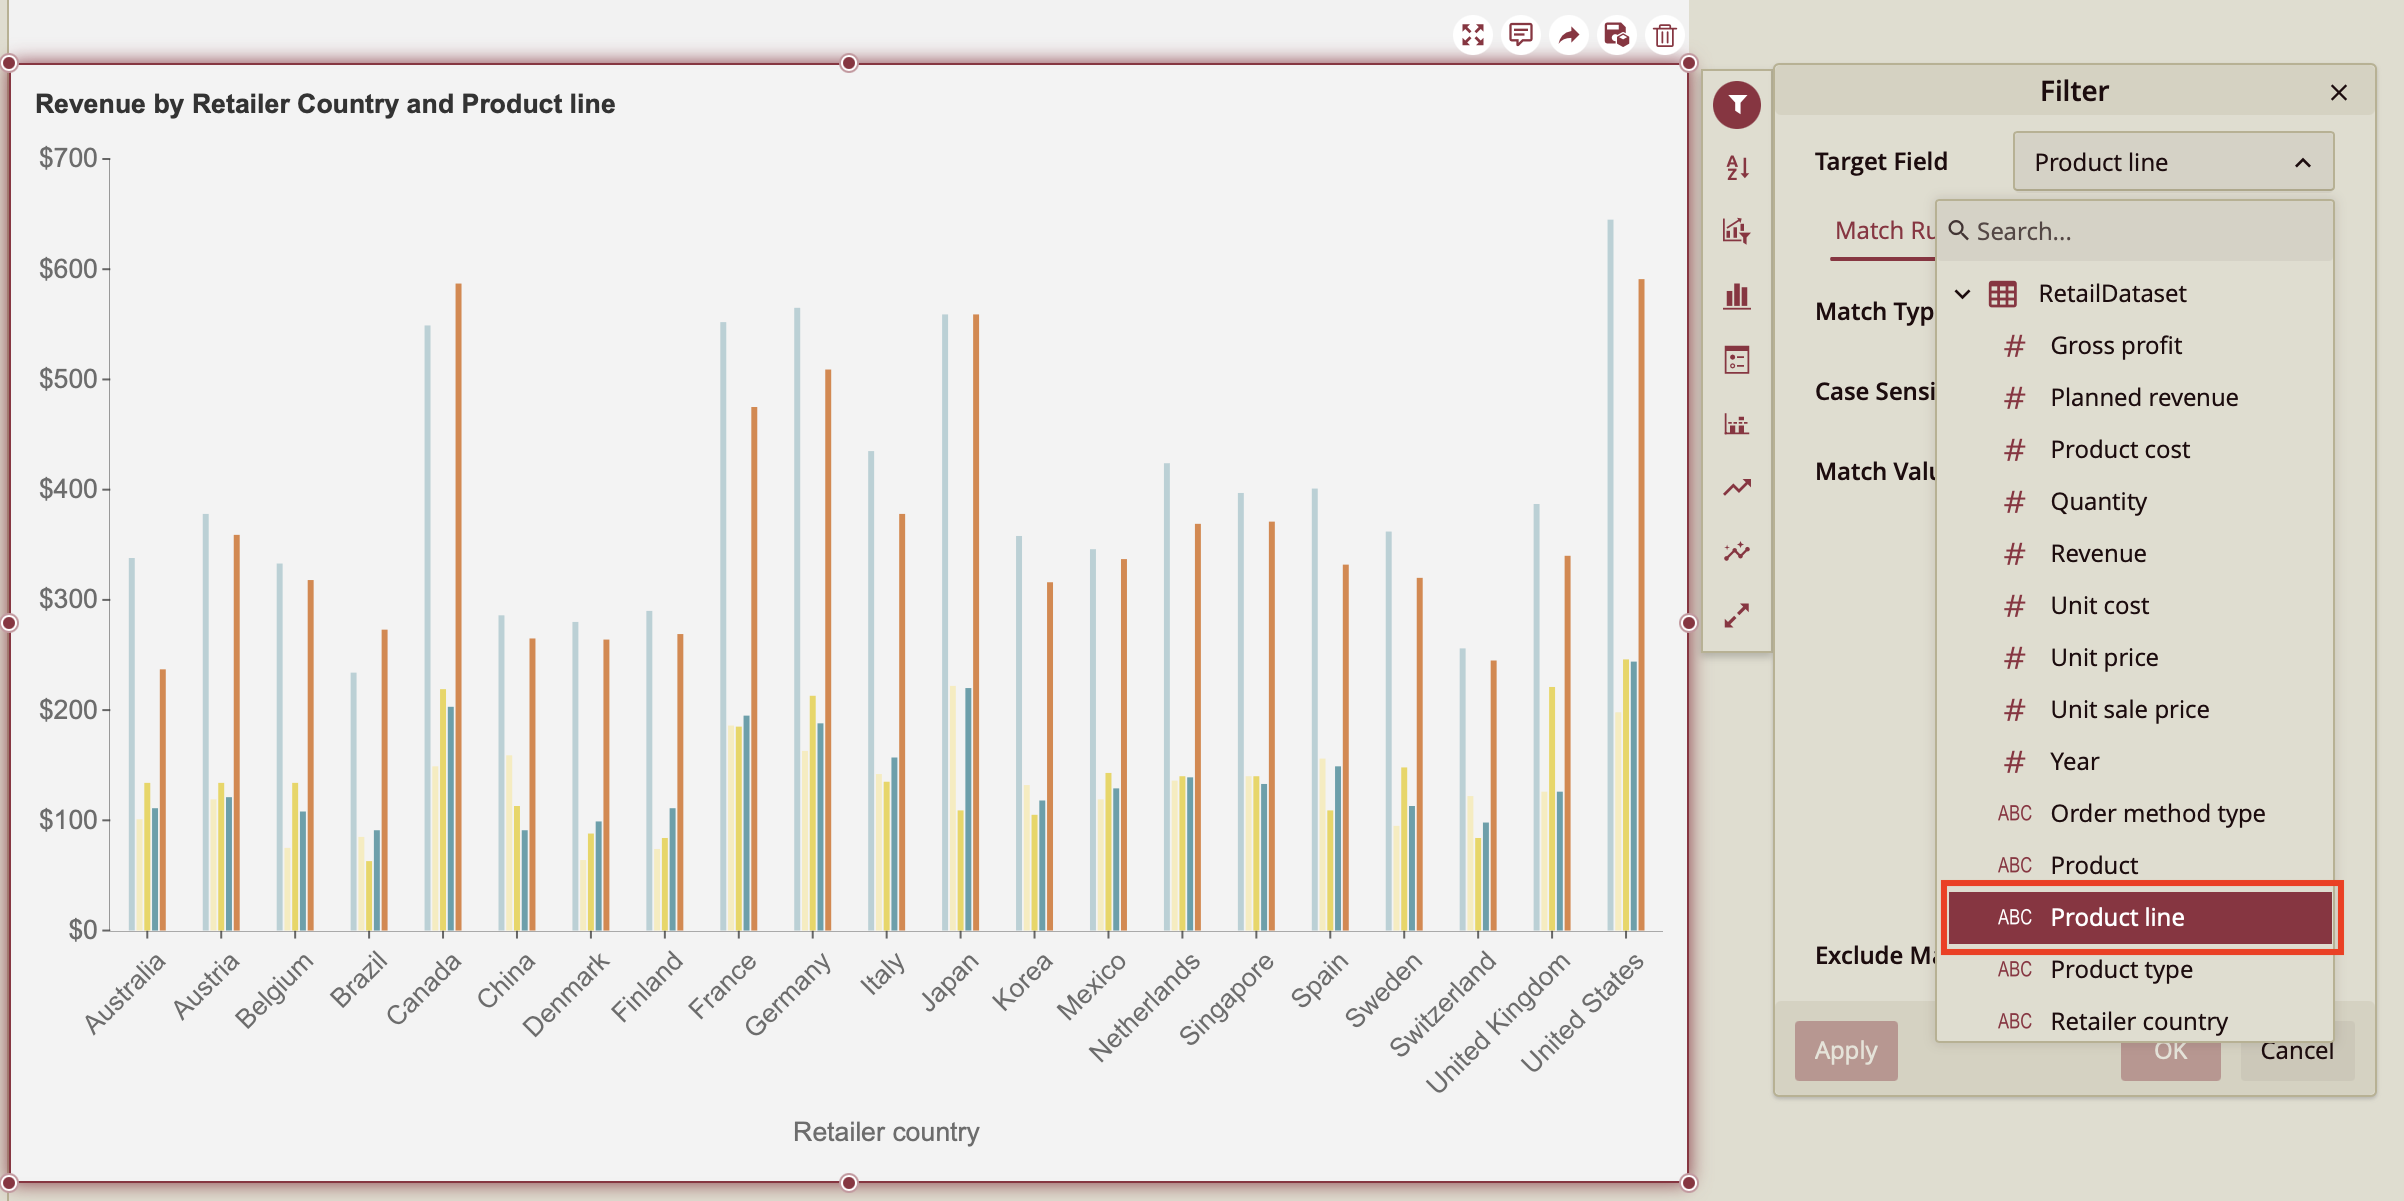
5. Select Product Line.
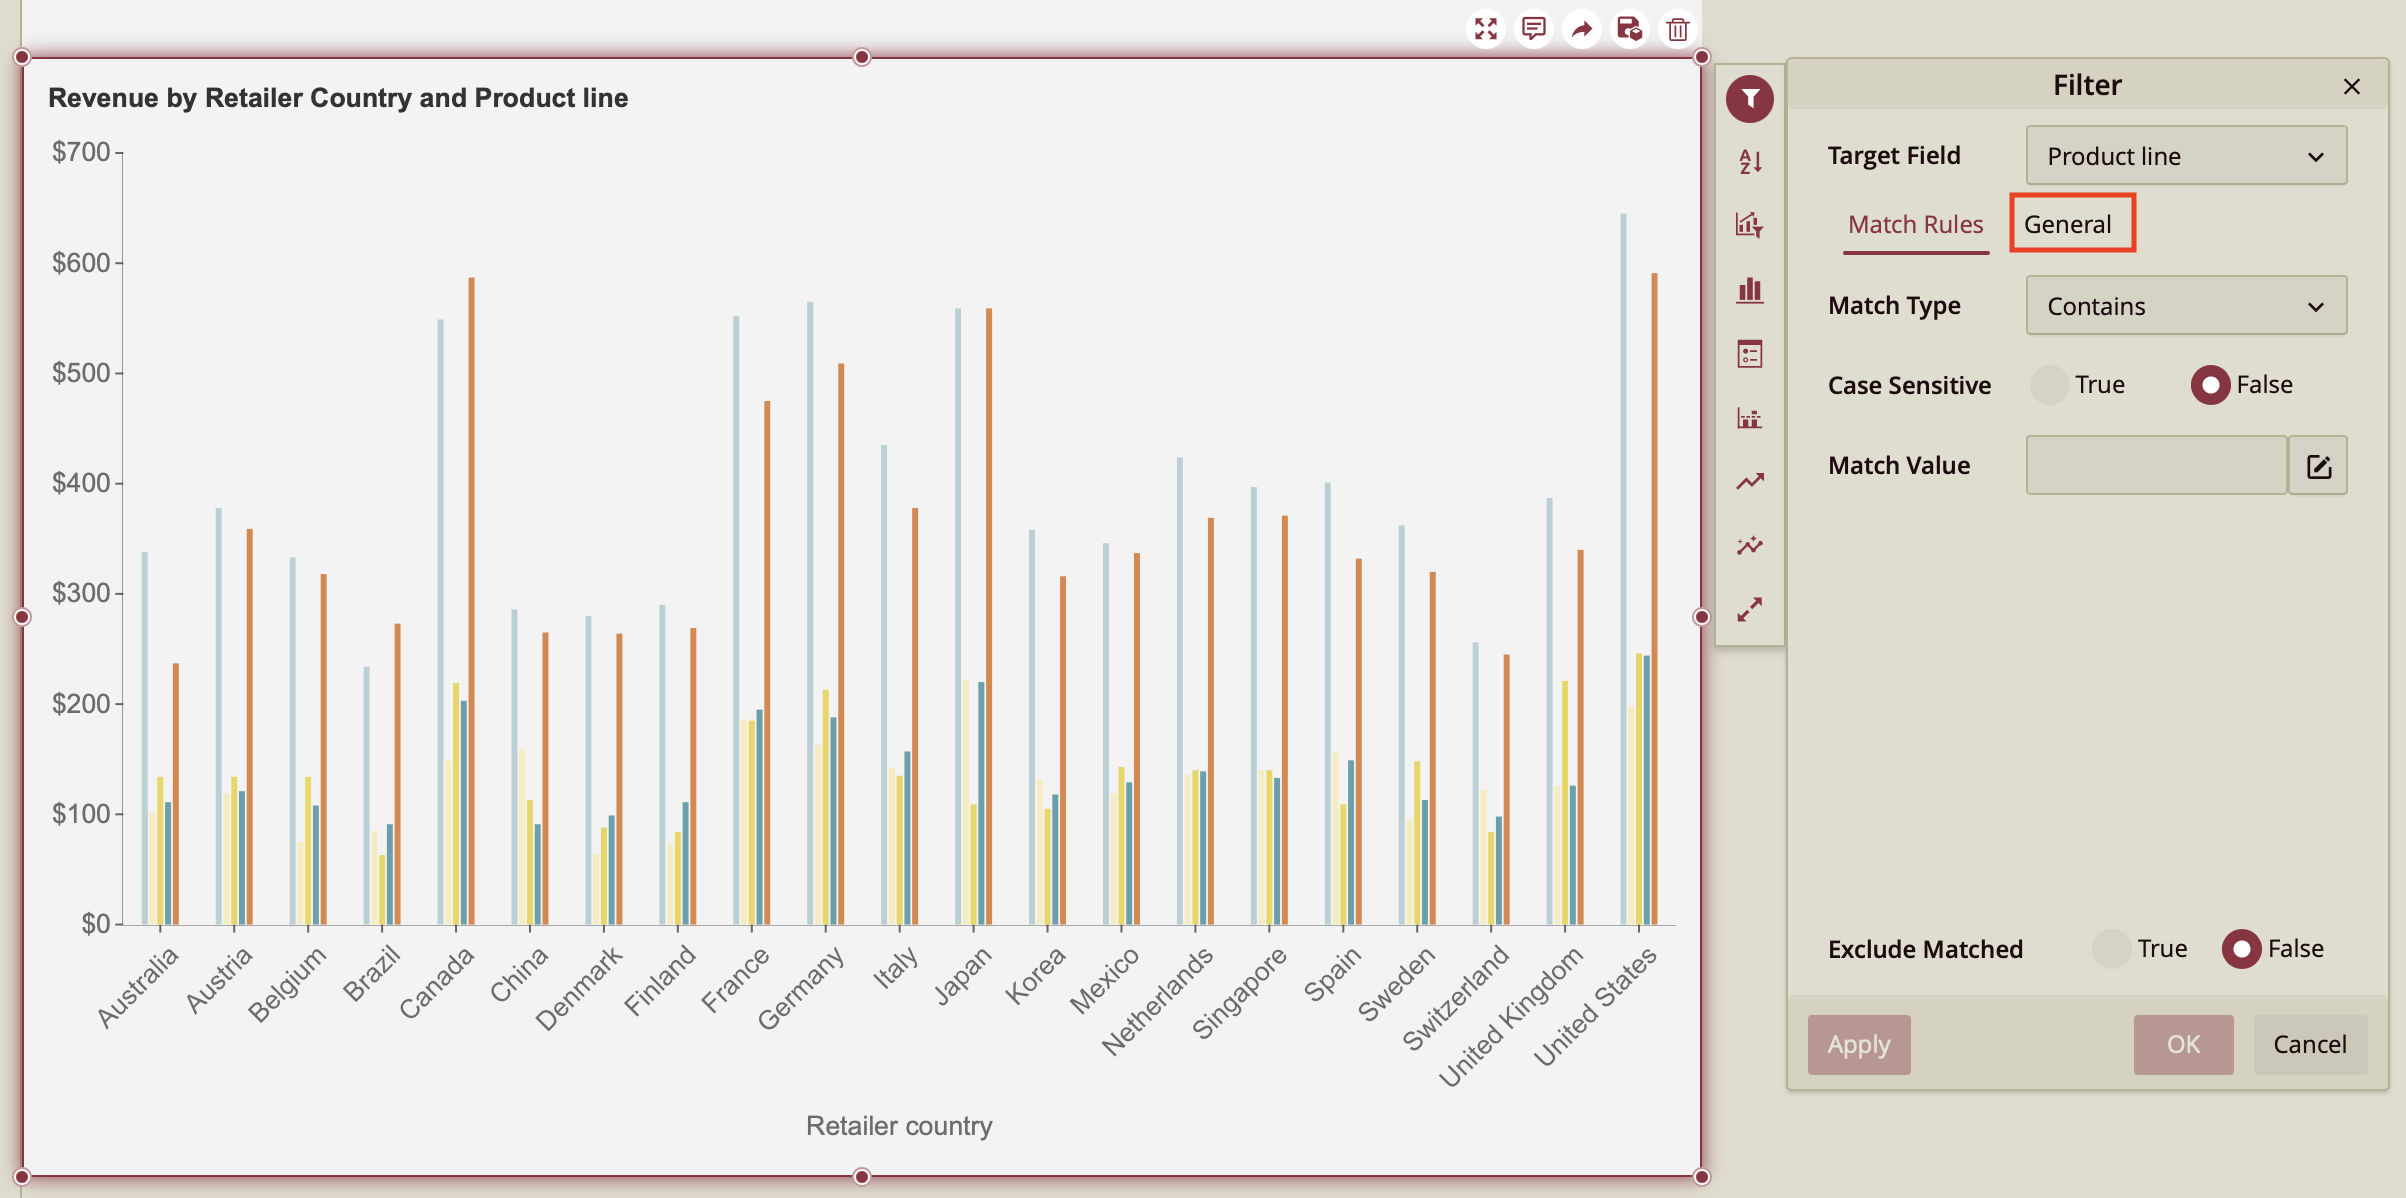
6. Select the General tab to select the product line you wish to filter for.
7. Select which product line you wish to filter for. In this case, the filter value is Personal Accessories. Click OK.
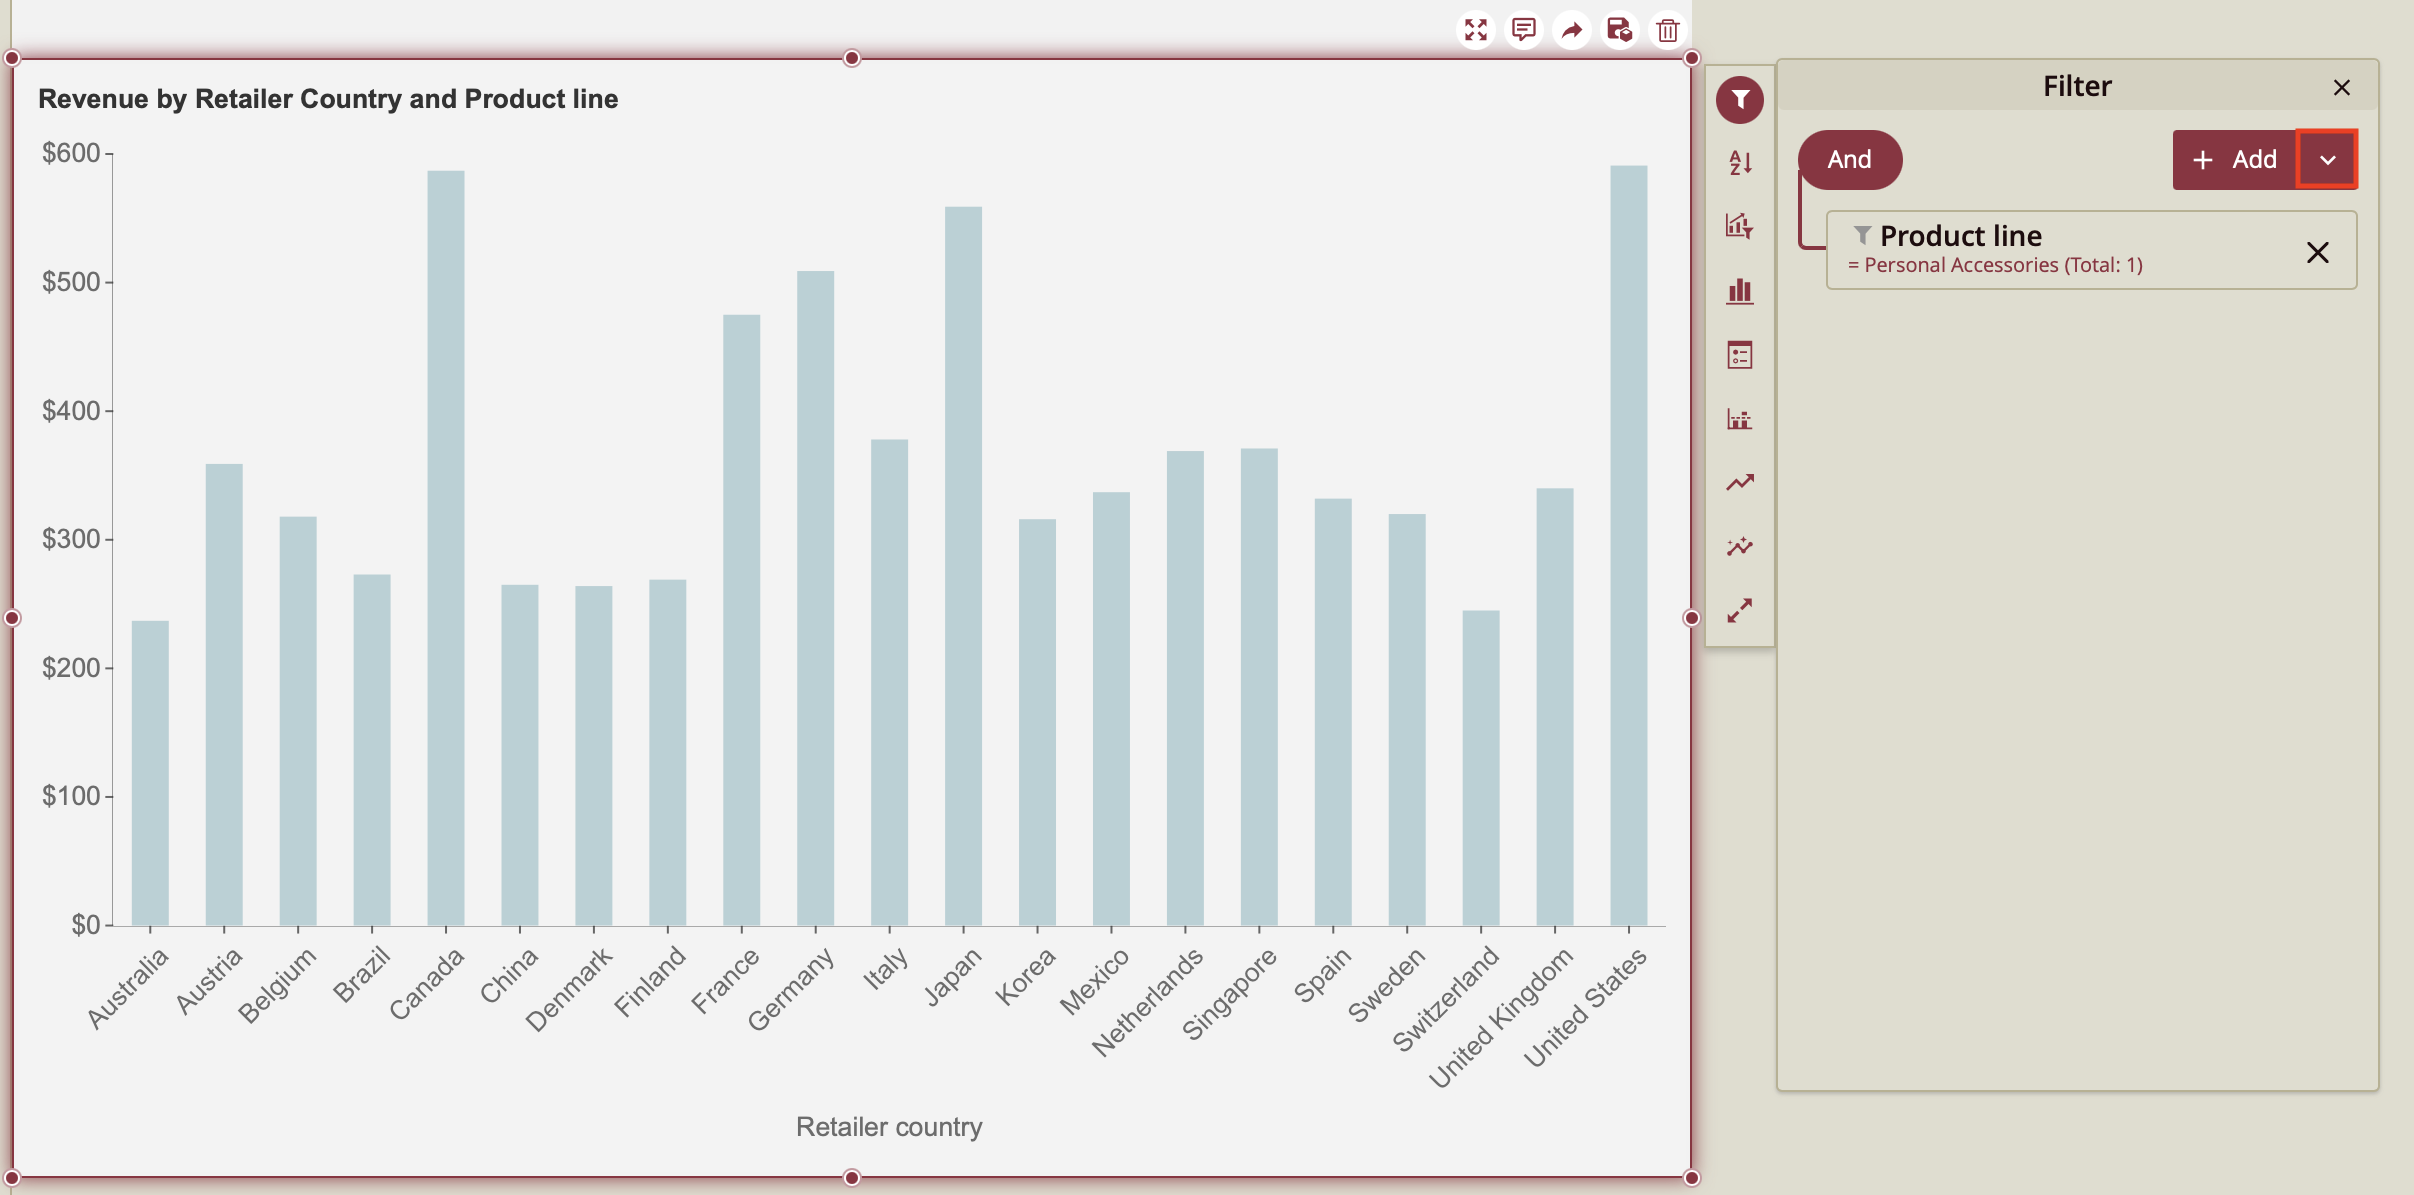
8. The dashboard will now display the revenue generated for Personal Accessories only.

9. To add a filter group, click the arrow button to open the dropdown menu.
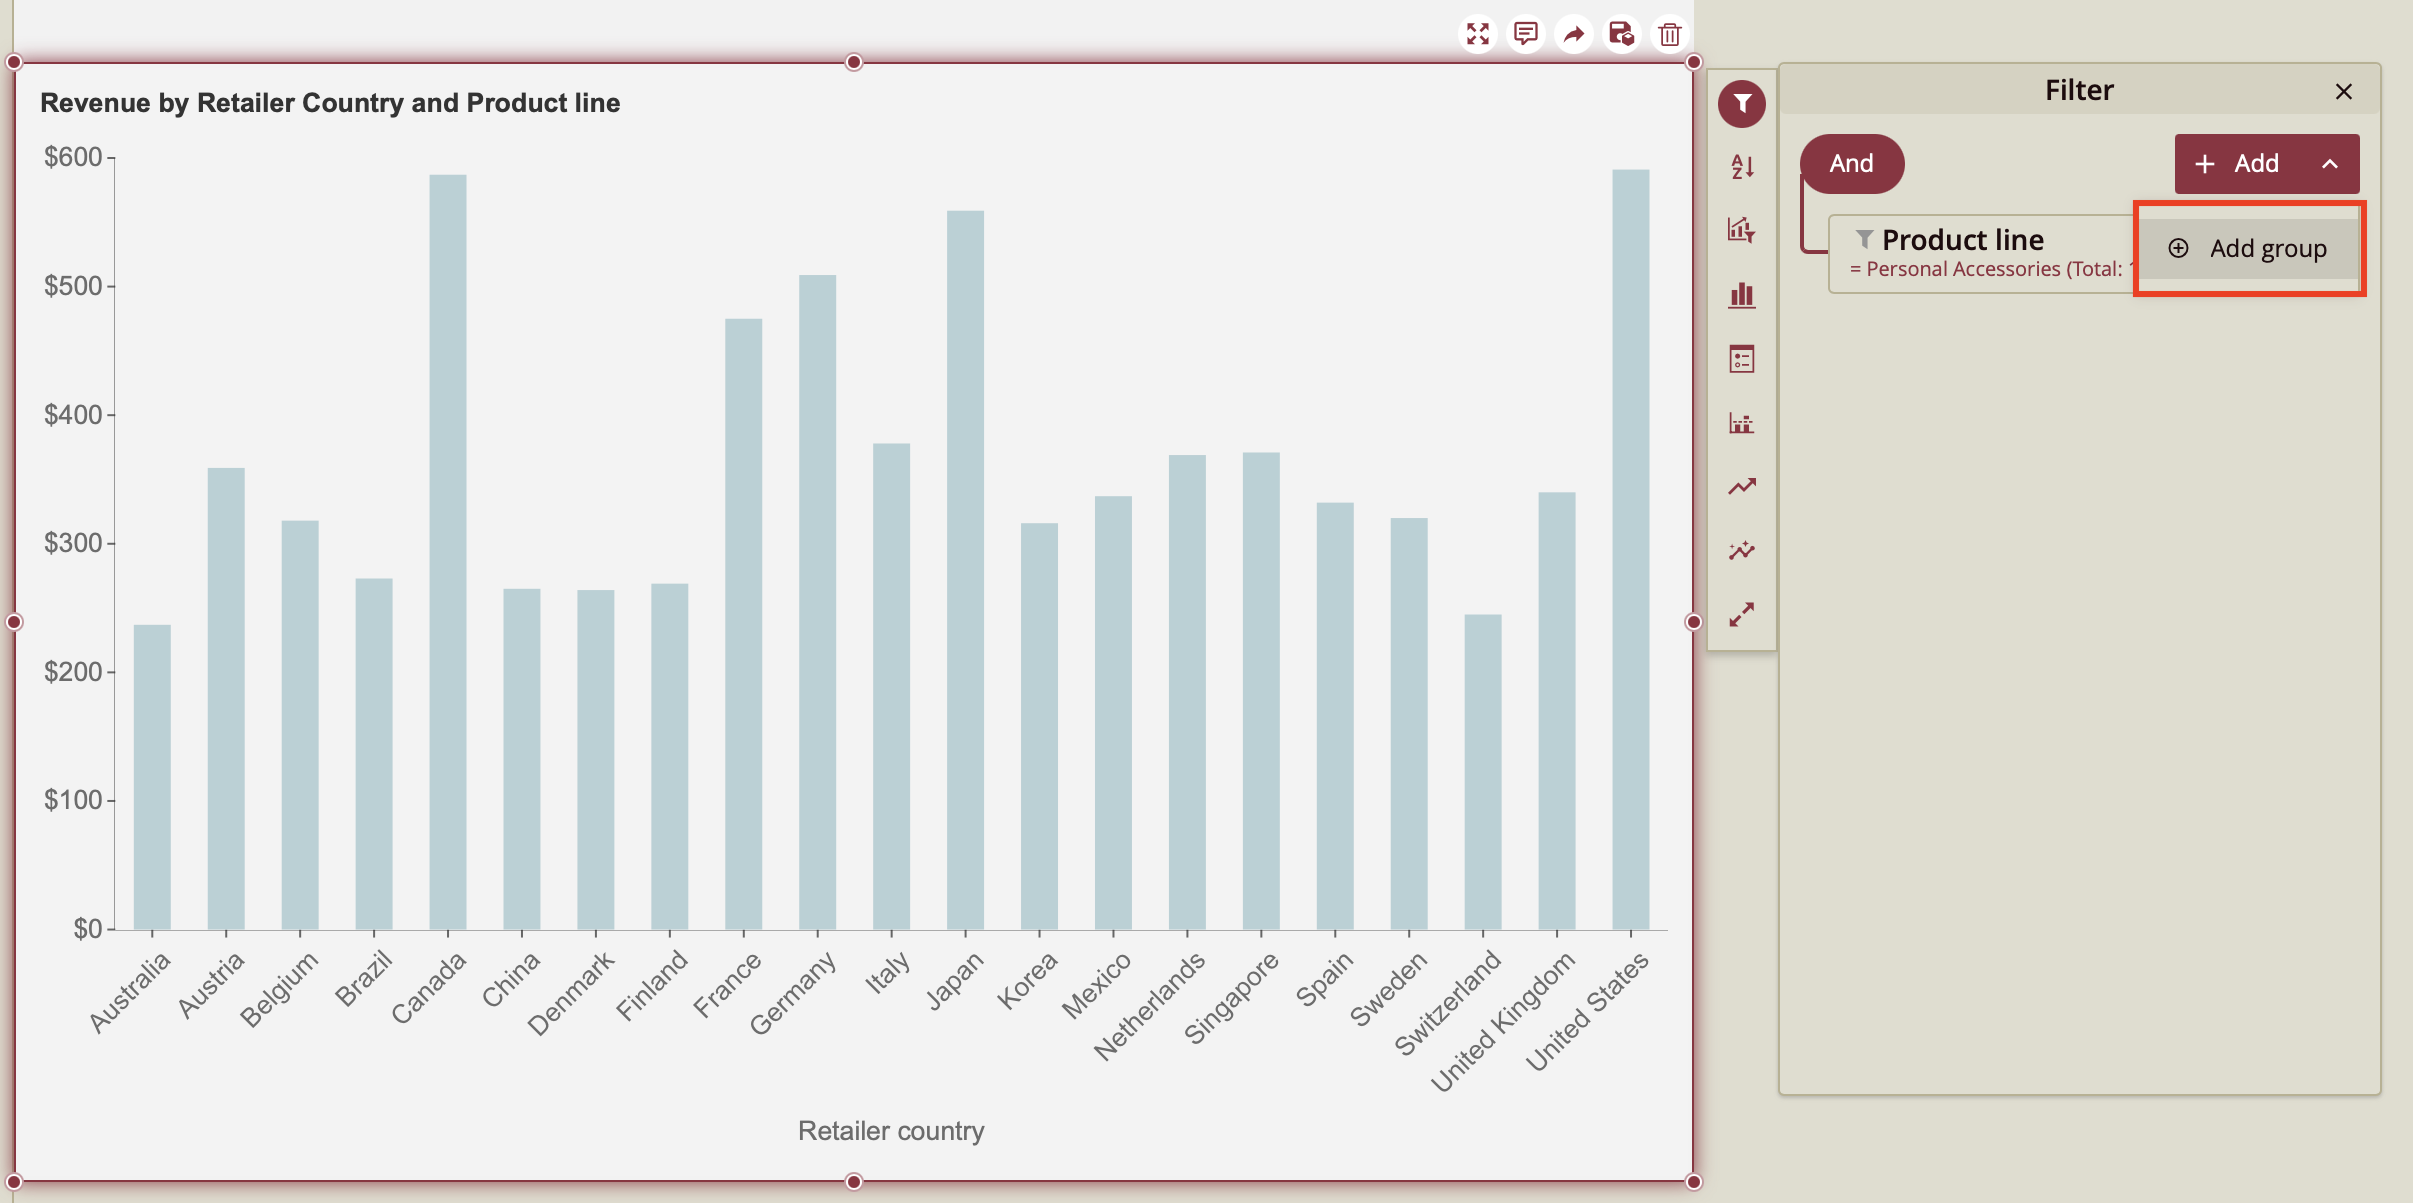
10. Click Add Group.
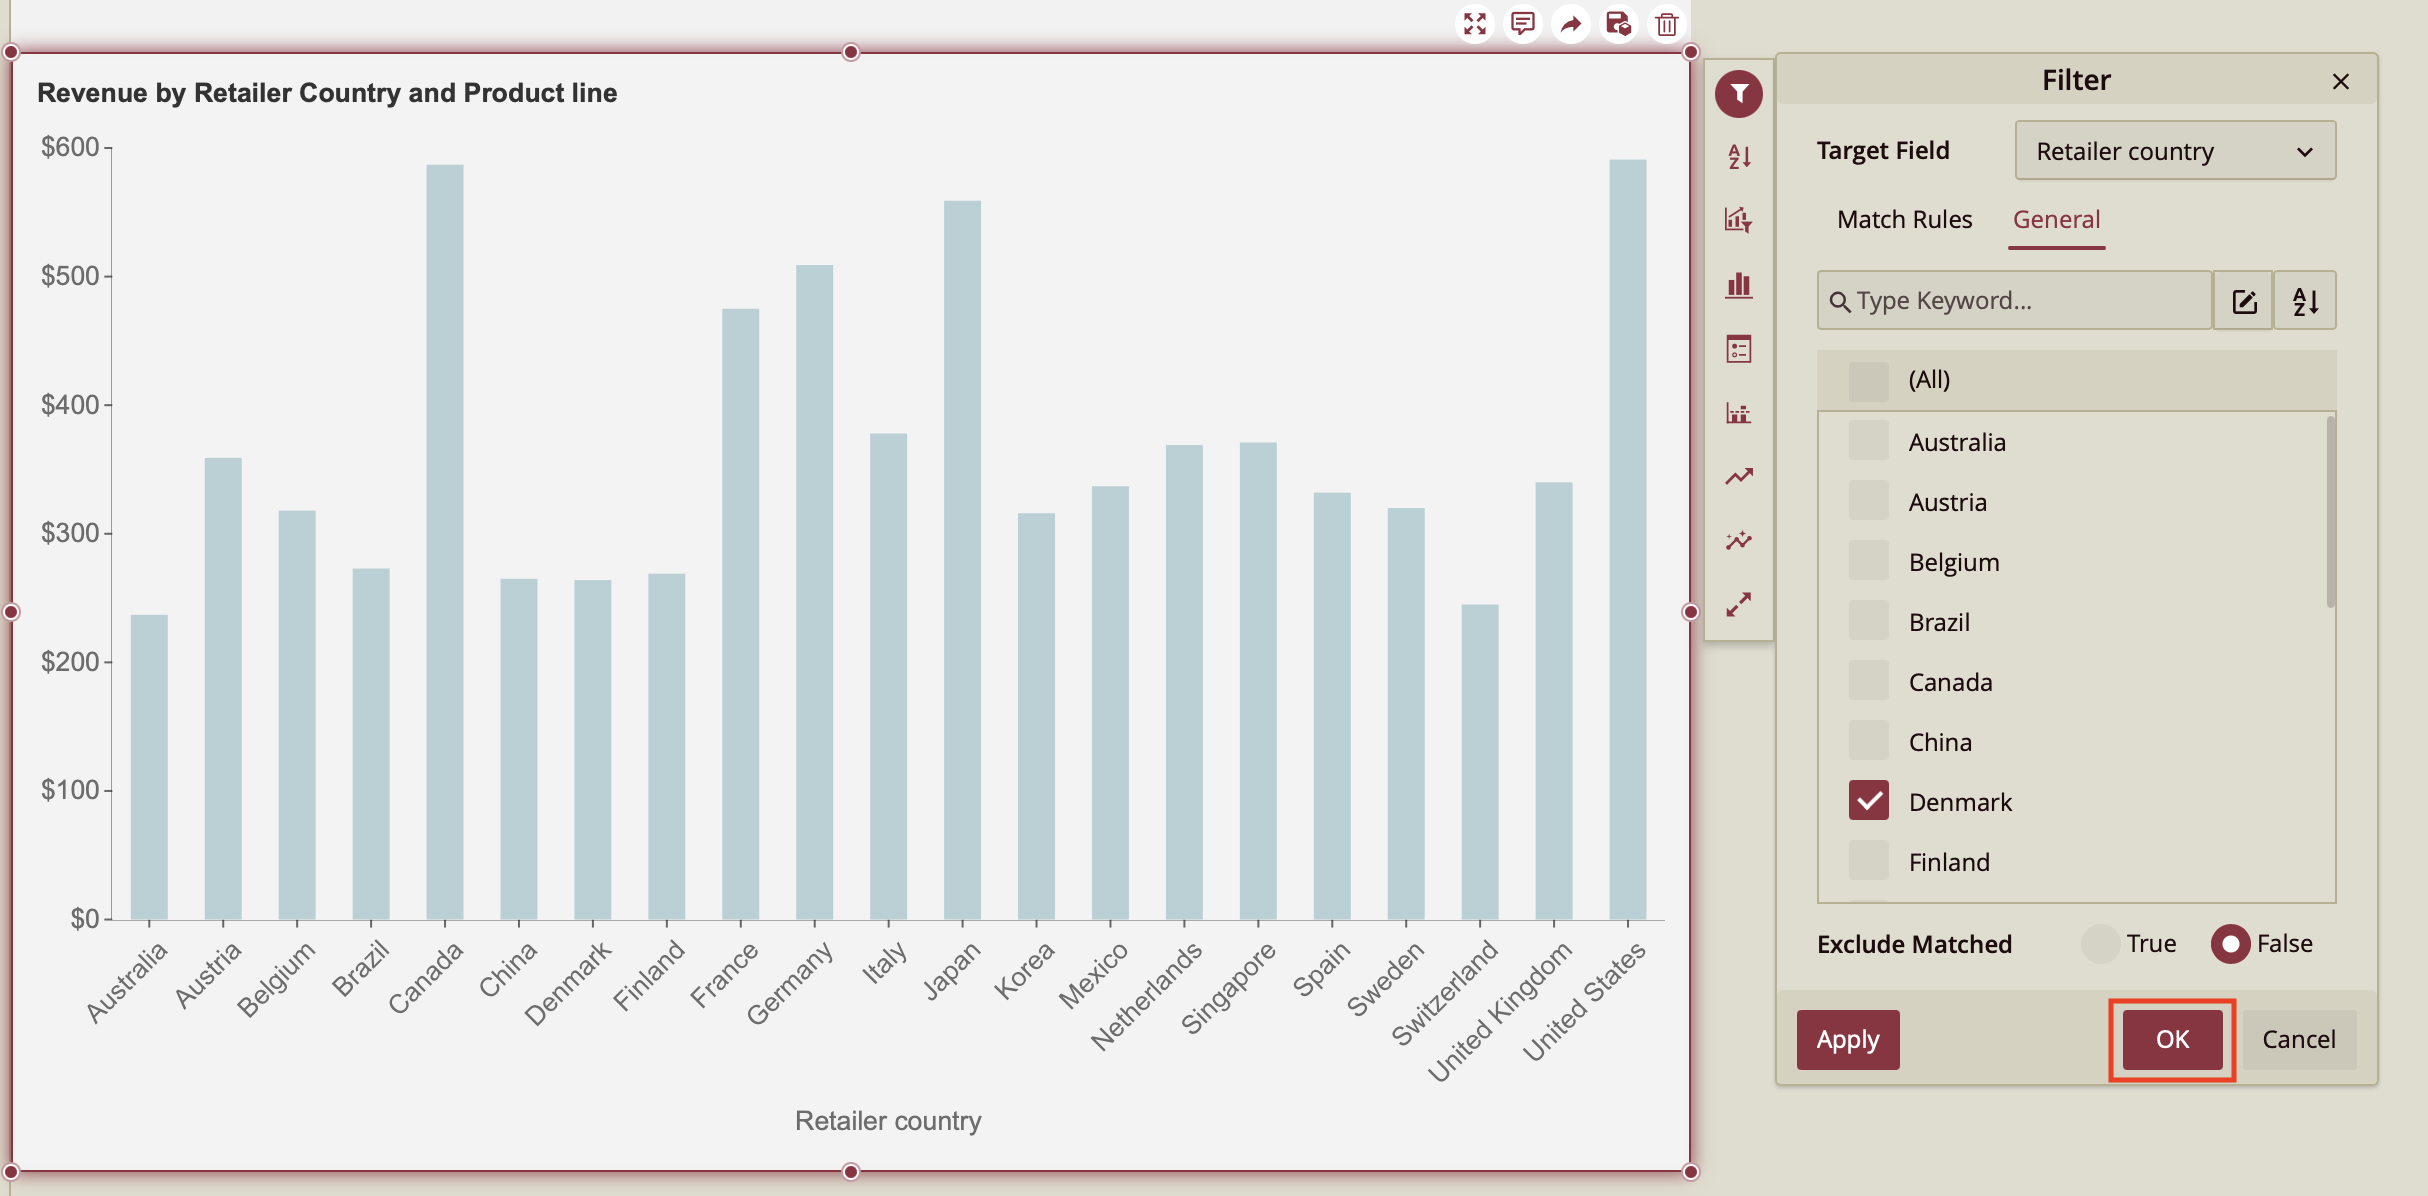
11. Select + Add as shown below.
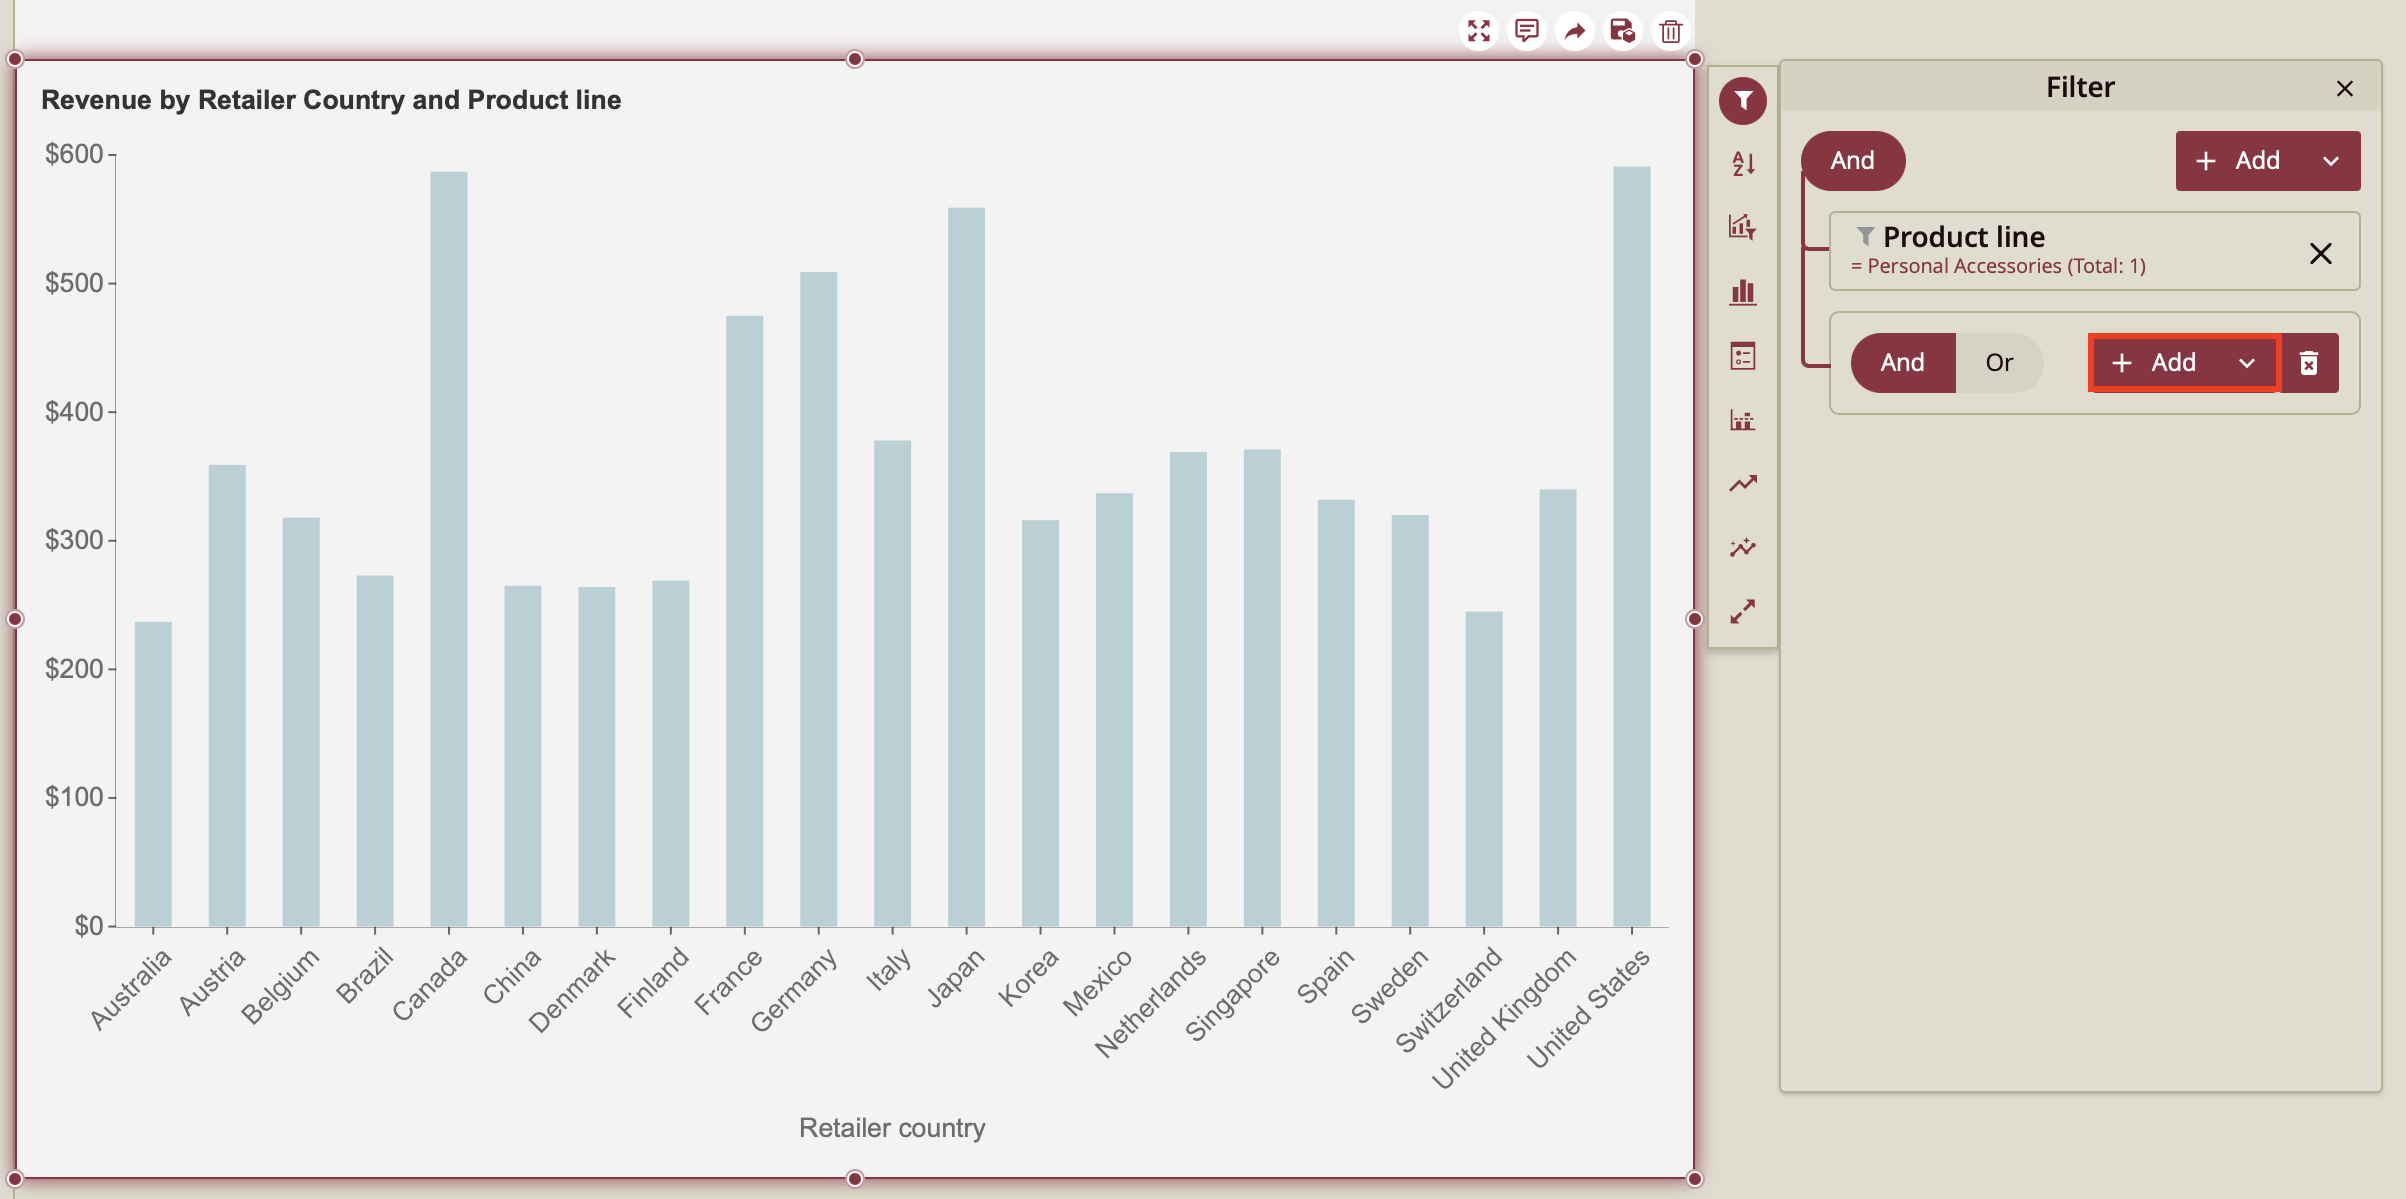
12. Open the General tab to select the Retailer country you wish to filter the dashboard by.
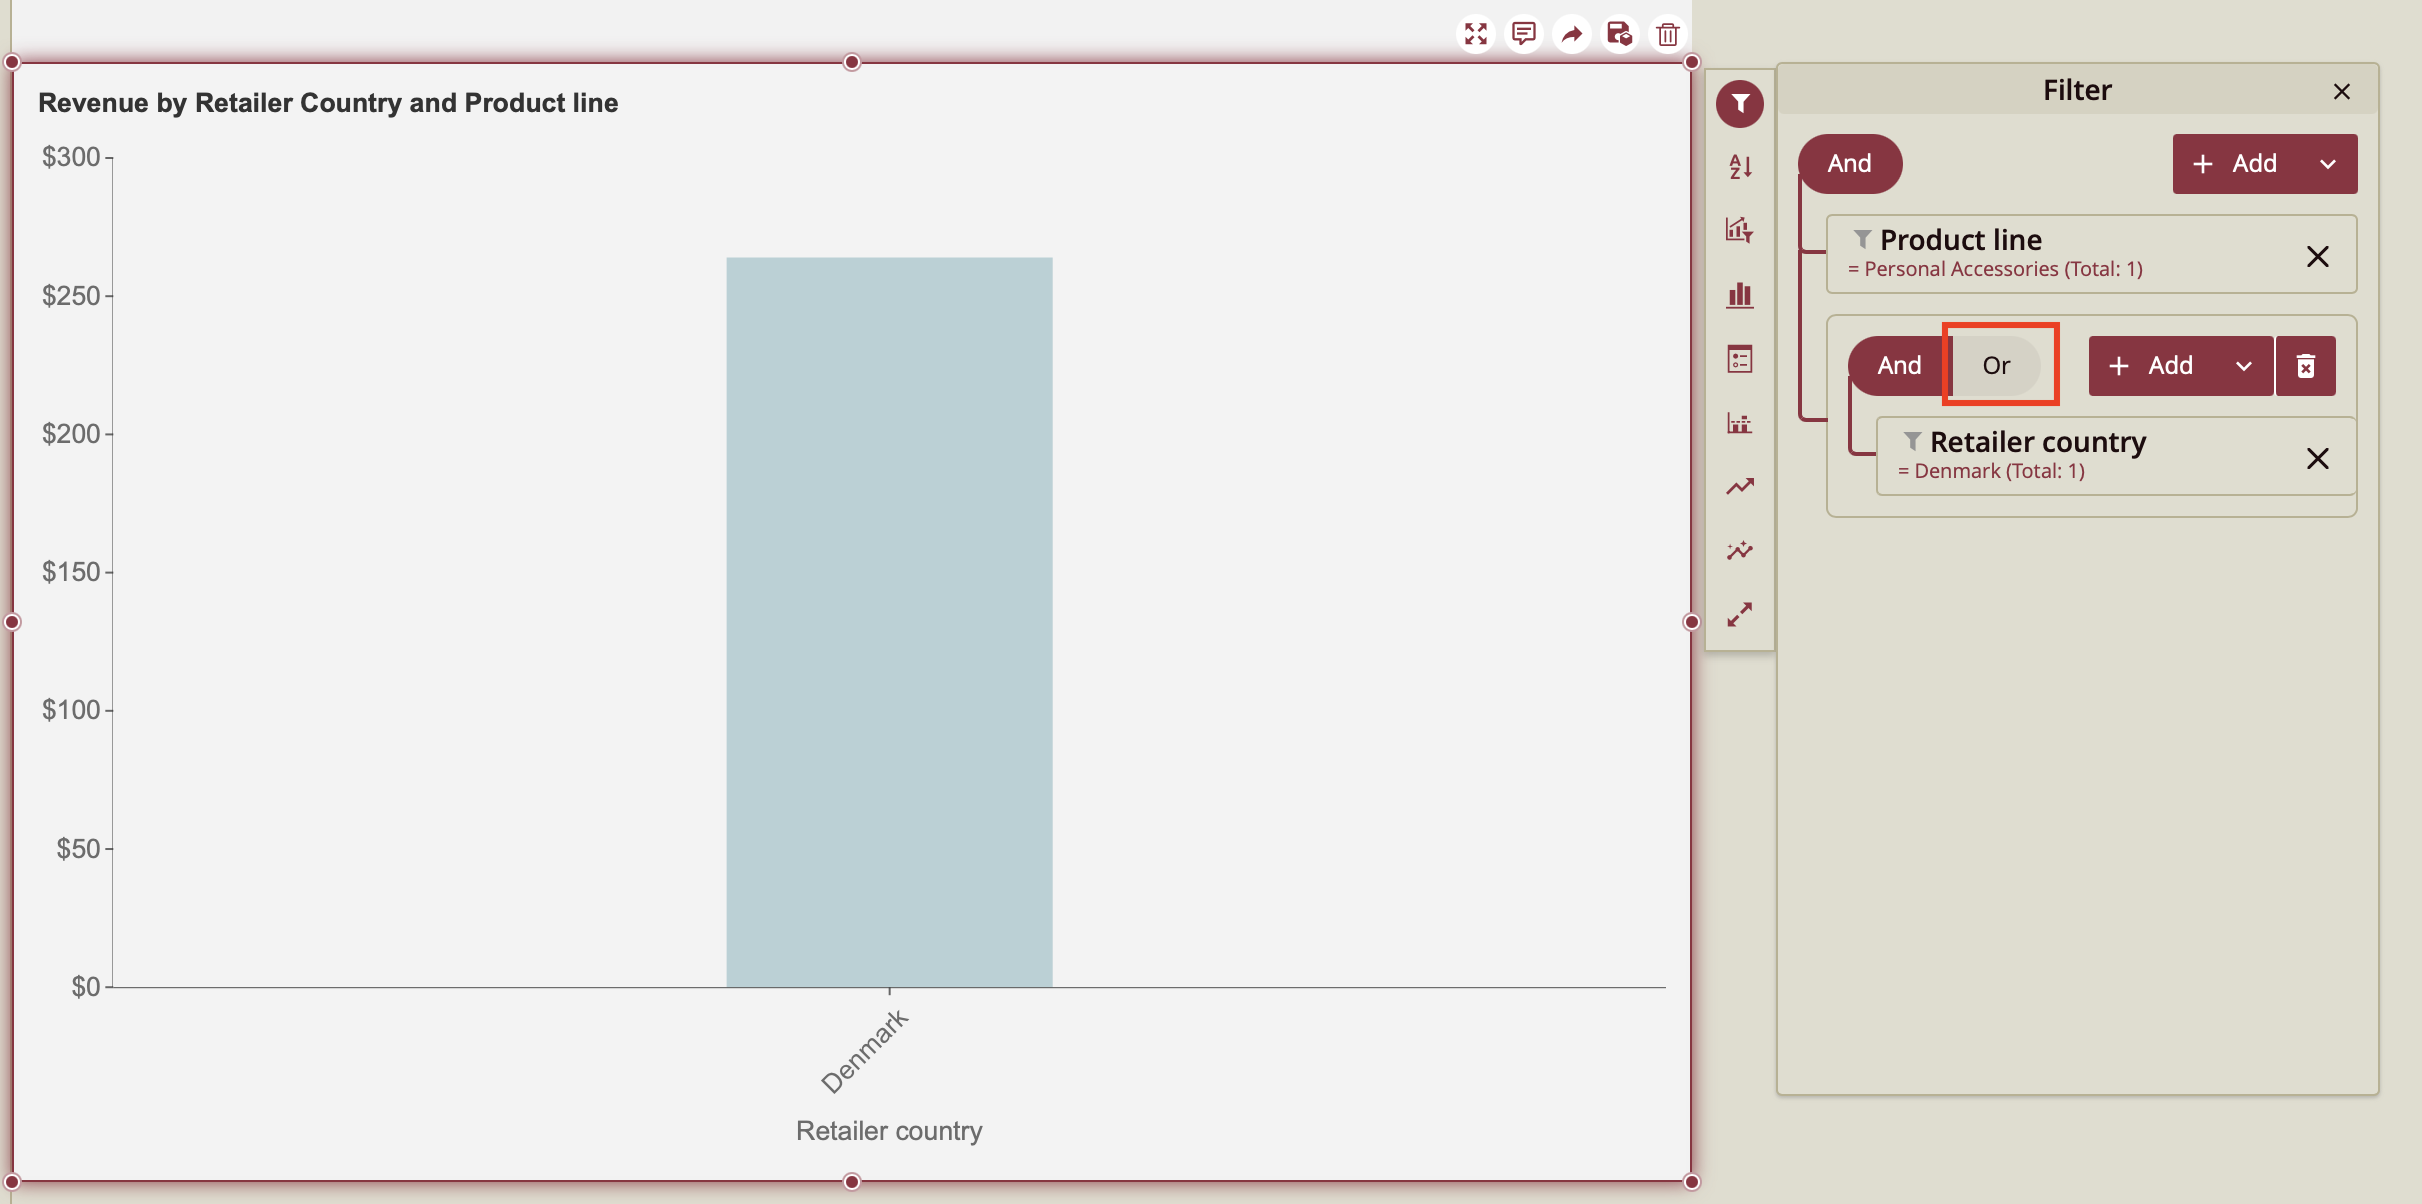
13. In this case, we have selected Denmark. Click OK.
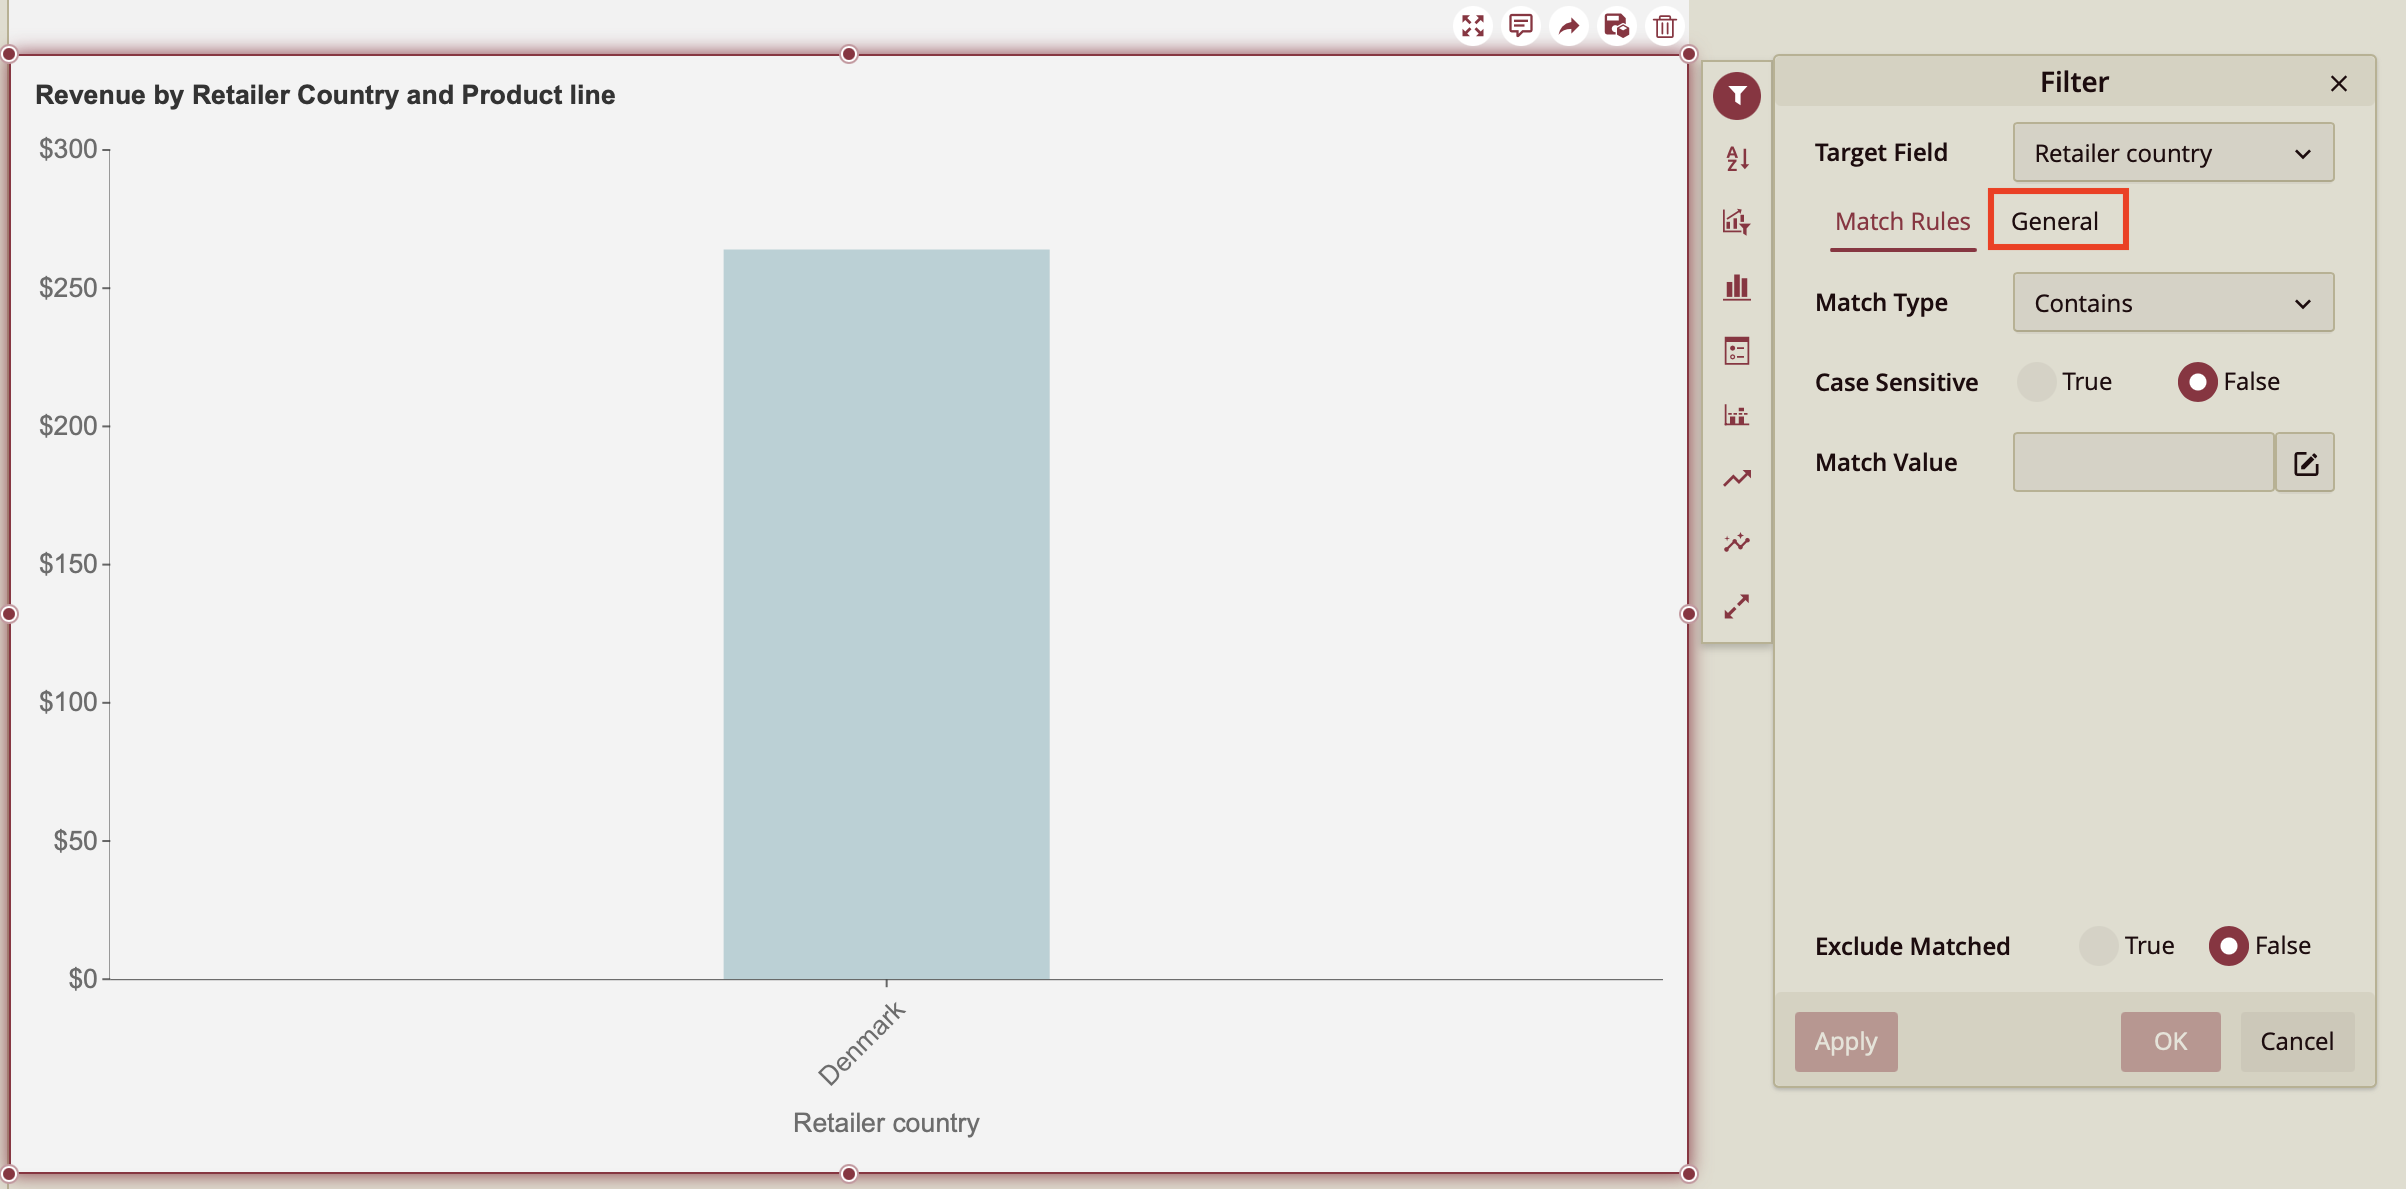
14. You can see the dashboard now displays the revenue generated by Personal Accessories in Denmark only. To display the revenue generated by Personal Accessories in another country, select Or.
15. Follow the same steps as before.
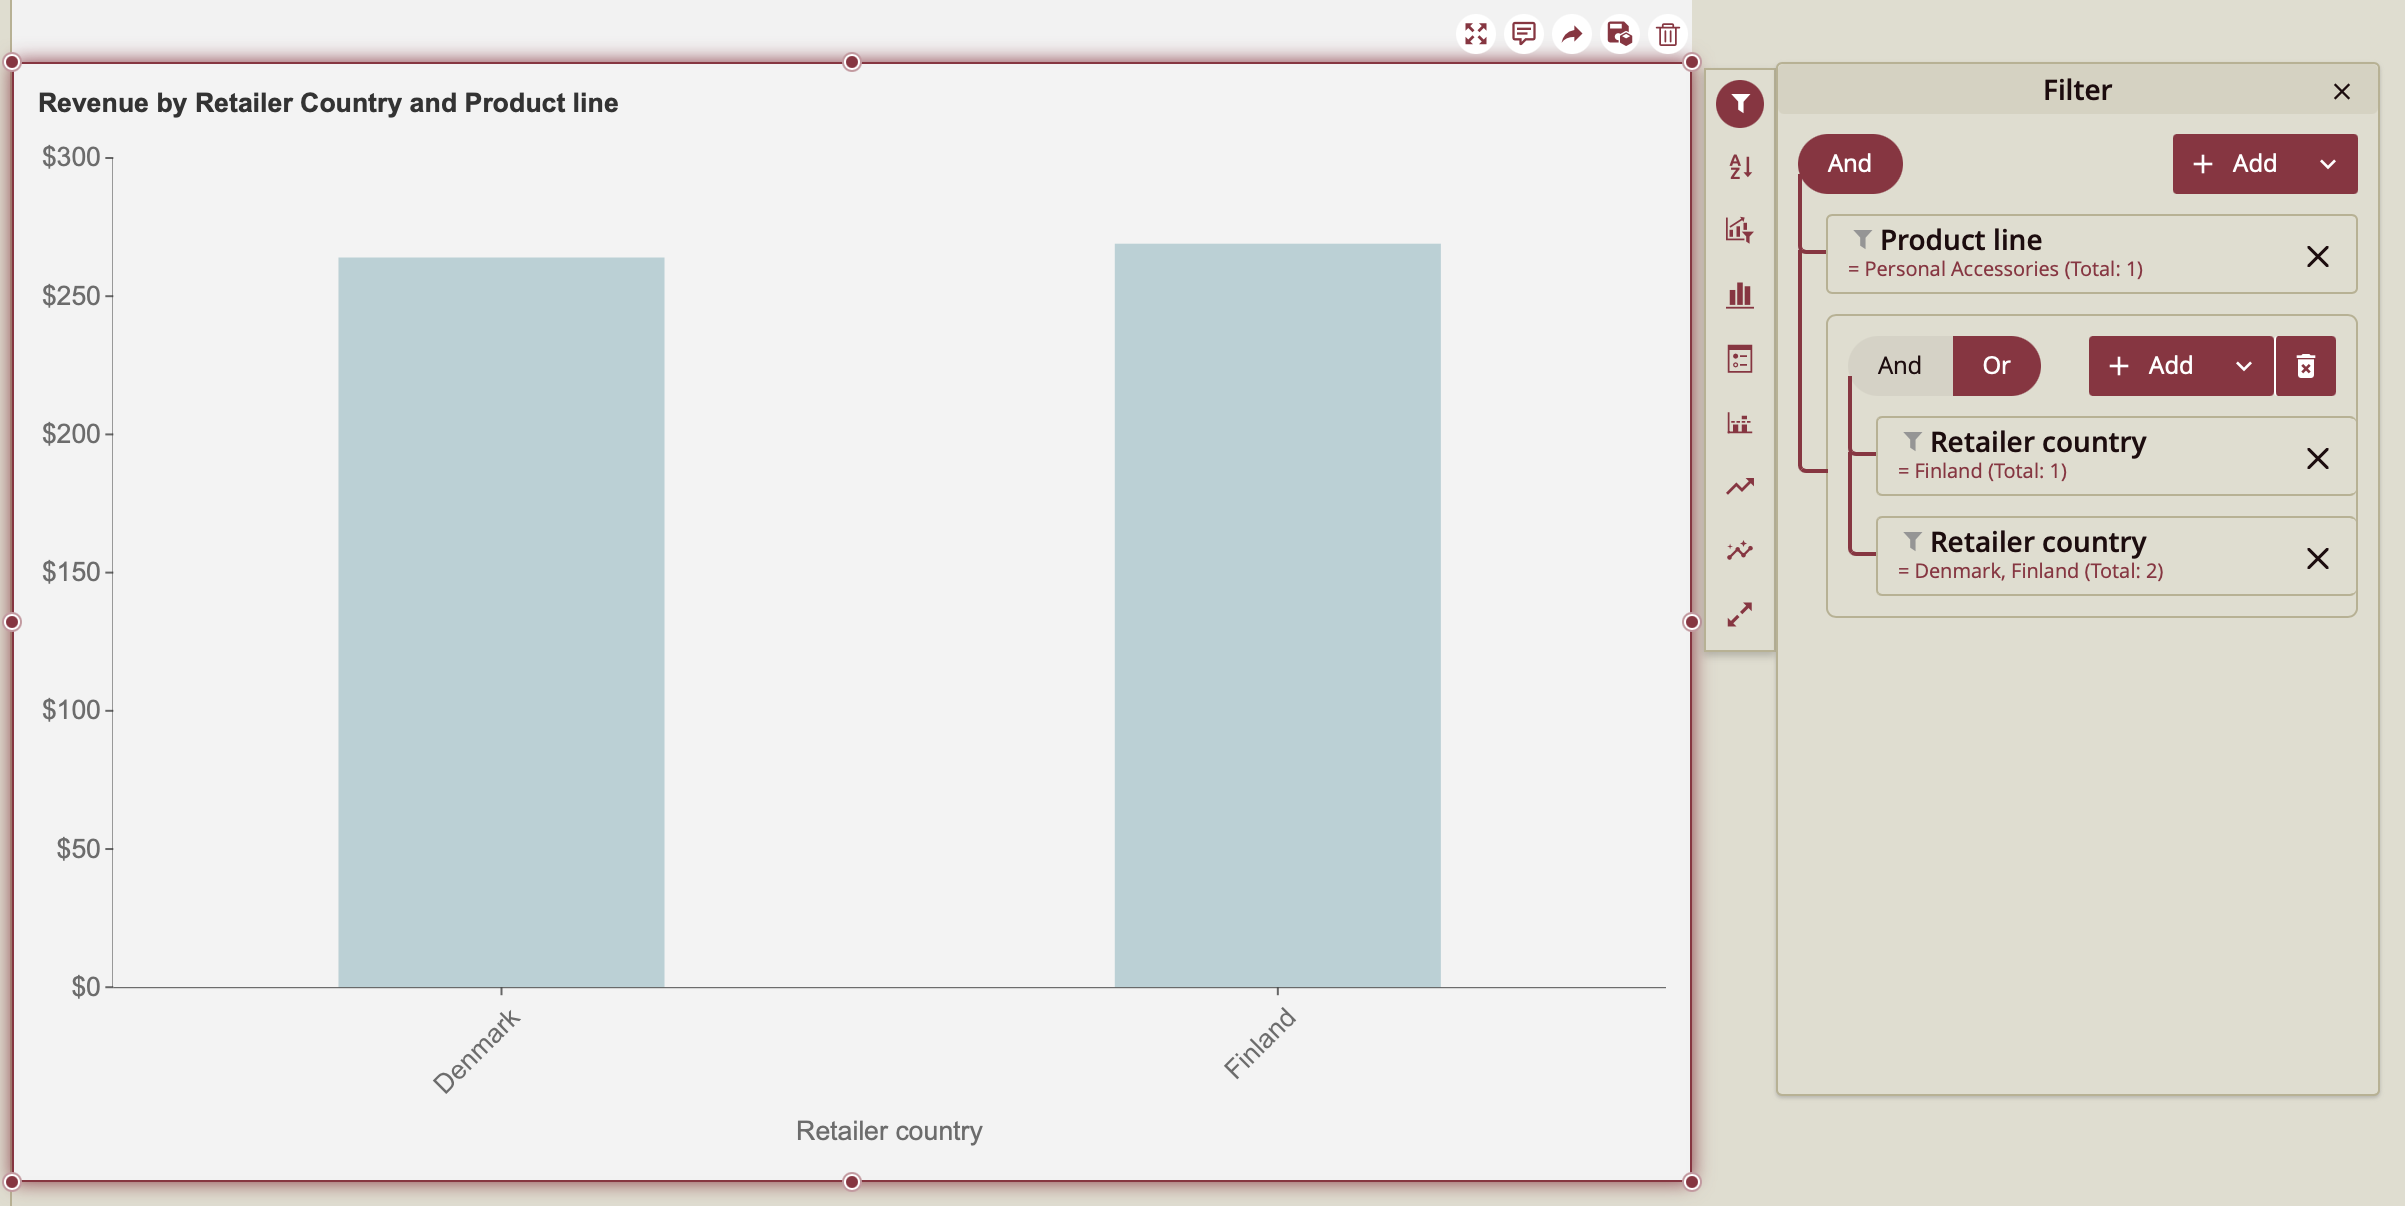
16. In this case, we have selected Finland.
17. Now the dashboard displays the revenue generated by Personal Accessories in both Finland and Denmark. We have successfully applied a group filter to our dashboard.
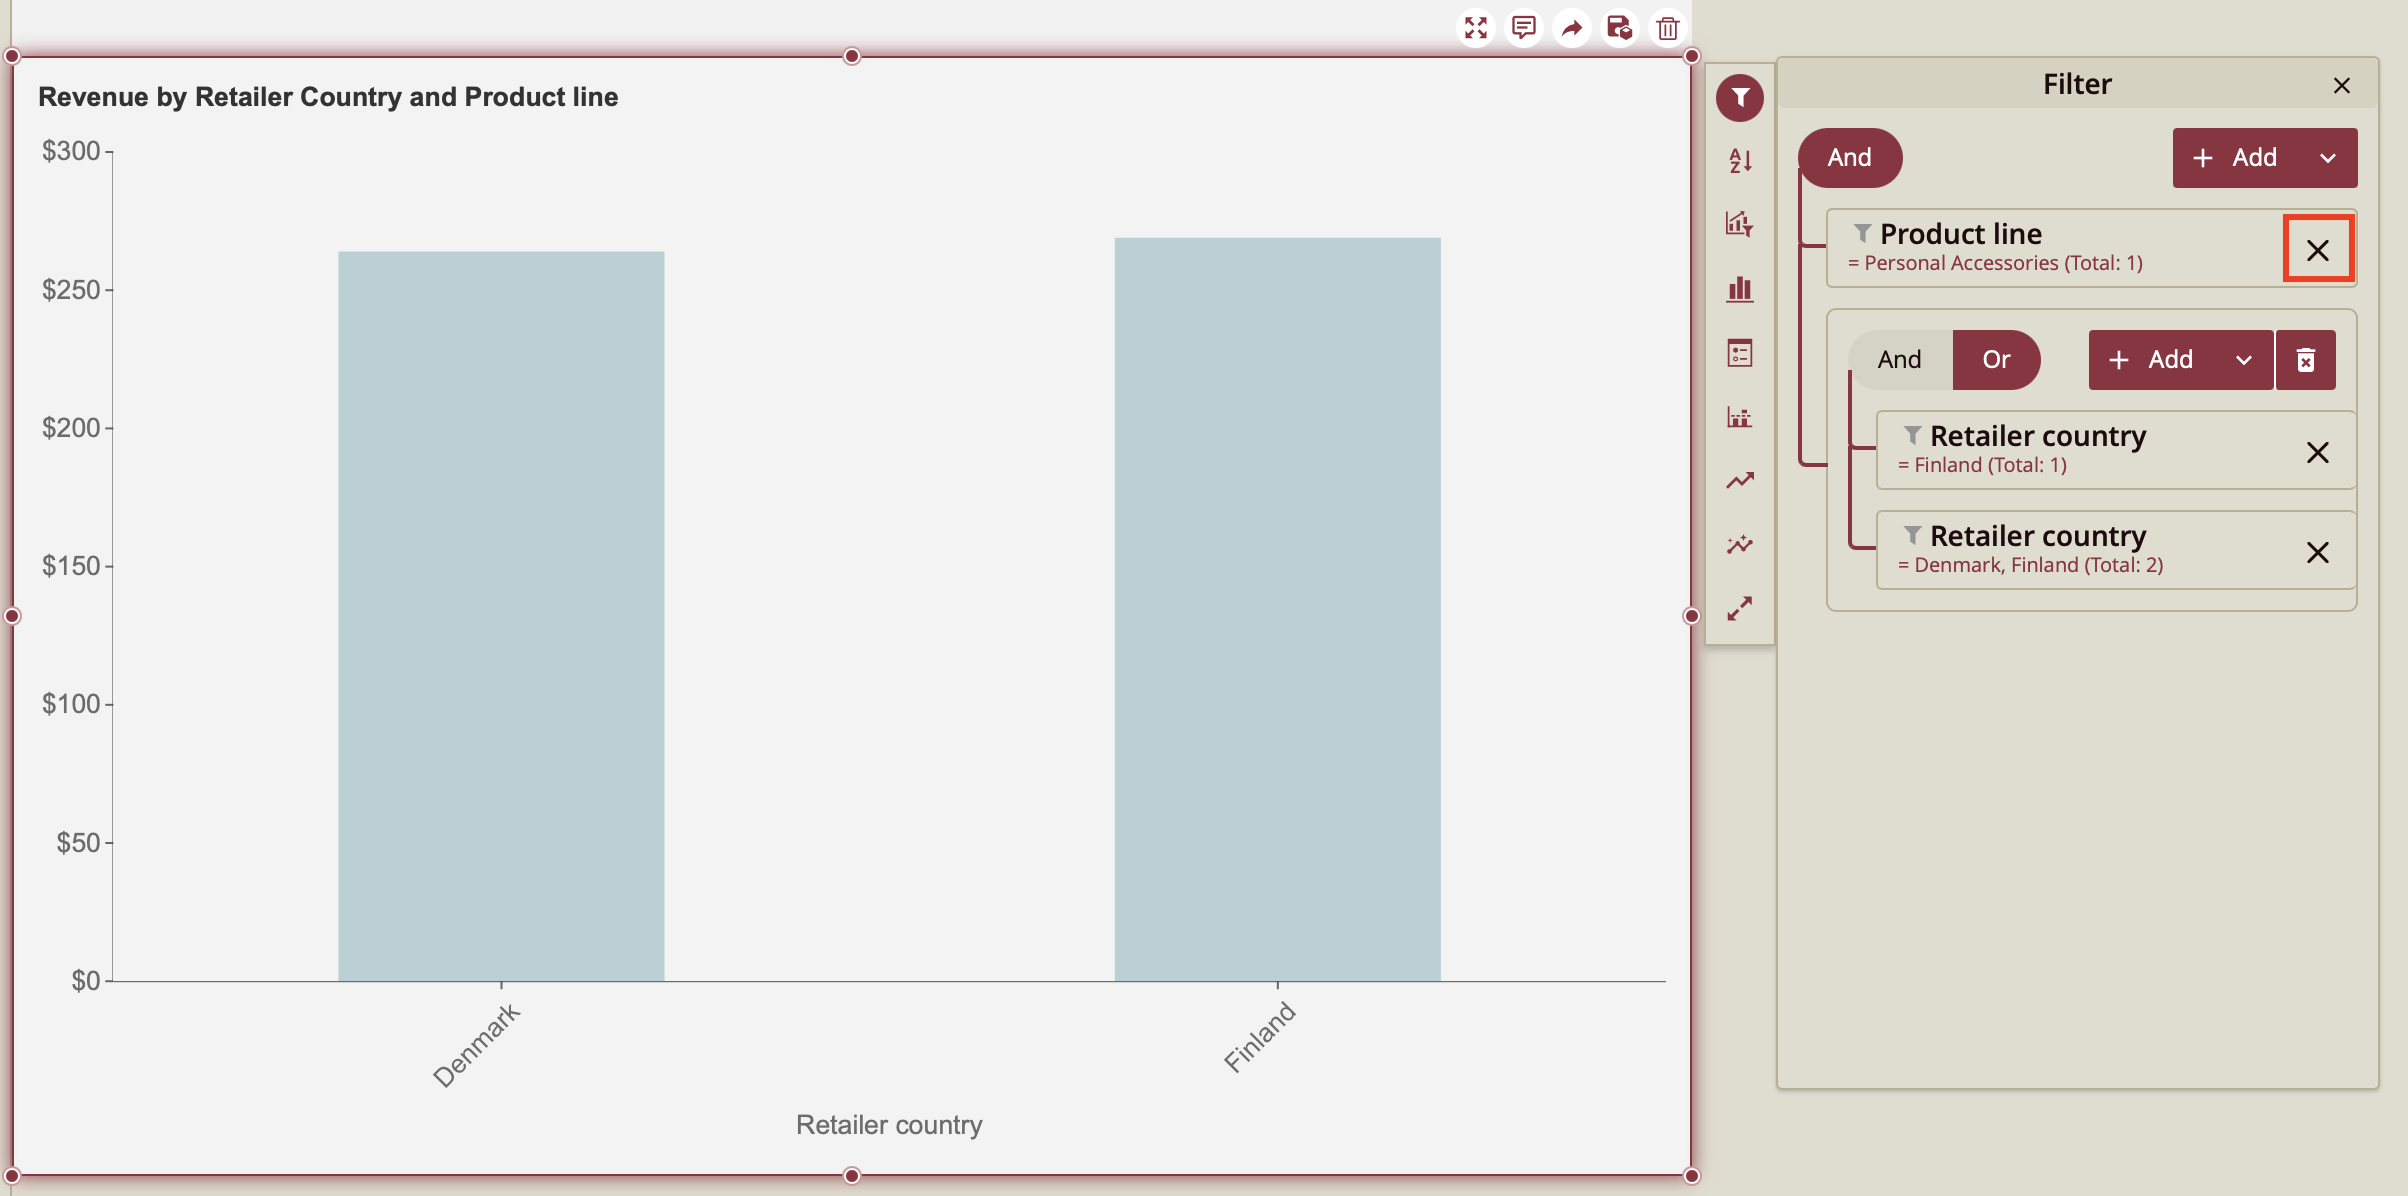
18. If you wish to see the revenue generated by every Product Line, simply click the x next to the filter.
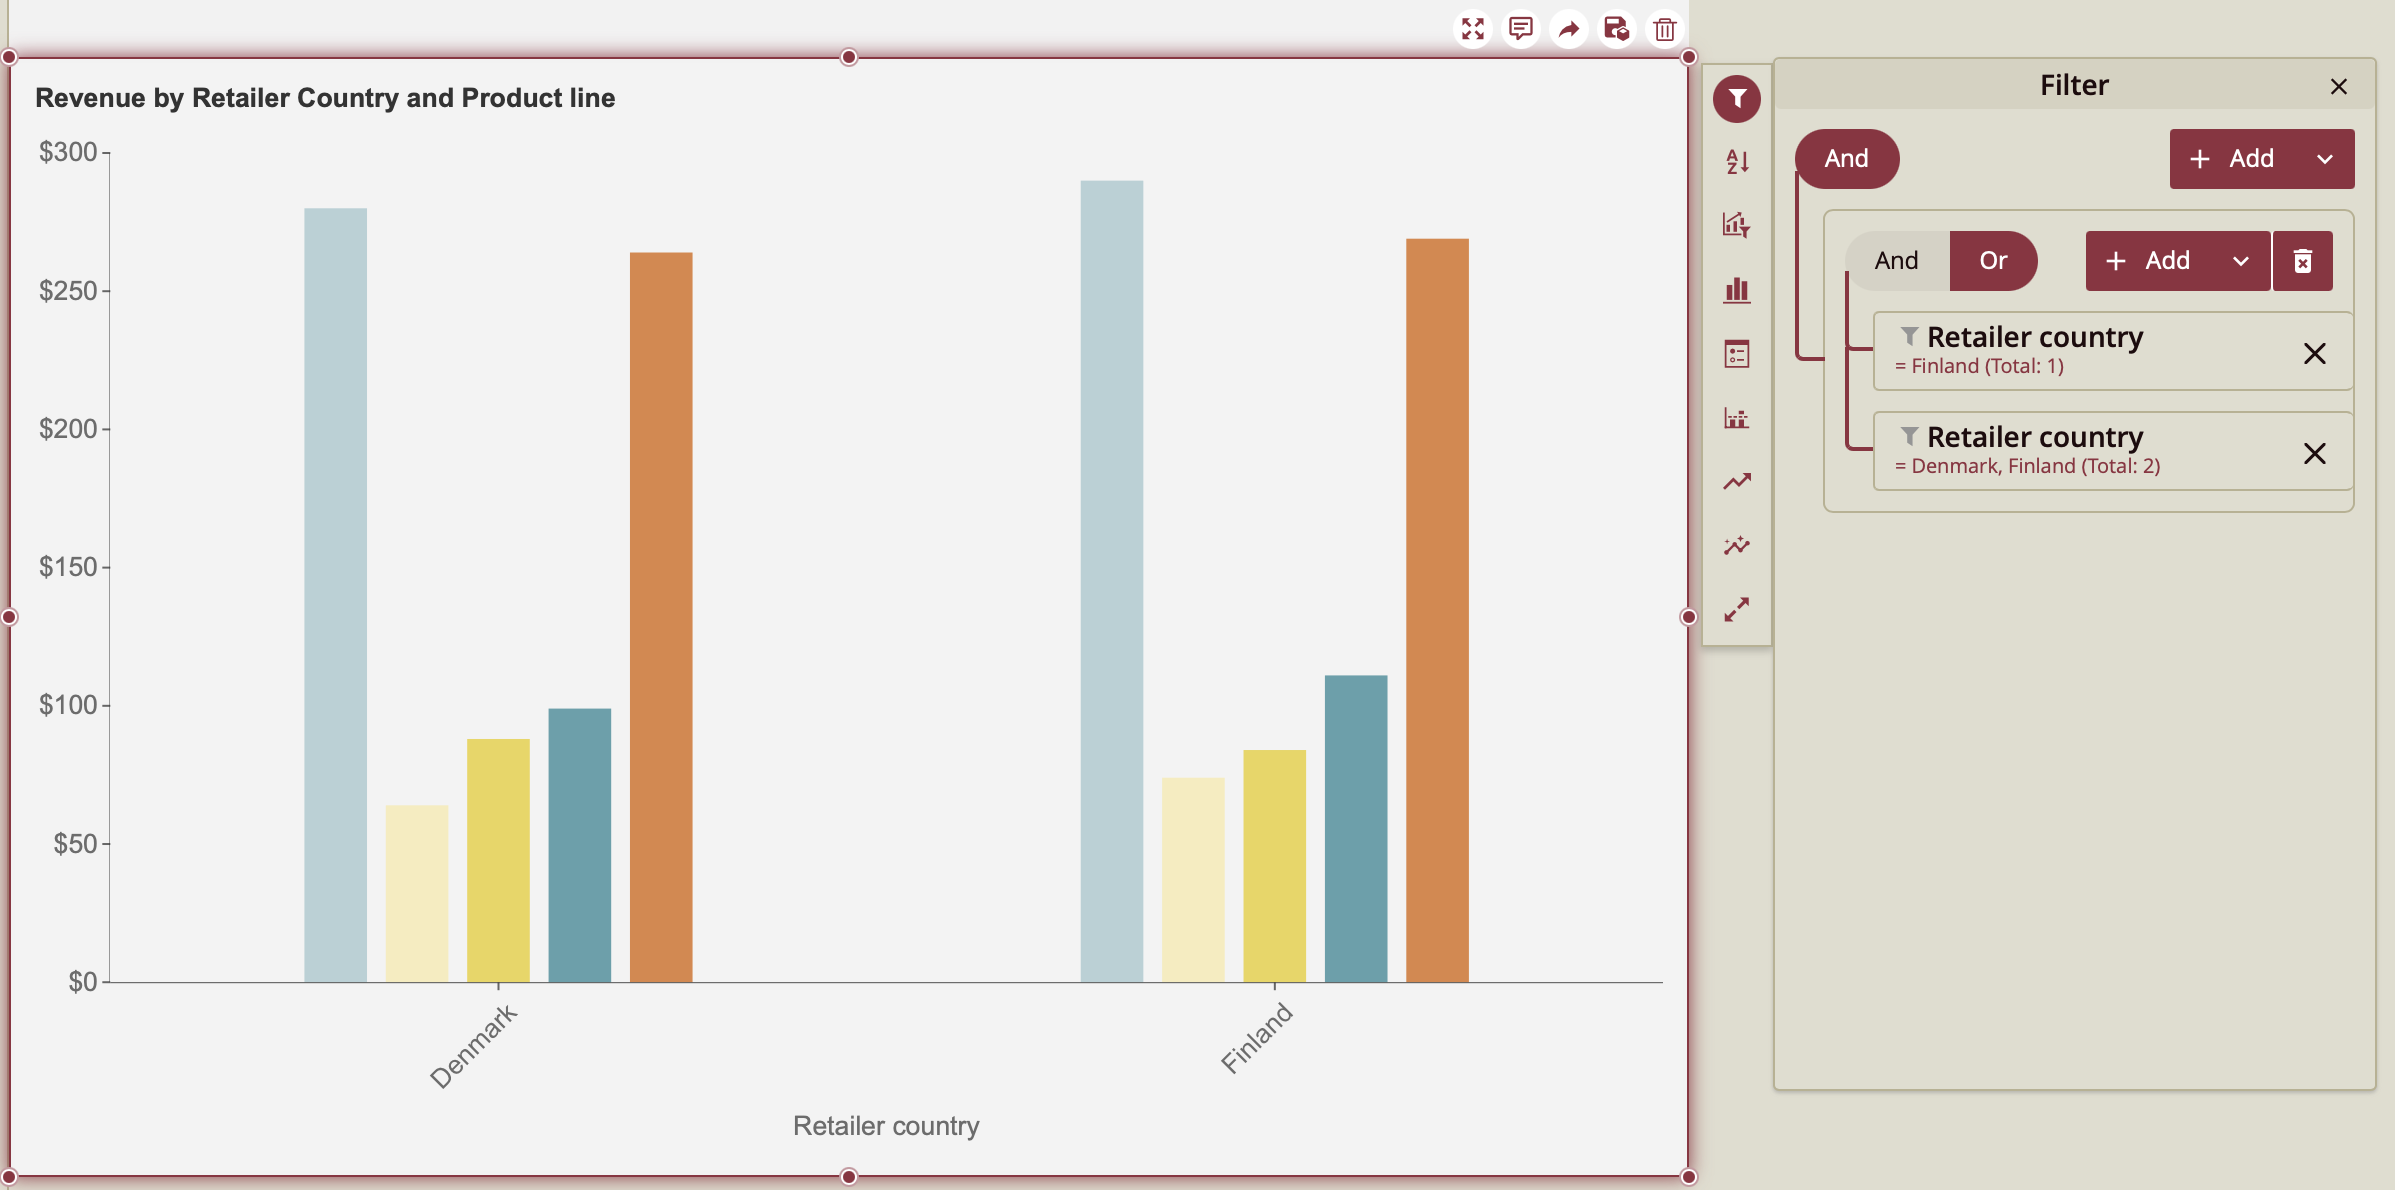
19. Here we have the revenue generated by every Product Line in Denmark and Finland respectively. Use these steps to customize your own dashboard displays.
Dynamically Filter a Chart Using a Parameter
You can use an image to dynamically change the parameter by which you filter a chart. The following steps will show you how to do so.
This tutorial uses a dataset similar to Adventure Works data. The dataset can be downloaded here.
1. Create a Chart
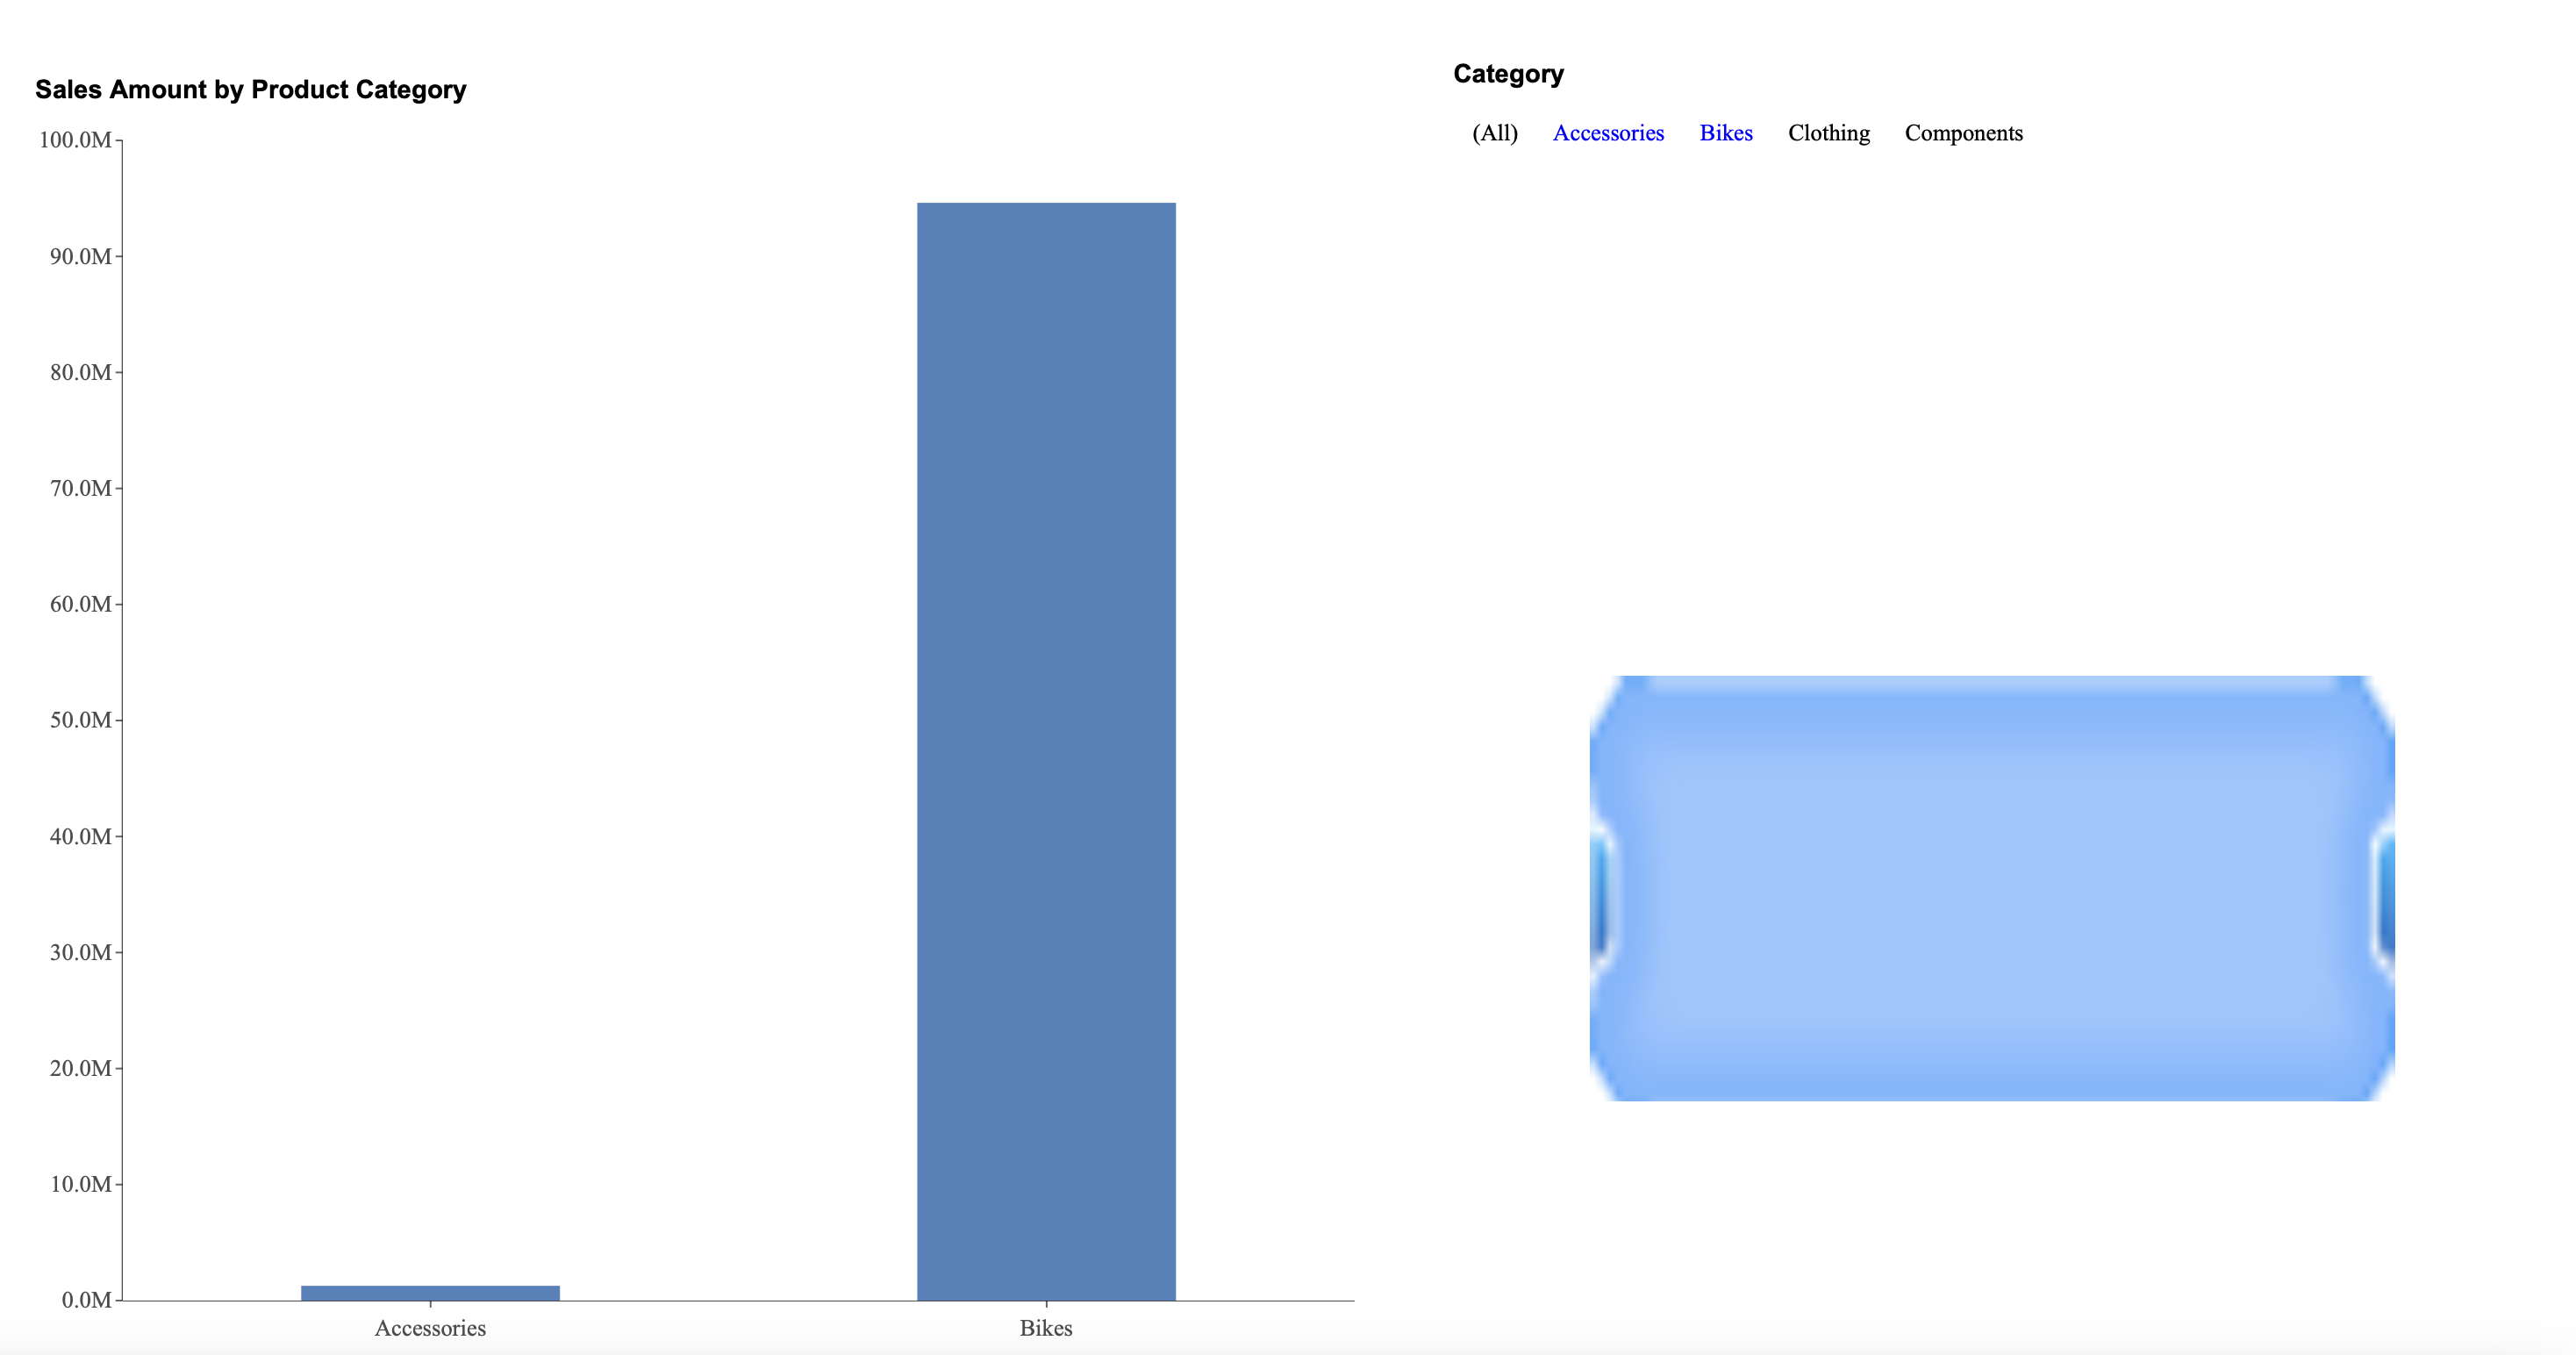
Drag a column chart onto the canvas and bind your data. This chart displays Sales Amount by Product Category.

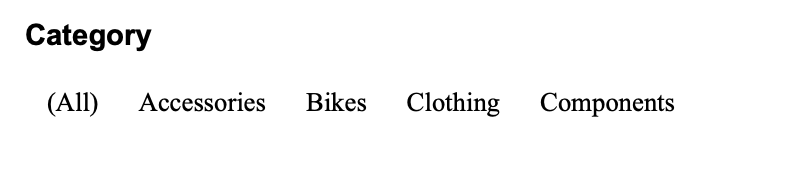
2. Add a Slicer
Drag a label slicer onto your canvas and bind it to your Product Category data.
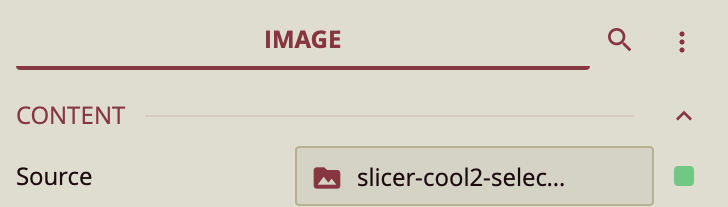
3. Add Image
Add an image scenario to your canvas and upload an image to it under Source in the Inspector Tab.
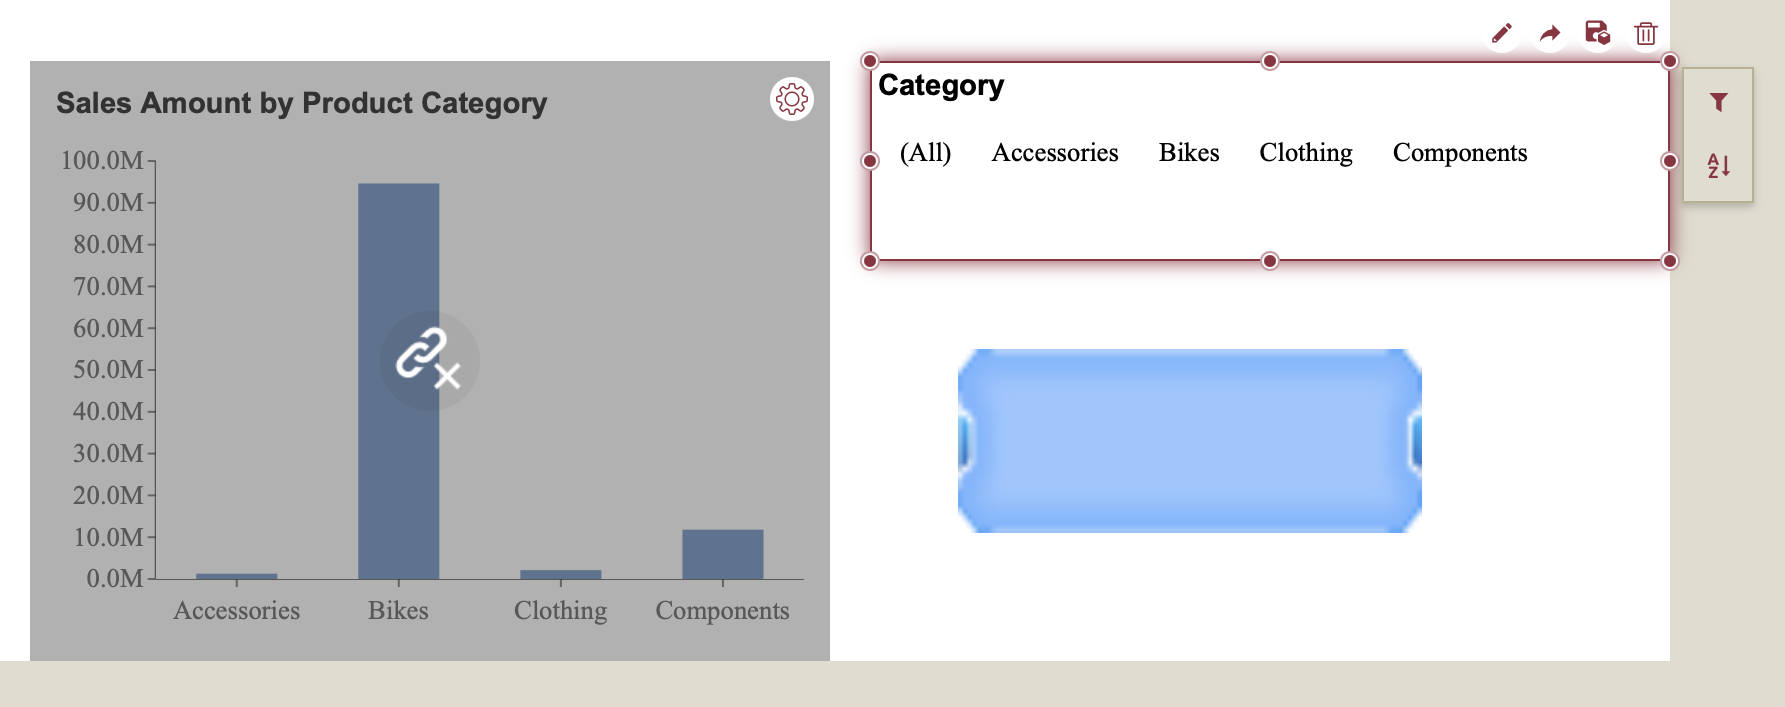
4. Disable Cross-filtering
Disable cross-filtering by selecting the label slicer and clicking on the link button on the bottom ribbon.  Click on the link on the chart to disable cross-filtering.
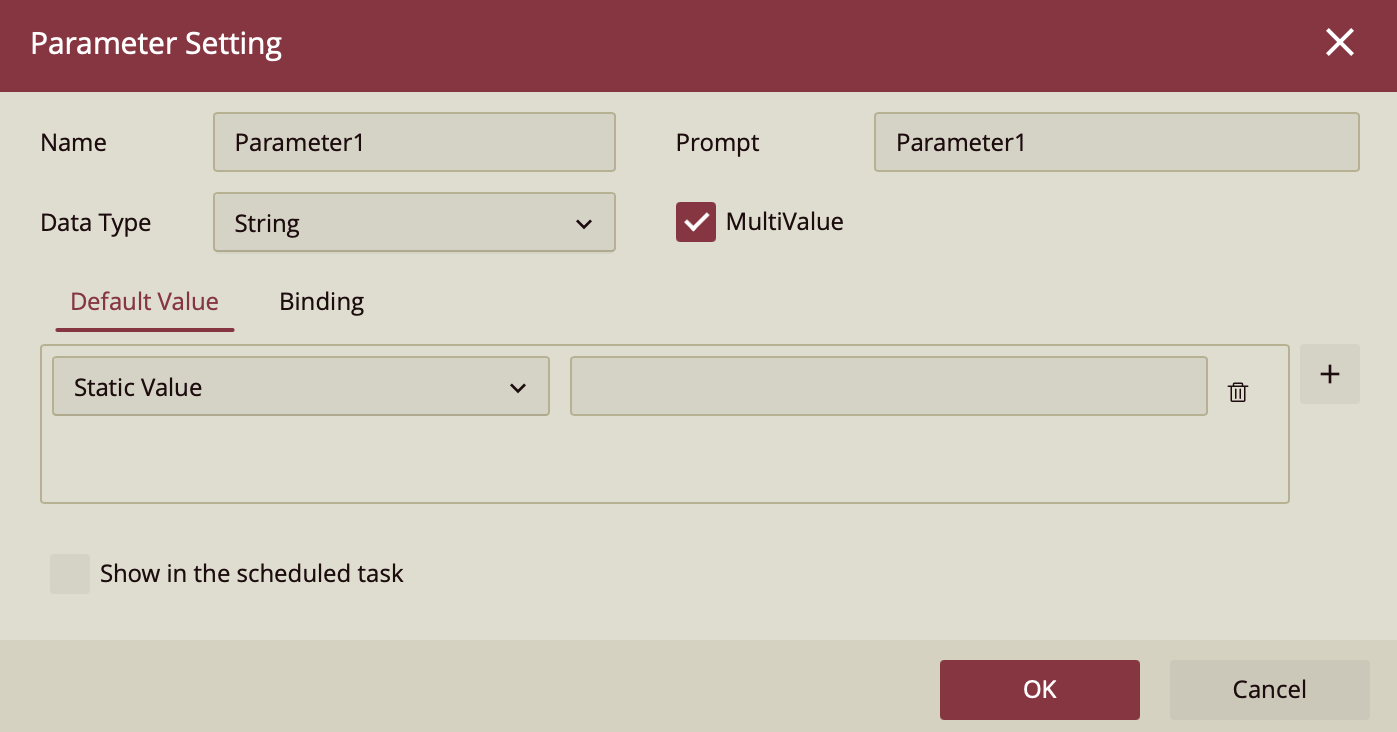
5. Add Parameter
Click anywhere on the canvas (not on a scenario) to open the dashboard settings on the right-hand menu. Click the + button next to the Parameters property to add a parameter. Set your parameter value to String and select MultiValue.
6. Filter by Parameter
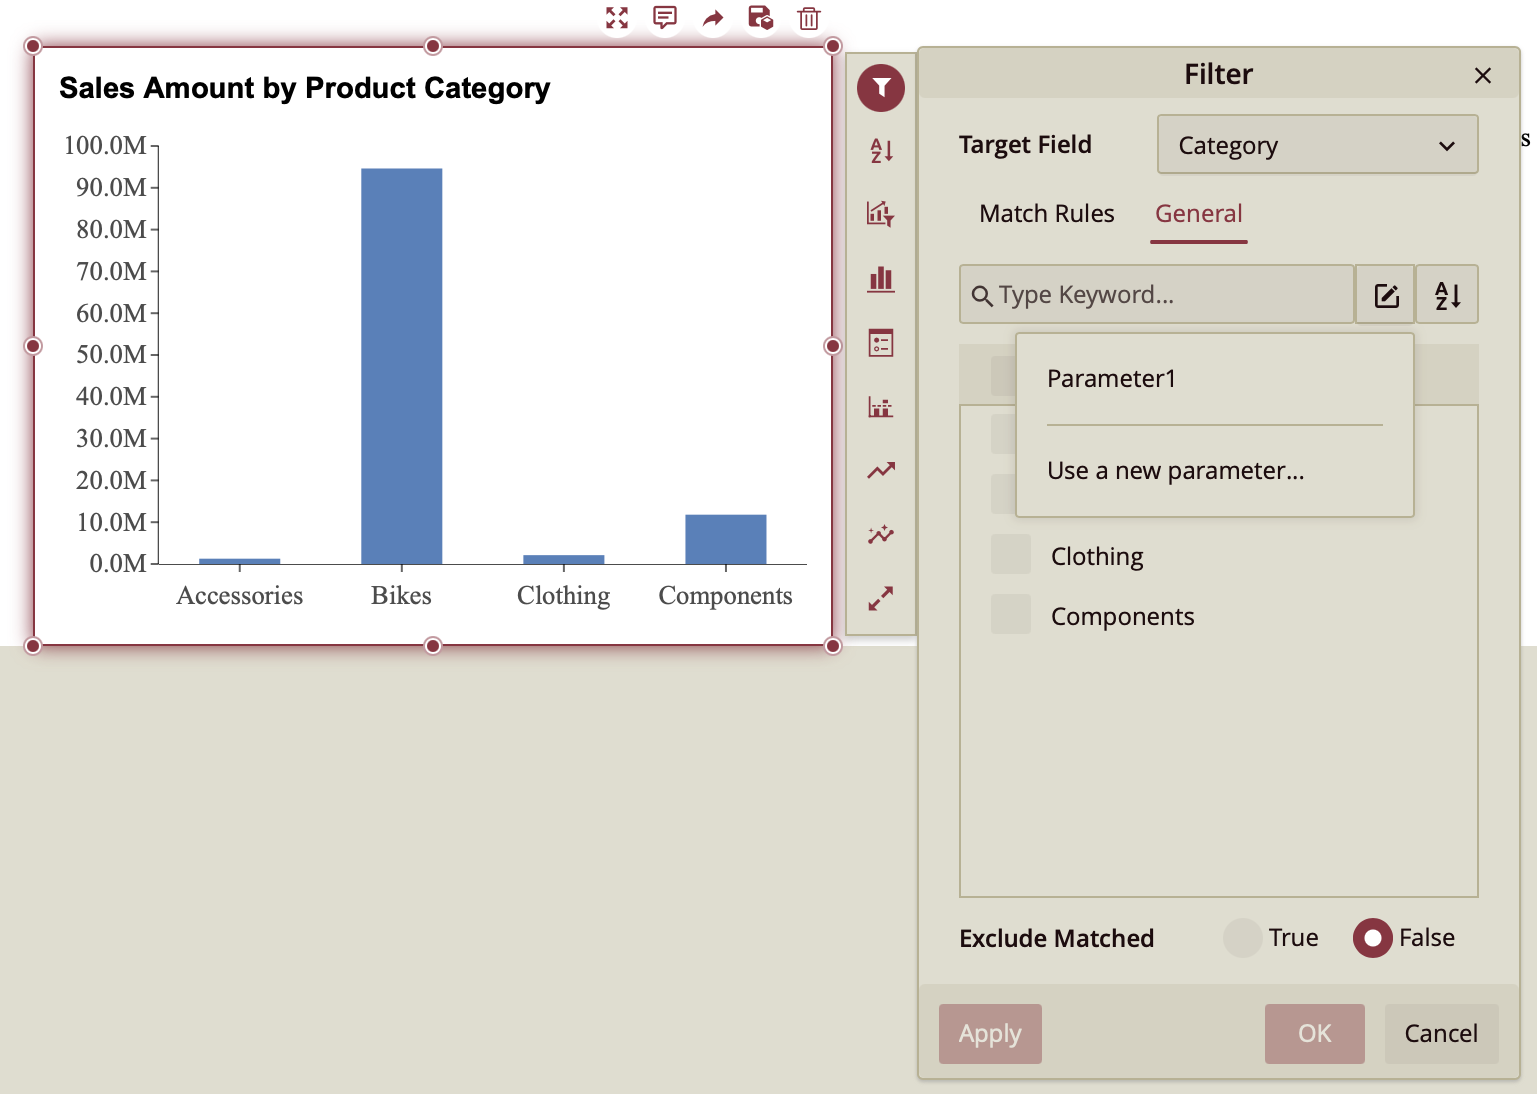
Filter the chart by your parameter. Click on the chart and locate the Filter button, from where you choose the General tab to select your parameter from the dropdown.
7. Add Command to Image
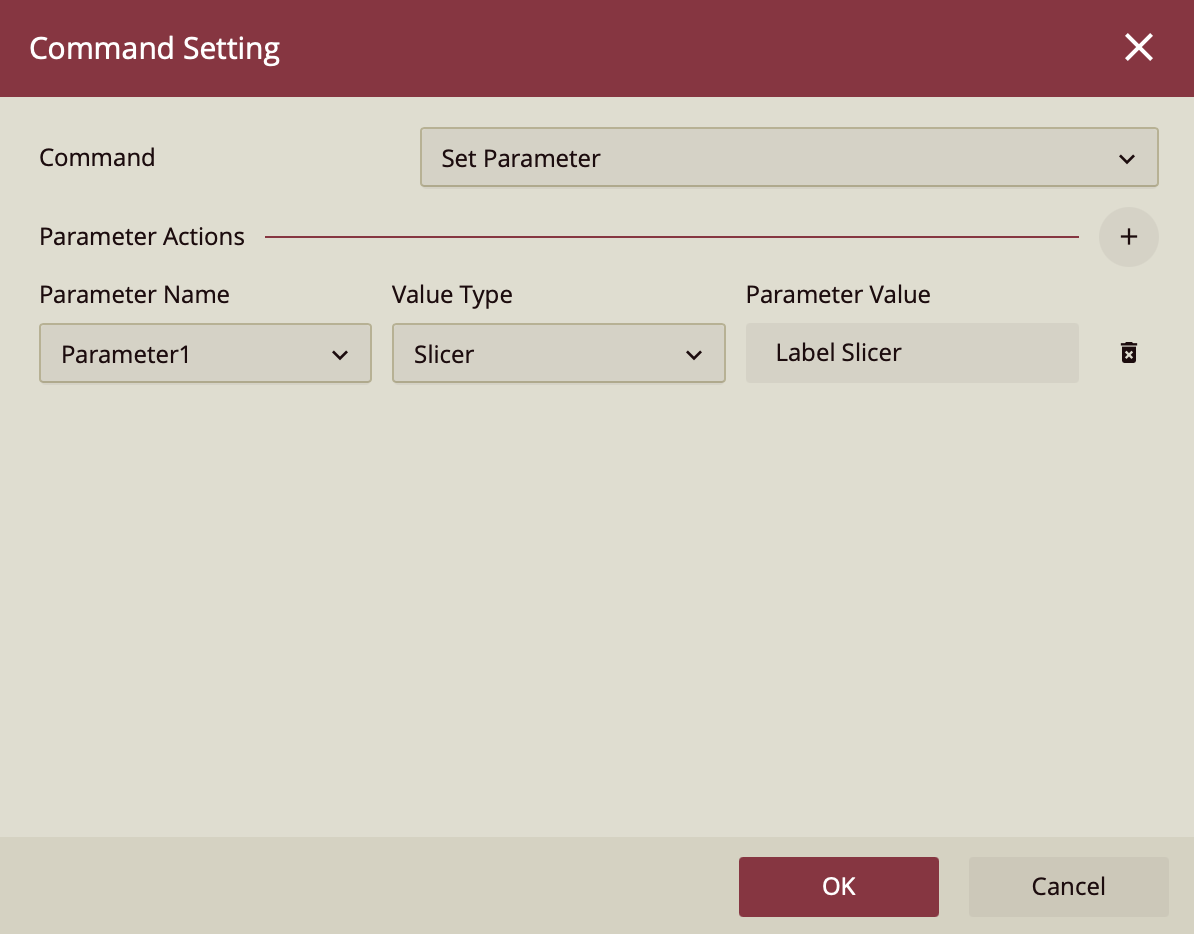
Next, select the image to open the image properties in the Inspector Panel. Under the Interaction group of properties, open the dropdown next to Click Action and select Command to create an image command. Next to the Command property, click +. In the Command Setting window, set the Value Type to Slicer and set the Parameter Value to Label Slicer.
8. Preview the Dashboard
Preview your dashboard. Click on the slicer to select the categories you would like to filter for, and then click the image to apply the filter.