-
Interactive DashboardsCreate interactive BI dashboards with dynamic visuals.
-
End-User BI ReportsCreate and deploy enterprise BI reports for use in any vertical.
-
Wyn AlertsSet up always-on threshold notifications and alerts.
-
Localization SupportChange titles, labels, text explanations, and more.
-
Wyn ArchitectureA lightweight server offers flexible deployment.
-
 Wyn Enterprise 7.1 is ReleasedThis release emphasizes Wyn document embedding and enhanced analytical express...
 -
 Choosing an Embedded BI Solution for SaaS ProvidersAdding BI features to your applications will improve your products, better serve your customers, and more. But where to start? In this guide, we discuss the many options.
-
Visual GalleryInteractive sample dashboards and reports.
-
BlogExplore Wyn, BI trends, and more.
-
WebinarsDiscover live and on-demand webinars.
-
Customer SuccessVisualize operational efficiency and streamline manufacturing processes.
-
Knowledge BaseGet quick answers with articles and guides.
-
VideosVideo tutorials, trends and best practices.
-
WhitepapersDetailed reports on the latest trends in BI.
-
 Choosing an Embedded BI Solution for SaaS ProvidersAdding BI features to your applications will impr...
 -

- Getting Started
- Administration Guide
-
User Guide
- An Introduction to Wyn Enterprise
- Document Portal for End Users
- Data Governance and Modeling
- View and Manage Documents
- Working with Resources
- Working with Reports
- Working with Dashboards
- Working with Notebooks
- Wyn Analytical Expressions
- Section 508 Compliance
- Subscribe to RSS Feed for Wyn Builds Site
- Developer Guide
Simple Report using Chart Wizard
Chart Wizard in Wyn Enterprise is used to design a report containing charts. By using the chart wizard, you can create a report with a chart in three simple steps.
Select Data Set and Chart Type.
Column Settings including Data Values, Data Categories, and Data Subcategories.
Preview and customize the appearance.
To use the Chart Wizard, you need to first enable it from the Admin portal >> Configuration >> WynReports Settings >> Designer Settings >> Enable Chart Wizard.
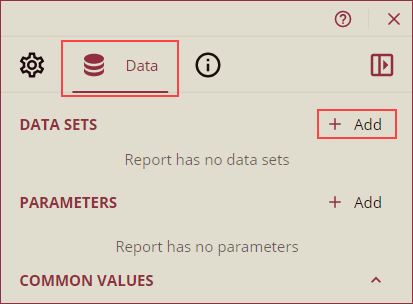
Navigate to the Report Designer page and bind a dataset to the report from the Data panel on the right side of the designer. See the Data Binding in Reports help doc for information on binding data to a report.
Now, follow the instructions below to use the Chart Wizard.
From the report toolbar, drag and drop the chart control onto the design area or click the chart control button. Chart Wizard will appear on your screen.
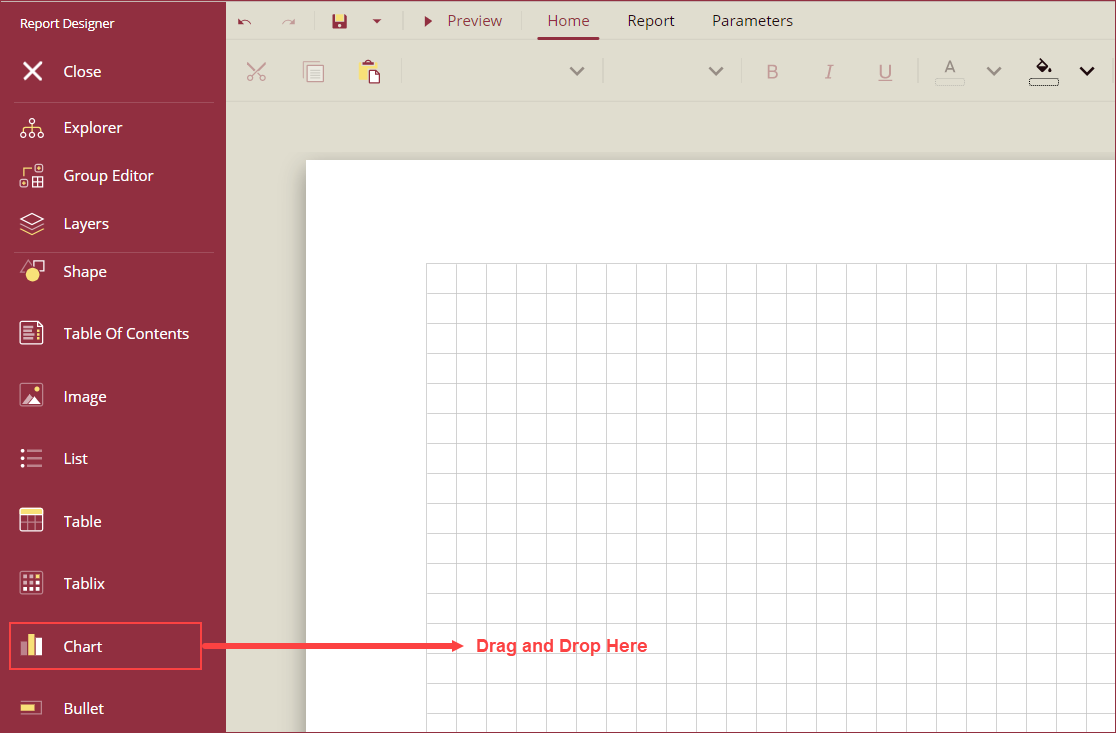
Note: Chart Wizard opens only when a dataset is bound to the report before adding the chart.
Use the Chart Wizard to create a report containing charts in a three-step process as described below:
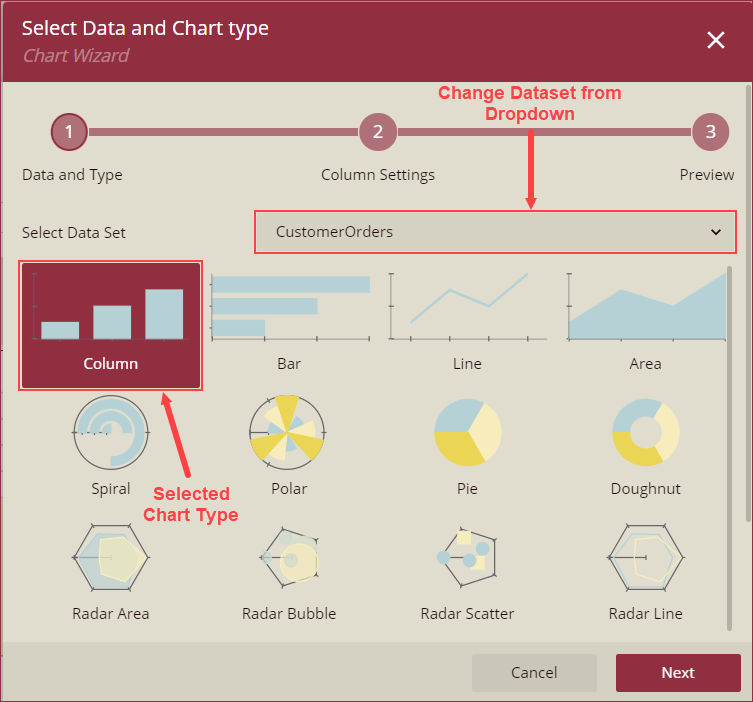
i) Data and Type: In this step, the dataset bound to the report appears in the Select Data Set dropdown by default. To change the dataset, use the Select Data Set dropdown and select a Chart Type from the following chart types:
Column, Bar, Line, Area, Spiral, Polar, Pie, Doughnut, Radar Area, Radar Bubble, Radar Scatter, Radar Line, Pyramid, Funnel, Bubble, Scatter, Gantt, Candlestick, High Low Close, High Low Open Close, Range Area, Range Bar, Range Column, and Gauge.
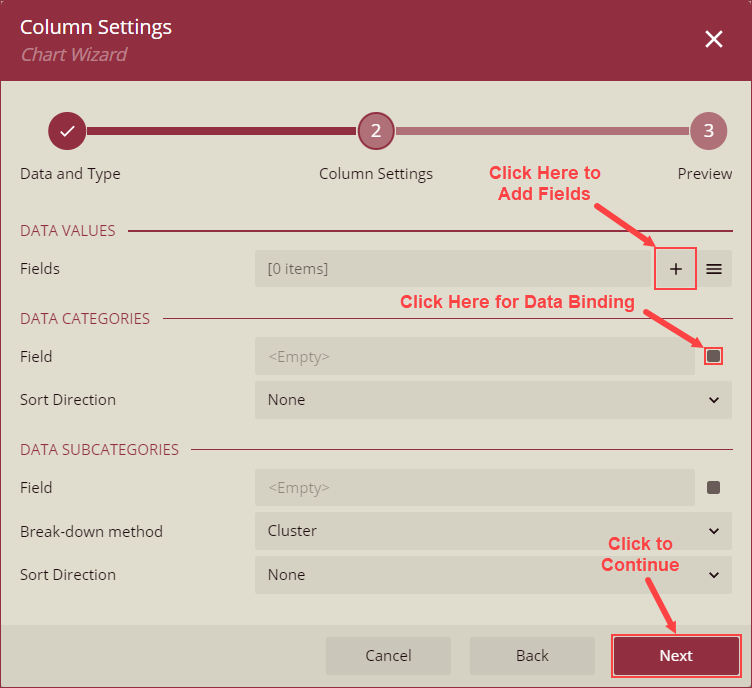
ii) Settings: The Settings of the chart wizard are divided into three parts: Data Values, Data Categories, and Data Subcategories. The Settings of all chart types are listed and described in the Chart Settings section of this help article.
iii) Preview: On the Preview step, you can preview a sample layout of the chart. Use the Select chart palette dropdown to select a color palette for the chart. You can also use the Advanced Customization options, such as Area, Header, X axis, Y axis, Plot Settings, and Footer, to further customize the chart. Using the Advanced Customization options opens the settings in the Property grid on the report designer. Click the Finish button to add the chart to the report.
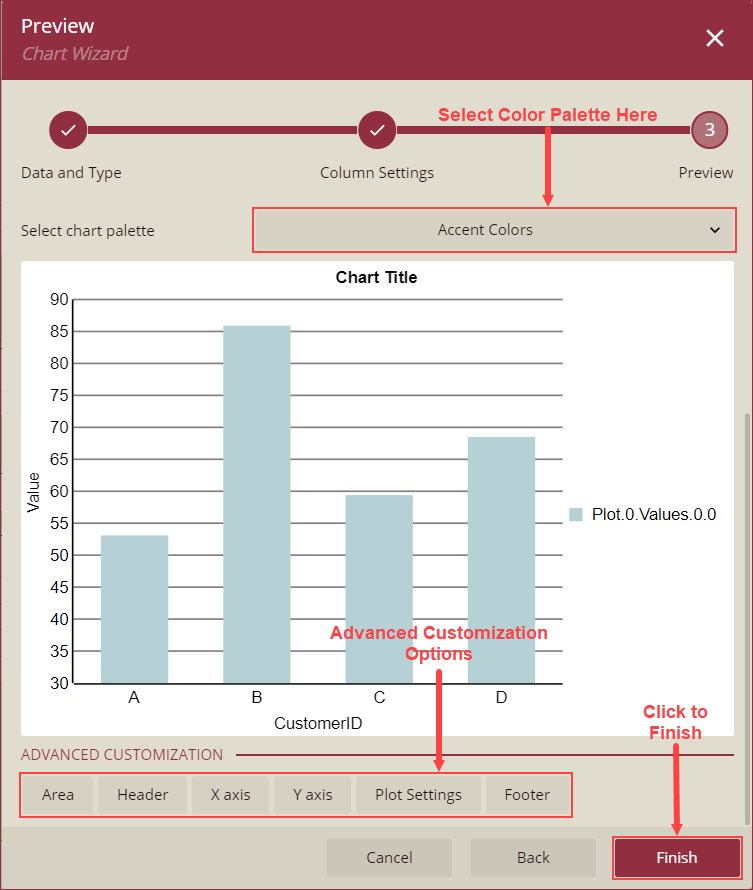
Chart Settings
Column, Bar, Area, Spiral, Polar, Radar Area, Radar Line, Range Area, Range Bar, and Range Column Charts
Data Values
Setting | Description |
|---|---|
Fields | Use the + button to add custom value fields (Y-axis) to the chart and select an aggregation option from the Aggregate dropdown. |
Data Categories
Setting | Description |
|---|---|
Field | Enter a custom category field or use the square box to bind a field to the chart. |
Sort Direction | Select a sort direction from the dropdown. The available options are None, Ascending, and Descending. |
Data Subcategories
Setting | Description |
|---|---|
Field | Enter a custom subcategory category field or use the square box to bind a field to the chart. |
breakdown Method | Select a breakdown method for the selected chart. The available options are Cluster, Stack, and Percentage Stack. |
Sort Direction | Select a sort direction from the dropdown. The available options are None, Ascending, and Descending. |
Line, Radar Area, and Radar Line Charts
Data Values
Setting | Description |
|---|---|
Fields | Use the + button to add custom value fields (Y-axis) to the chart and select an aggregation option from the Aggregate dropdown. |
Data Categories
Setting | Description |
|---|---|
Field | Enter a custom category field or use the square box to bind a field to the chart. |
Sort Direction | Select a sort direction from the dropdown. The available options are None, Ascending, and Descending. |
Data Subcategories
Setting | Description |
|---|---|
Field | Enter a custom subcategory category field or use the square box to bind a field to the chart. |
Sort Direction | Select a sort direction from the dropdown. The available options are None, Ascending, and Descending. |
Pie, Doughnut, Pyramid, and Funnel Charts
Data Values
Setting | Description |
|---|---|
Fields | Use the + button to add custom value fields (Y-axis) to the chart and select an aggregation option from the Aggregate dropdown. |
Data Categories
Setting | Description |
|---|---|
Field | Enter a custom category field or use the square box to bind a field to the chart. |
Break-down Method | Select a breakdown method for the selected chart. The available options are Cluster, Stack, and Percentage Stack. |
Sort Direction | Select a sort direction from the dropdown. The available options are None, Ascending, and Descending. |
Radar Bubble and Bubble Chart
Data Values
Setting | Description |
|---|---|
X Field | Enter the X coordinate using this property. |
Y Field | Enter the Y coordinate using this property. |
Size Field | Enter the bubble size using this property. |
Data Categories
Setting | Description |
|---|---|
Field | Enter a custom category field or use the square box to bind a field to the chart. |
Sort Direction | Select a sort direction from the dropdown. The available options are None, Ascending, and Descending. |
Radar Scatter and Scatter Charts
Data Values
Setting | Description |
|---|---|
X Field | Enter the X coordinate using this property. |
Y Field | Enter the Y coordinate using this property. |
Data Categories
Setting | Description |
|---|---|
Field | Enter a custom category field or use the square box to bind a field to the chart. |
Sort Direction | Select a sort direction from the dropdown. The available options are None, Ascending, and Descending. |
Gantt Chart
Data Values
Setting | Description |
|---|---|
Start Field | Enter a starting value or bind a dataset field to the Start Field property. |
End Field | Enter an ending value or bind a dataset field to the End Field property. |
Data Categories
Setting | Description |
|---|---|
Field | Enter a custom category field or use the square box to bind a field to the chart. |
Sort Direction | Select a sort direction from the dropdown. The available options are None, Ascending, and Descending. |
Data Subcategories
Setting | Description |
|---|---|
Field | Enter a custom subcategory category field or use the square box to bind a field to the chart. |
Sort Direction | Select a sort direction from the dropdown. The available options are None, Ascending, and Descending. |
Candlestick and High Low Open Close Chart
Data Values
Setting | Description |
|---|---|
High Field | Enter a value or bind a field to add a high value to the chart. |
Low Field | Enter a value or bind a field to add a low value to the chart. |
Open Field | Enter a value or bind a field to add an open value to the chart. |
Close Field | Enter a value or bind a field to add a close value to the chart. |
Data Categories
Setting | Description |
|---|---|
Field | Enter a custom category field or use the square box to bind a field to the chart. |
Sort Direction | Select a sort direction from the dropdown. The available options are None, Ascending, and Descending. |
High Low Close Chart
Data Values
Setting | Description |
|---|---|
High Field | Enter a value or bind a field using the square box to add a high value to the chart. |
Low Field | Enter a value or bind a field using the square box to add a low value to the chart. |
Close Field | Enter a value or bind a field using the square box to add a close value to the chart. |
Data Categories
Setting | Description |
|---|---|
Field | Enter a custom category field or use the square box to bind a field to the chart. |
Sort Direction | Select a sort direction from the dropdown. The available options are None, Ascending, and Descending. |
Gauge Chart
Data Values
Setting | Description |
|---|---|
Fields | Use the + button to add custom value fields to the Gauge chart and select an aggregation option from the Aggregate dropdown. |
Gauge Pointer | Add a value or bind a field using the square box to display the gauge value. |
Gauge Label | Add a label to the gauge pointer using the Gauge Label property. |