System Diagnostic
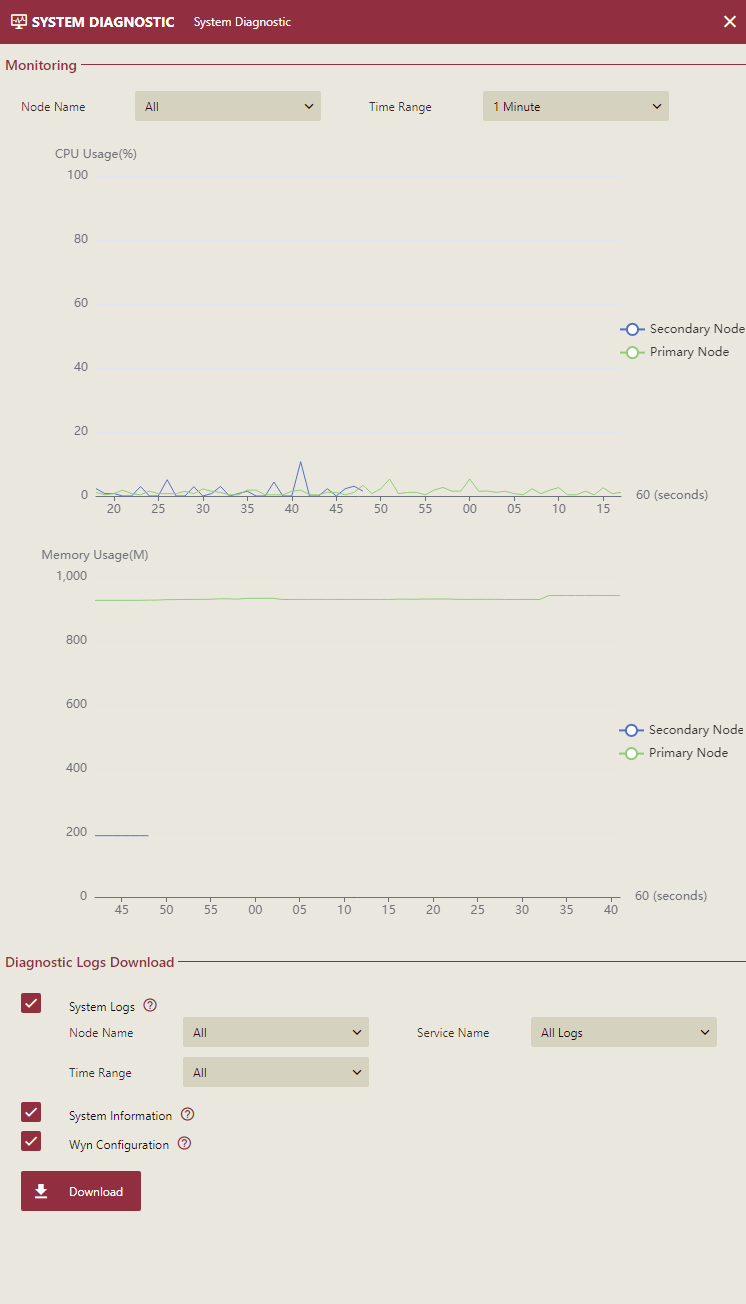
The System Diagnostic interface on the Admin Portal displays the run-time monitoring information regarding the performance for each node or service in the Wyn Enterprise environment. As an administrator, you no longer need to access the primary or the secondary (where the worker module is installed) machine to view its system diagnostic logs. Instead, you can download these logs directly through the System Diagnostic interface from where you are accessing the Wyn Enterprise. You can also download these logs for a specific time period or service. Apart from the system logs, you can also get the system-related information and the Wyn configuration file for the selected node.
View Monitoring Information
This section describes the steps to view the monitoring information such as the CPU usage and memory usage for a particular node. You can also get the monitoring information for a specific time duration.
On the Admin Portal, navigate to System Management > System Diagnostic.
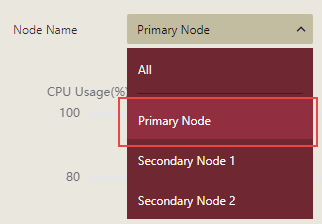
Under the Monitoring section, select the node for which you want to view the monitoring information. For example, set the Node Name to 'Primary Node'.
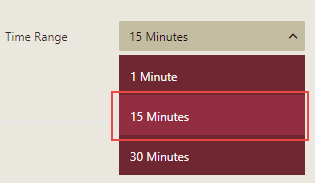
Specify the time duration for which you want to view the monitoring information such as 1 Minute, 15 Minutes, or 30 Minutes. In the below example, we set the Time Range to '15 Minutes'.
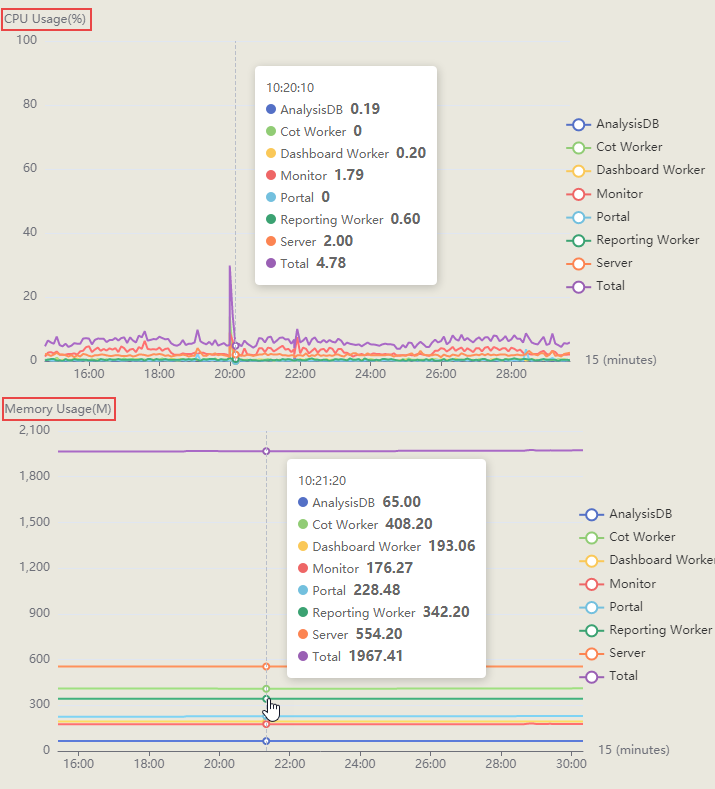
You can now view the monitoring information for each services available on the chosen node.
Download Diagnostic Logs
This section describes the steps to download the system diagnostic logs for the last month for a secondary server where the dashboard worker is installed.
On the Admin Portal, navigate to System Management > System Diagnostic.
Under the Diagnostic Logs Download section, check the System Logs option and then specify the node, service, and the time duration for which you want to download the diagnostic logs.
- Node Name - Specify the node name from the drop-down list for which you want to download the diagnostic logs.
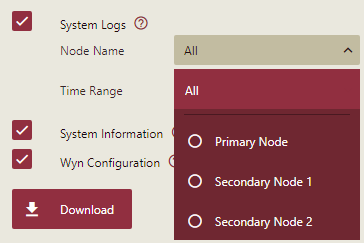
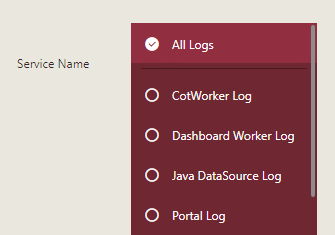
- Service Name - Choose the service name for which you want to download the diagnostic logs. Following are the supported services in Wyn Enterprise- CotWorker Log, Dashboard Worker Log, Java DataSource Log, Portal Log, Report Worker Log, Server Log, and System Log. By default, 'All Logs' is selected.
- Time Range - Select the time duration for which you want to download the diagnostic logs. The possible values for Time Range are All, Today, Last 1 Day, Last 7 Days, and Last 30 Days.
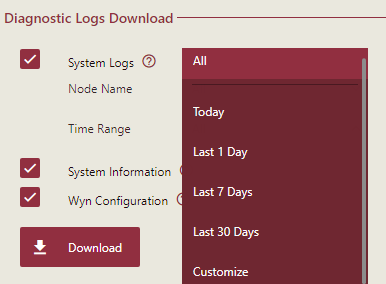
However, you can also download the logs for a custom time range by providing the start and the end date.

In the example below, we set the Node Name to 'Secondary Node 1', Service Name to 'Dashboard Worker Log', and Time Range to 'Last 30 Days'.

- Node Name - Specify the node name from the drop-down list for which you want to download the diagnostic logs.
Check the System Information option to download the system-related information such as the type of operating system and system version.

Check the Wyn Configuration option to download the desensitized Wyn configuration file.

Finally, click the Download button to get the system diagnostic information. The diagnostic logs are downloaded as a .zip file on your system.


