- Getting Started
- Administration Guide
-
User Guide
- An Introduction to Wyn Enterprise
- Document Portal for End Users
- Data Governance and Modeling
- Working with Resources
- Working with Reports
- Working with Dashboards
- View and Manage Documents
- Understanding Wyn Analytical Expressions
- Section 508 Compliance
- Subscribe to RSS Feed for Wyn Builds Site
- Developer Guide
Simple Report using Chart Wizard
Chart Wizard in Wyn Enterprise is used to design a report containing charts. By using the chart wizard, you can create a report with a chart in three simple steps,
Select Data Set and Chart Type.
Column Settings including Data Values, Data Categories, and Data Subcategories.
Preview and customize the appearance.
To use the Chart Wizard, you need to first enable it from the Admin portal >> Configuration >> WynReports Settings >> Designer Settings >> Enable Chart Wizard.
Navigate to the Report Designer page and bind a dataset to the report from the Data panel on the right side of the designer. See the Data Binding in Reports help doc for information on binding data to a report.
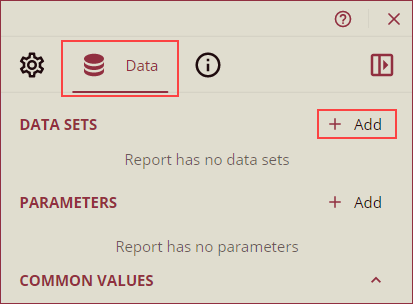
Now, follow the below instructions to use the Chart Wizard,
From the report toolbar, drag and drop the chart control onto the design area or click the chart control button. Chart Wizard will appear on your screen.
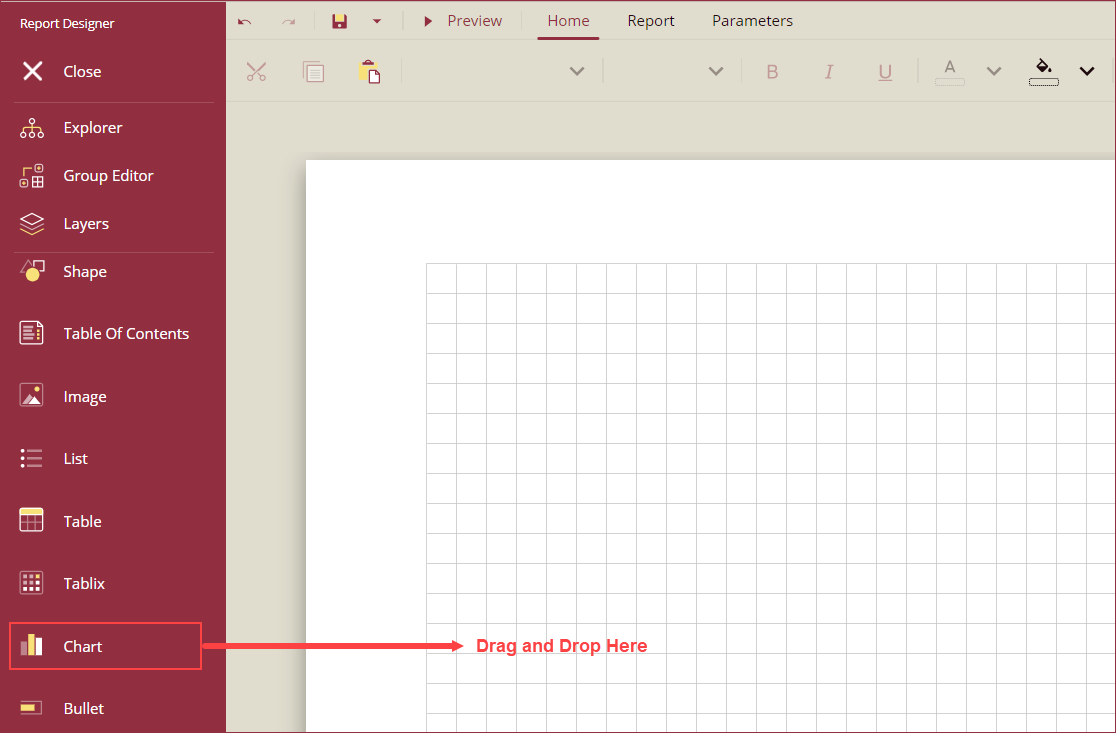
Note: Chart Wizard opens only when a dataset is bound to the report before adding the chart. Semantic models are not supported with Chart Wizard.
Use the Chart Wizard to create a report containing charts in a three step process as described below,
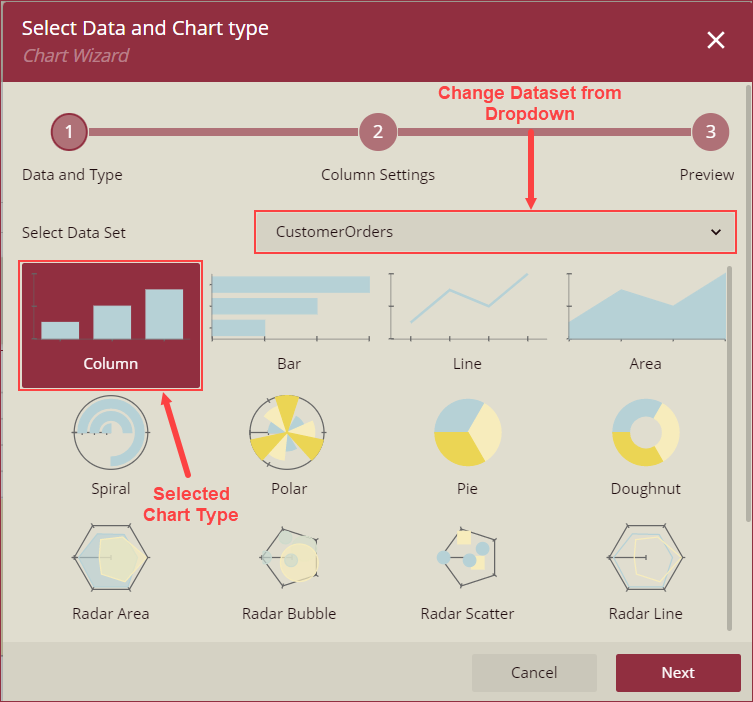
i) Data and Type: In this step, the dataset bound to the report appears in the Select Data Set dropdown by default. To change the dataset, use the Select Data Set dropdown and select a Chart Type from the following chart types:
Column, Bar, Line, Area, Spiral, Polar, Pie, Doughnut, Radar Area, Radar Bubble, Radar Scatter, Radar Line, Pyramid, Funnel, Bubble, Scatter, Gantt, Candlestick, High Low Close, High Low Open Close, Range Area, Range Bar, Range Column, and Gauge.
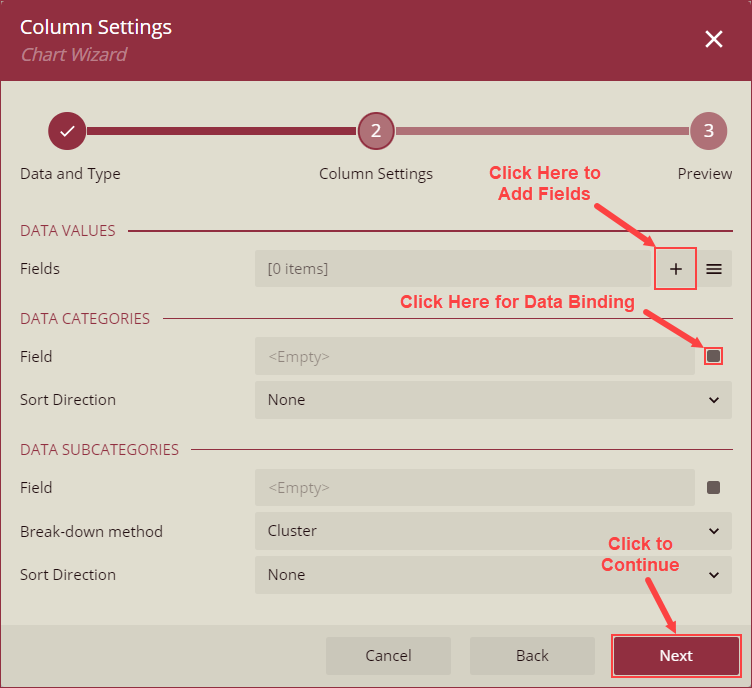
ii) Settings: The Settings of the chart wizard are divided into three parts: Data Values, Data Categories, and Data Subcategories. The Settings of all chart types are listed and described in the Chart Settings section of this help article.
iii) Preview: On the Preview step, you can preview a sample layout of the chart. Use the Select chart palette dropdown to select a color palette for the chart. You can also use the Advanced Customization options such as Area, Header, X axis, Y axis, Plot Settings, and Footer to further customize the chart. Using the Advanced Customization options opens the setting in the Property grid on the report designer. Click the Finish button to add the chart to the report.
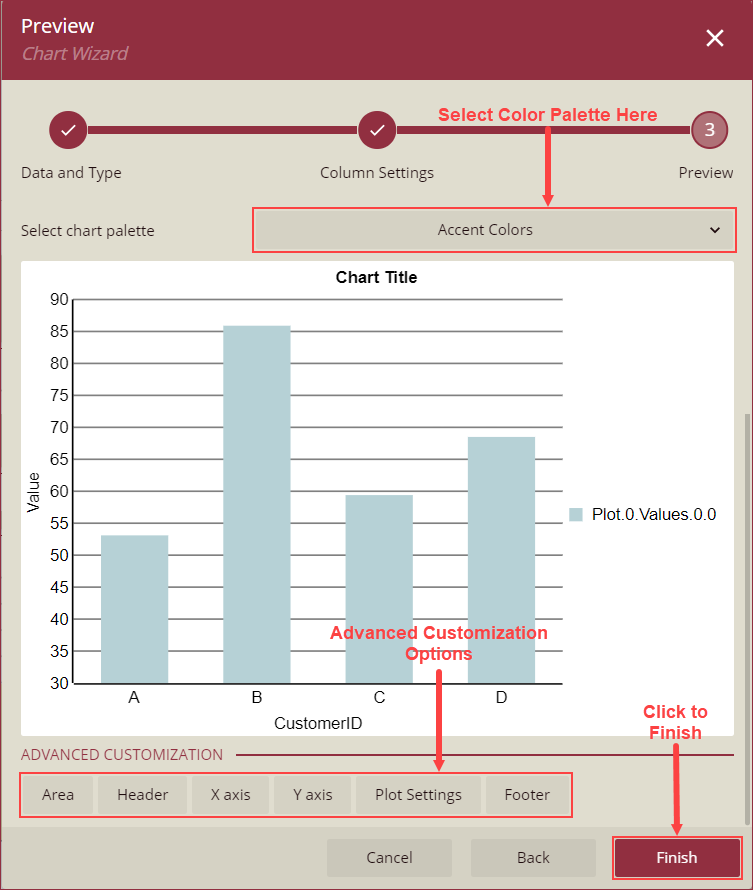
Chart Settings
Column, Bar, Area, Spiral, Polar, Radar Area, Radar Line, Range Area, Range Bar, and Range Column Charts
Data Values
Setting | Description |
|---|---|
Fields | Use the + button to add custom value fields (Y-axis) to the chart and select an aggregation option from the Aggregate dropdown. |
Data Categories
Setting | Description |
|---|---|
Field | Enter a custom category field or use the square box to bind a field to the chart. |
Sort Direction | Select a sort direction from the dropdown. The available options are None, Ascending, and Descending. |
Data Subcategories
Setting | Description |
|---|---|
Field | Enter a custom subcategory category field or use the square box to bind a field to the chart. |
breakdown Method | Select a breakdown method for the selected chart. The available options are Cluster, Stack, and Percentage Stack. |
Sort Direction | Select a sort direction from the dropdown. The available options are None, Ascending, and Descending. |
Line, Radar Area, and Radar Line Charts
Data Values
Setting | Description |
|---|---|
Fields | Use the + button to add custom value fields (Y-axis) to the chart and select an aggregation option from the Aggregate dropdown. |
Data Categories
Setting | Description |
|---|---|
Field | Enter a custom category field or use the square box to bind a field to the chart. |
Sort Direction | Select a sort direction from the dropdown. The available options are None, Ascending, and Descending. |
Data Subcategories
Setting | Description |
|---|---|
Field | Enter a custom subcategory category field or use the square box to bind a field to the chart. |
Sort Direction | Select a sort direction from the dropdown. The available options are None, Ascending, and Descending. |
Pie, Doughnut, Pyramid and Funnel Charts
Data Values
Setting | Description |
|---|---|
Fields | Use the + button to add custom value fields (Y-axis) to the chart and select an aggregation option from the Aggregate dropdown. |
Data Categories
Setting | Description |
|---|---|
Field | Enter a custom category category field or use the square box to bind a field to the chart. |
Break-down Method | Select a breakdown method for the selected chart. The available options are Cluster, Stack, and Percentage Stack. |
Sort Direction | Select a sort direction from the dropdown. The available options are None, Ascending, and Descending. |
Radar Bubble and Bubble Chart
Data Values
Setting | Description |
|---|---|
X Field | Enter the X coordinate using this property. |
Y Field | Enter the Y coordinate using this property. |
Size Field | Enter the bubble size using this property. |
Data Categories
Setting | Description |
|---|---|
Field | Enter a custom category category field or use the square box to bind a field to the chart. |
Sort Direction | Select a sort direction from the dropdown. The available options are None, Ascending, and Descending. |
Radar Scatter and Scatter Charts
Data Values
Setting | Description |
|---|---|
X Field | Enter the X coordinate using this property. |
Y Field | Enter the Y coordinate using this property. |
Data Categories
Setting | Description |
|---|---|
Field | Enter a custom category category field or use the square box to bind a field to the chart. |
Sort Direction | Select a sort direction from the dropdown. The available options are None, Ascending, and Descending. |
Gantt Chart
Data Values
Setting | Description |
|---|---|
Start Field | Enter a starting value or bind a dataset field to the Start Field property. |
End Field | Enter an ending value or bind a dataset field to the End Field property. |
Data Categories
Setting | Description |
|---|---|
Field | Enter a custom category category field or use the square box to bind a field to the chart. |
Sort Direction | Select a sort direction from the dropdown. The available options are None, Ascending, and Descending. |
Data Subcategories
Setting | Description |
|---|---|
Field | Enter a custom subcategory category field or use the square box to bind a field to the chart. |
Sort Direction | Select a sort direction from the dropdown. The available options are None, Ascending, and Descending. |
Candlestick and High Low Open Close Chart
Data Values
Setting | Description |
|---|---|
High Field | Enter a value or bind a field to add a high value to the chart. |
Low Field | Enter a value or bind a field to add a low value to the chart. |
Open Field | Enter a value or bind a field to add an open value to the chart. |
Close Field | Enter a value or bind a field to add a close value to the chart. |
Data Categories
Setting | Description |
|---|---|
Field | Enter a custom category category field or use the square box to bind a field to the chart. |
Sort Direction | Select a sort direction from the dropdown. The available options are None, Ascending, and Descending. |
High Low Close Chart
Data Values
Setting | Description |
|---|---|
High Field | Enter a value or bind a field using the square box to add a high value to the chart. |
Low Field | Enter a value or bind a field using the square box to add a low value to the chart. |
Close Field | Enter a value or bind a field using the square box to add a close value to the chart. |
Data Categories
Setting | Description |
|---|---|
Field | Enter a custom category category field or use the square box to bind a field to the chart. |
Sort Direction | Select a sort direction from the dropdown. The available options are None, Ascending, and Descending. |
Gauge Chart
Data Values
Setting | Description |
|---|---|
Fields | Use the + button to add custom value fields to the Gauge chart and select an aggregation option from the Aggregate dropdown. |
Gauge Pointer | Add a value or bind a field using the square box to display the gauge value. |
Gauge Label | Add a label to the gauge pointer using the Gauge Label property. |


