- Getting Started
- Administration Guide
-
User Guide
- An Introduction to Wyn Enterprise
- Document Portal for End Users
- Data Governance and Modeling
- Working with Resources
- Working with Reports
-
Working with Dashboards
- Dashboard Designer
- Selecting a Dataset
- Data Attributes
- Dashboard Scenarios
- Dashboard Templates
- Component Templates
- 3D Scene
- Explorer
- Visualization Wizard
- Data Analysis and Interactivity
- Dashboard Appearance
- Preview Dashboard
- Export Dashboard
- Dashboard Lite Viewer
- Using Dashboard Designer
- Animating Dashboard Components
- Document Binder
- Dashboard Insights
- View and Manage Documents
- Understanding Wyn Analytical Expressions
- Section 508 Compliance
- Subscribe to RSS Feed for Wyn Builds Site
- Developer Guide
Path Layer
You can show the trajectory of things on the map, such as logistics and transportation. The trajectory diagram displays each point during the operation and describes the movement process in detail. For example, the trajectory of the stations passed by trains, city bus routes, etc. These scenarios can all be displayed using Path Layer.
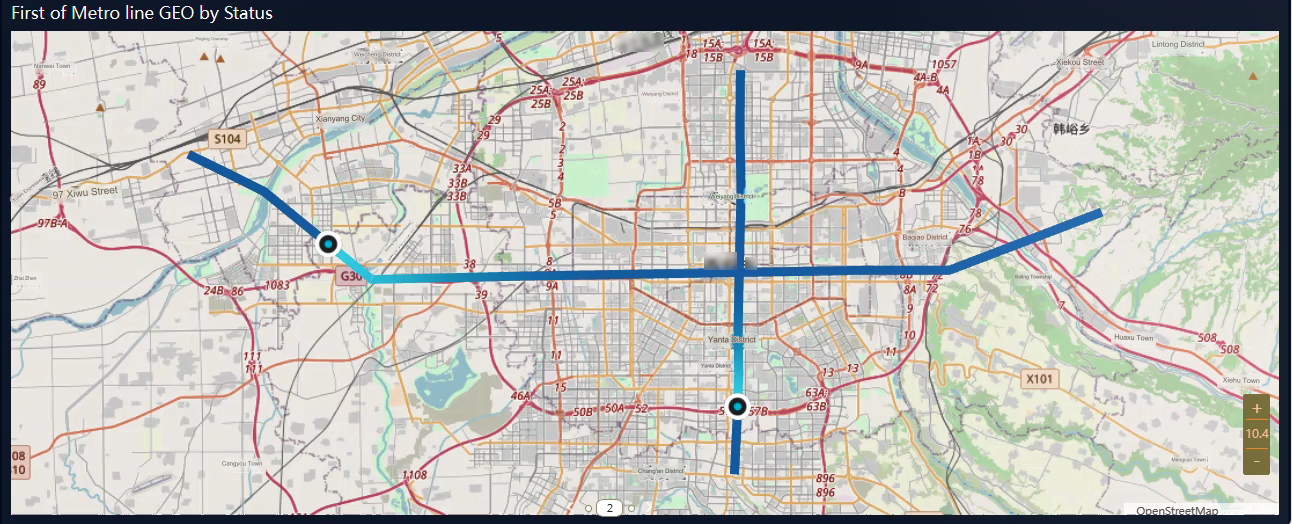
Add a Path Layer
A Path Layer does not have a separate component, it is a layer contained in a Combined map. So if you want to use a Path Layer, you need to add a Combined map first and then add a Path Layer to it.
Perform the following steps to add a Path Layer
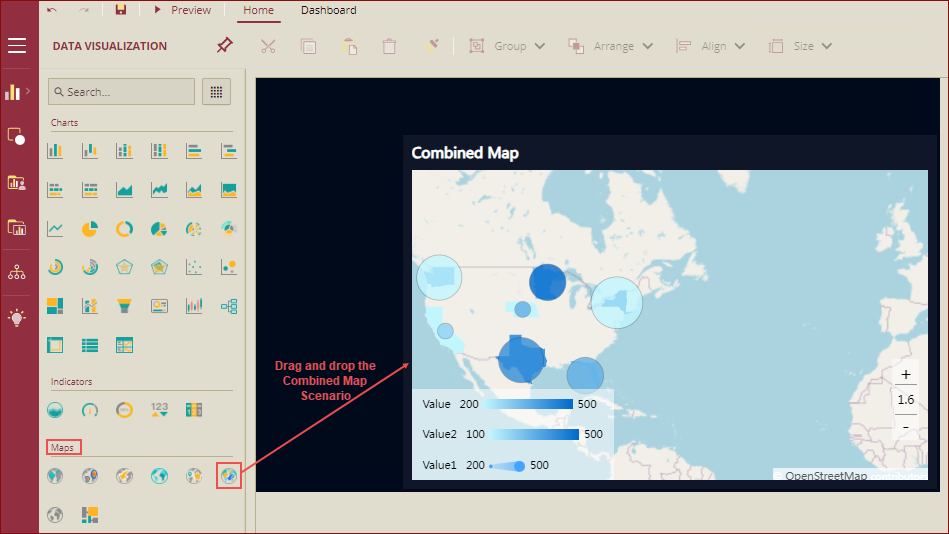
Navigate to the Data Visualization tools and drag and drop the Combined Map scenario onto the dashboard designer area.
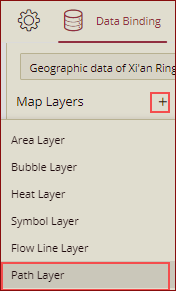
In the map field binding area, click the plus icon
 , and select Path Layer to add a path layer.
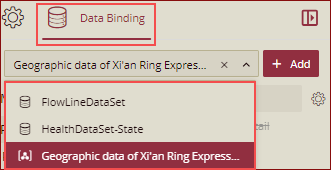
With the combined map scenario selected, navigate to the Data Binding panel. Click the Add button, and the Choose Data dialog box is displayed. Select a dataset and click the OK button.
The selected dataset will be added to the dropdown list. Select the dataset to bind to the scenario. When the dataset loads successfully, the data binding panel automatically expands and displays the data attributes available for data binding.
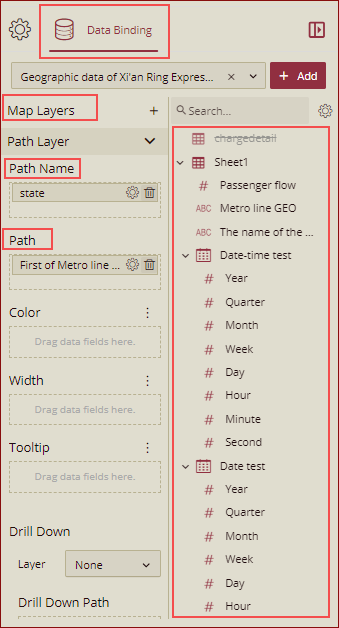
Expand the layer data settings to add data binding to the layer. Drag and drop the appropriate data fields to the binding area that meets the specifications to complete the data binding.
The map will be displayed according to the data. You can customize the map settings and preview it.
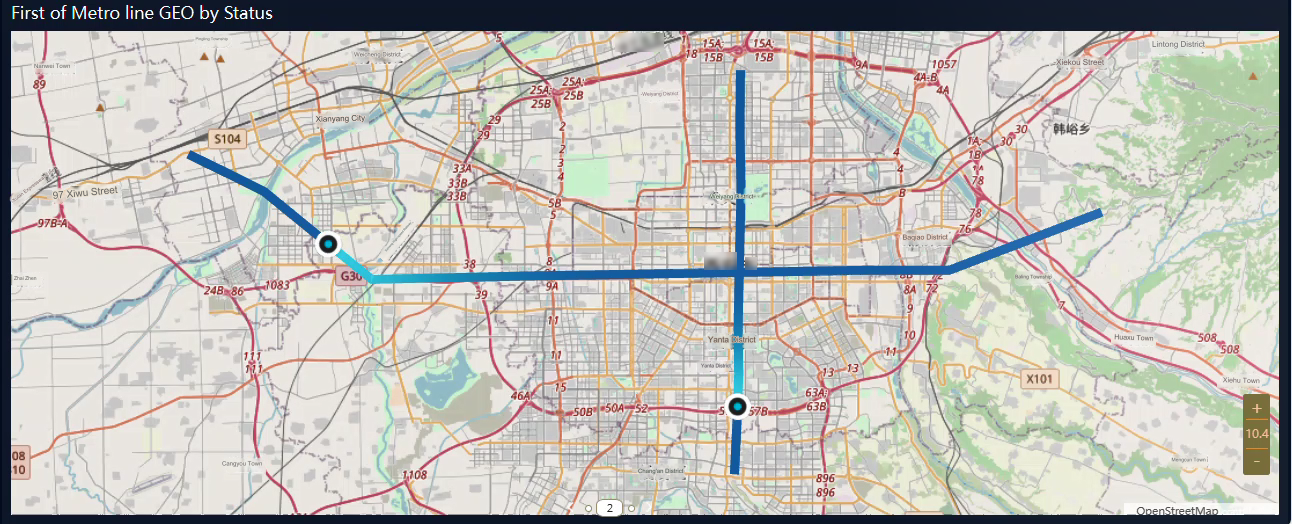
Listed below in the table are the data binding fields and their description.
Data Binding Field | Description |
|---|---|
Path Name | Bind a field to mark the path name. |
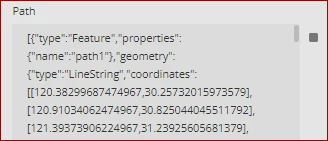
Path | Data in a special format that depicts the path by the values of the data. It can only accept GeoJson's LineString type feature's JSON string. |
Color | You can bind a field, and the color of the path will represent the size of the data. It can accept First or other value aggregation methods(sum, max, min). |
Width | You can bind a field, and the width of the path will represent the size of the data. It can accept the value aggregation method(sum, max, min). |
Tooltip | A hint label is a tooltip that appears when the mouse is moved over the graphic. |
Drill Down | Drill down behavior is supported when using location as geographic data. If you want to implement data drill down, then bind the location data that has a drill down relationship with the location information. |
Customize Path Layer Style and Settings
You can customize the path layer setting for the Combined map. On the Inspector tab, under the Map Setting, you can see the Path Layer.
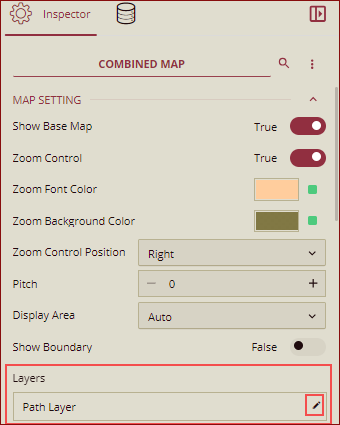
Click the pencil icon against the path layer to edit the layer's style. The layer editing screen is displayed.
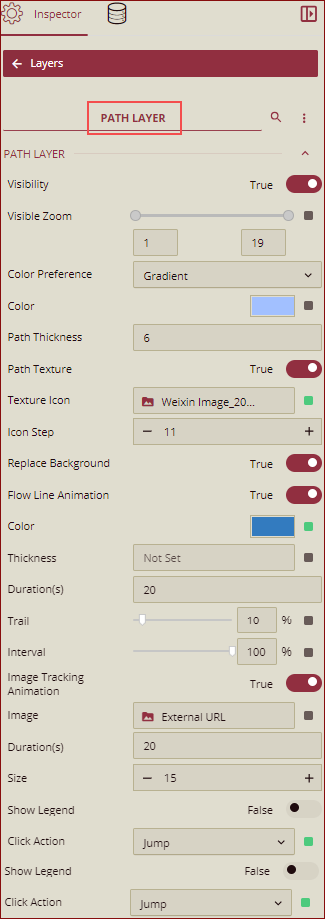
Listed below in the table are the layer editor properties.
Property | Description |
|---|---|
Visibility | Controls the visibility of the path layer. By default, it is set to True. |
Visible Zoom | Controls the visible zoom level range. The default range is between 1 to 19. |
Color Preference | Select the Palette or Gradient option from the dropdown as the color preference of the layer path. By default, the Gradient option is selected. |
Color | If you do not bind the Color field in the data binding area, use this option to configure the path line's color. Select the color from the color picker to set the color of the path. |
Path | If you do not bind the Path field in the data binding area, then you can give a static geoJson path string. The schema is GeoJson's "LineString" type features. |
Path Thickness | Sets the thickness of the path. It is displayed if you do not bind the Width field. |
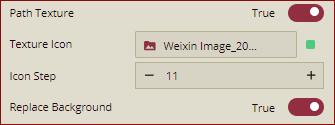
Path Texture. | This configures the background texture for the line path. Path Texture: Set it to True to show the path texture. BY default, it is set to False. Texture Icon: It is an image picker. You can select an image to set an icon for the path. Icon Step: It is the texture's icon step. Replace Background: It decides whether the background will be completely covered or not. BY default, it is set to False. |
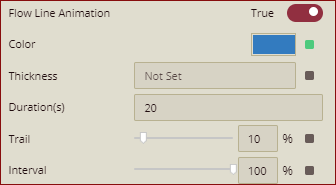
Flow Line Animation | It configures flow line animation. Set it to True, to show the flow line animation. |
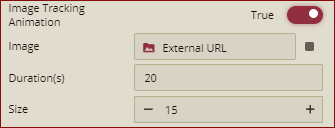
Image Tracking Animation | It configures image tracking animation. Set it to True, to show the image tracking animation. |
Show Legend | It controls whether to show a legend or not. Set it to True, to show the legend on the path layer. |
Click Action | Select None, Show Tooltip, Keep, Exclude, Drill Down, Jump, or Command option from the dropdown to perform an action on click. |
Limitations
The path layer does not support Drill Down, Carousel, and Conditional Format.


 .
.