-
Interactive DashboardsCreate interactive BI dashboards with dynamic visuals.
-
End-User BI ReportsCreate and deploy enterprise BI reports for use in any vertical.
-
Wyn AlertsSet up always-on threshold notifications and alerts.
-
Localization SupportChange titles, labels, text explanations, and more.
-
Wyn ArchitectureA lightweight server offers flexible deployment.
-
 Wyn Enterprise 7.1 is ReleasedThis release emphasizes Wyn document embedding and enhanced analytical express...
 -
 Choosing an Embedded BI Solution for SaaS ProvidersAdding BI features to your applications will improve your products, better serve your customers, and more. But where to start? In this guide, we discuss the many options.
-
Visual GalleryInteractive sample dashboards and reports.
-
BlogExplore Wyn, BI trends, and more.
-
WebinarsDiscover live and on-demand webinars.
-
Customer SuccessVisualize operational efficiency and streamline manufacturing processes.
-
Knowledge BaseGet quick answers with articles and guides.
-
VideosVideo tutorials, trends and best practices.
-
WhitepapersDetailed reports on the latest trends in BI.
-
 Choosing an Embedded BI Solution for SaaS ProvidersAdding BI features to your applications will impr...
 -

- Getting Started
- Administration Guide
-
User Guide
- An Introduction to Wyn Enterprise
- Document Portal for End Users
- Data Governance and Modeling
- View and Manage Documents
- Working with Resources
- Working with Reports
- Working with Dashboards
- Working with Notebooks
- Wyn Analytical Expressions
- Section 508 Compliance
- Subscribe to RSS Feed for Wyn Builds Site
- Developer Guide
Cluster Setting
Cluster Setting helps you to decide whether the bubble map will show the cluster points or not. When using a map with Geographic Coordinates (Latitude and Longitude) for visualizing data on a map, sometimes the number of data points is too much to show as individual points. You can use the Show Cluster property, to group multiple data points into clustered data points. You can expand the groups to individual points by zooming in on the map area. By default, this property is set to False. When this property is set to True, bubble size represents the number of data points within the clustered point, and the number of data points represented by cluster is displayed as a data label for cluster data points. So, the number displayed in the center of the cluster, shows the number of data points included in that cluster. Zoom in the map, the cluster point can be split into several smaller cluster points. You can style the data points using the shapes and apply clustering.
Apply Cluster Setting in Bubble Map
To add cluster setting in Bubble Map to your dashboard scenario, follow the below instructions,
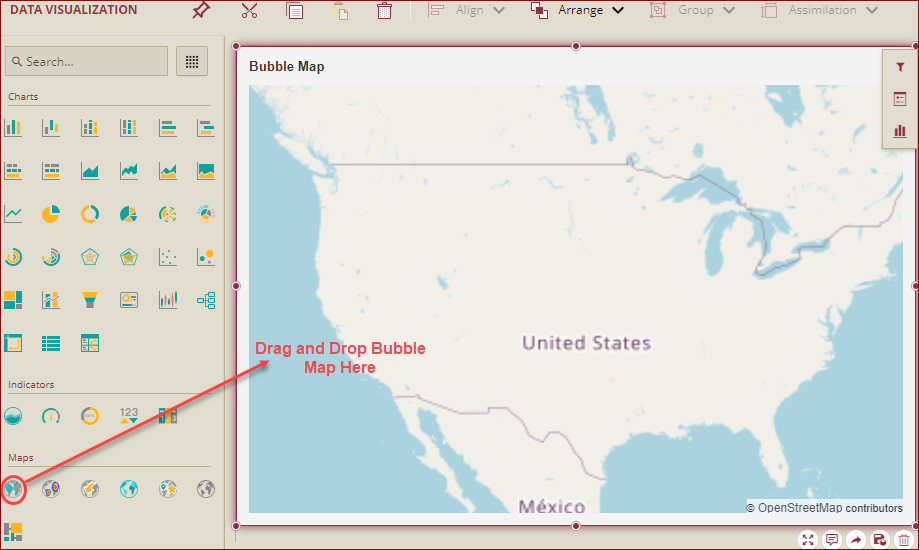
Navigate to the Data Visualization tools and drag and drop the Bubble Map scenario onto the dashboard designer area.
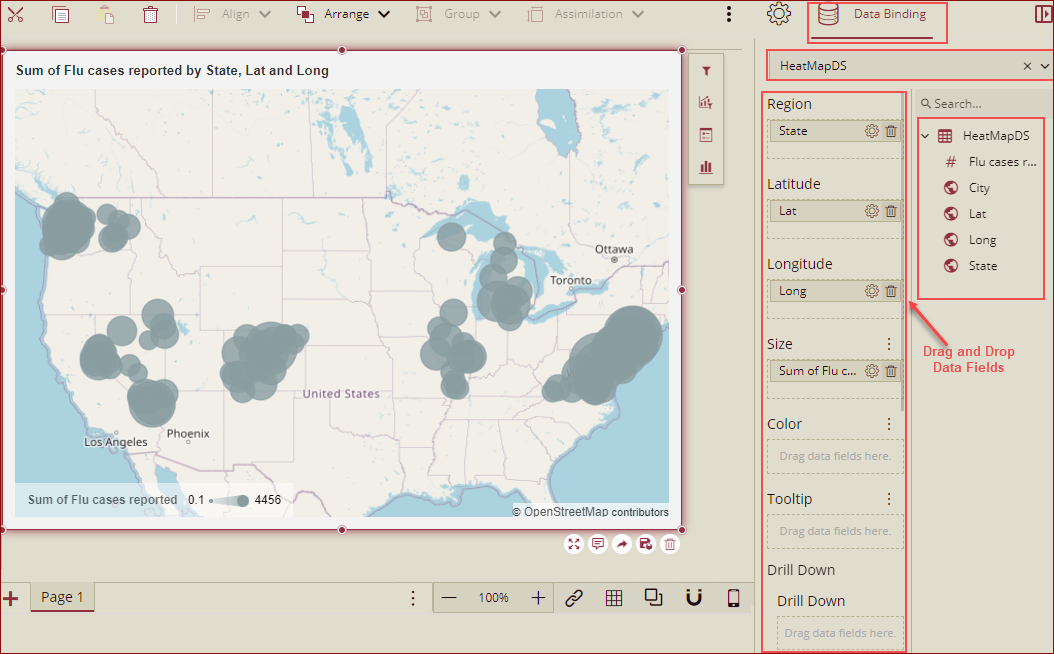
Select a dataset from the Data Binding tab with the bubble map scenario selected to bind to the scenario. Drag and drop the appropriate data fields in the Latitude and Longitude data containers. Drag and drop other appropriate fields in the Size, Color, Tooltip, and Drill Down data fields as well. See the help article on the Drill Down feature for more information on drilling into hierarchical data.
From the Inspector Panel properties on the right side of the dashboard designer window, you can view the Cluster Setting. Under the Cluster Setting, you can see the Show Cluster property. By default, this property is set to False. When the Show Cluster property is set to True, the bubble size represents the group's points number, and it can show the "points number" label for the "cluster" point. Zoom in the map, the cluster point can be split into several smaller "cluster" points.
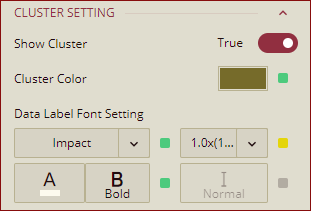
When Show Cluster is set to True, then you can see 2 more cluster properties:
Cluster Color: Select the color in which you want to show the clusters.
Data Label Font Setting: You can select the Font Type and Font Size from here. Please note, here the Font Style is disabled.
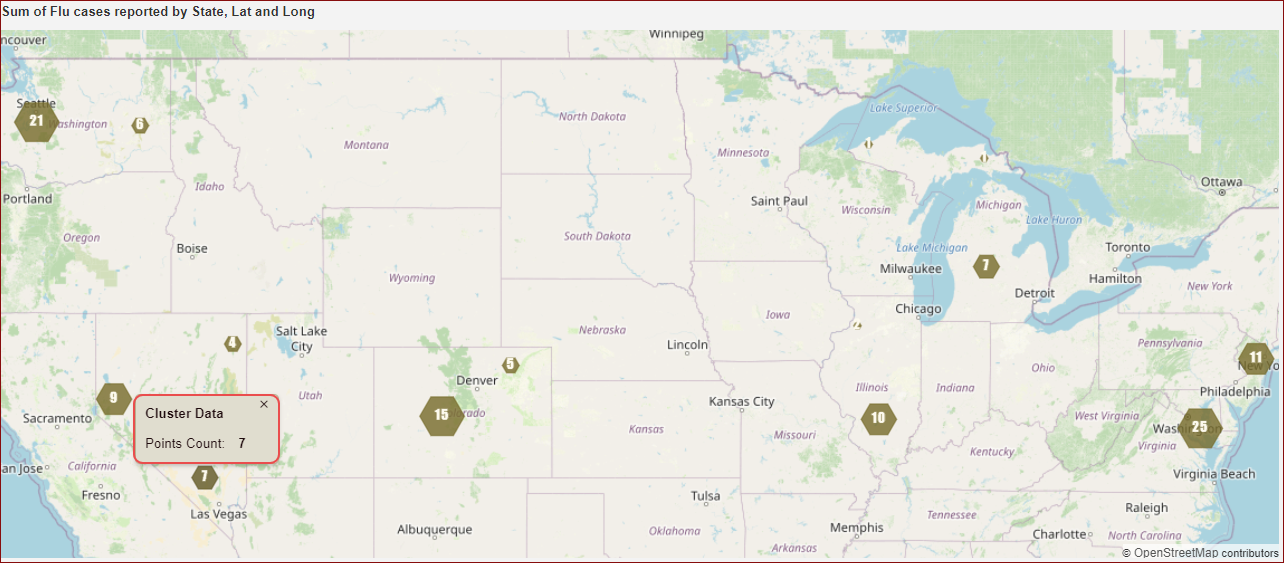
Now preview the dashboard. On preview:
If you hover over a cluster point that has several points, a tooltip can show Cluster Data as the title and show Point Count as shown below.
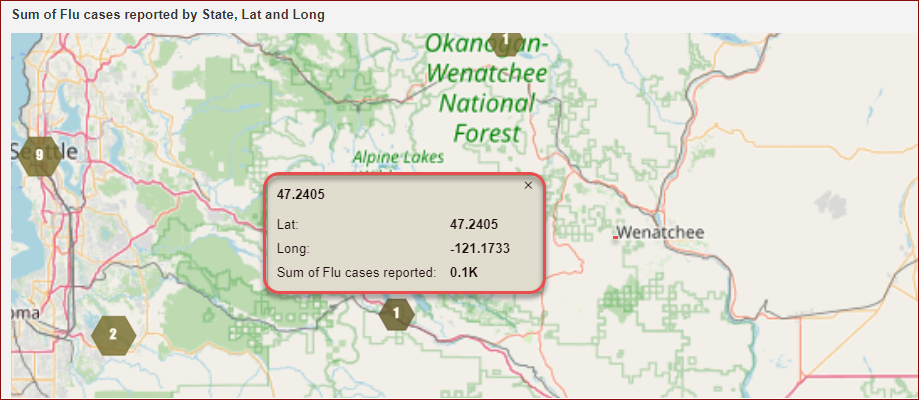
If you hover over a cluster point that only has one point, the tooltip shows the point's tooltip information, as shown below:
Limitations
As one cluster represents several individual points, so some abilities will be restricted if the Show Cluster property is set to True. Listed below are the limitations:
Can not cross filter when clicking Cluster point.
Can not add conditional format for the Cluster point.
Can not support drill down for the Cluster point.
The original data roles Size and Color will take no effect.
Legend and original data labels are not shown.
The carousel will not work.
Selection of data points is not possible, so operations dependent on selection like keep/exclude, and add data monitor cannot be applied on cluster.