-
Interactive DashboardsCreate interactive BI dashboards with dynamic visuals.
-
End-User BI ReportsCreate and deploy enterprise BI reports for use in any vertical.
-
Wyn AlertsSet up always-on threshold notifications and alerts.
-
Localization SupportChange titles, labels, text explanations, and more.
-
Wyn ArchitectureA lightweight server offers flexible deployment.
-
 Wyn Enterprise 7.1 is ReleasedThis release emphasizes Wyn document embedding and enhanced analytical express...
 -
 Choosing an Embedded BI Solution for SaaS ProvidersAdding BI features to your applications will improve your products, better serve your customers, and more. But where to start? In this guide, we discuss the many options.
-
Visual GalleryInteractive sample dashboards and reports.
-
BlogExplore Wyn, BI trends, and more.
-
WebinarsDiscover live and on-demand webinars.
-
Customer SuccessVisualize operational efficiency and streamline manufacturing processes.
-
Knowledge BaseGet quick answers with articles and guides.
-
VideosVideo tutorials, trends and best practices.
-
WhitepapersDetailed reports on the latest trends in BI.
-
 Choosing an Embedded BI Solution for SaaS ProvidersAdding BI features to your applications will impr...
 -

- Getting Started
- Administration Guide
-
User Guide
- An Introduction to Wyn Enterprise
- Document Portal for End Users
- Data Governance and Modeling
- View and Manage Documents
- Working with Resources
- Working with Reports
- Working with Dashboards
- Working with Notebooks
- Wyn Analytical Expressions
- Section 508 Compliance
- Subscribe to RSS Feed for Wyn Builds Site
- Developer Guide
Flow Line Map
The Flow Line Map scenario allows you to visualize flows or connections between two points on a map, such as traffic between cities or shipments between warehouses.
Example
The following map has been created using this native query dataset from the AdventureWorks Data Warehouse:
SELECT
    st.SalesTerritoryCountry AS OriginCountry,
    st.SalesTerritoryRegion AS OriginRegion,
    g.City AS DestinationCity,
    g.StateProvinceCode AS DestinationState,
    g.CountryRegionCode AS DestinationCountry,
    COUNT(f.SalesOrderNumber) AS OrderCount,
    SUM(f.SalesAmount) AS TotalSales
FROM
    FactInternetSales f
JOIN
    DimCustomer c ON f.CustomerKey = c.CustomerKey
JOIN
    DimGeography g ON c.GeographyKey = g.GeographyKey
JOIN
    DimSalesTerritory st ON f.SalesTerritoryKey = st.SalesTerritoryKey
GROUP BY
    st.SalesTerritoryCountry,
    st.SalesTerritoryRegion,
    g.City,
    g.StateProvinceCode,
    g.CountryRegionCode
ORDER BY
    TotalSales DESC;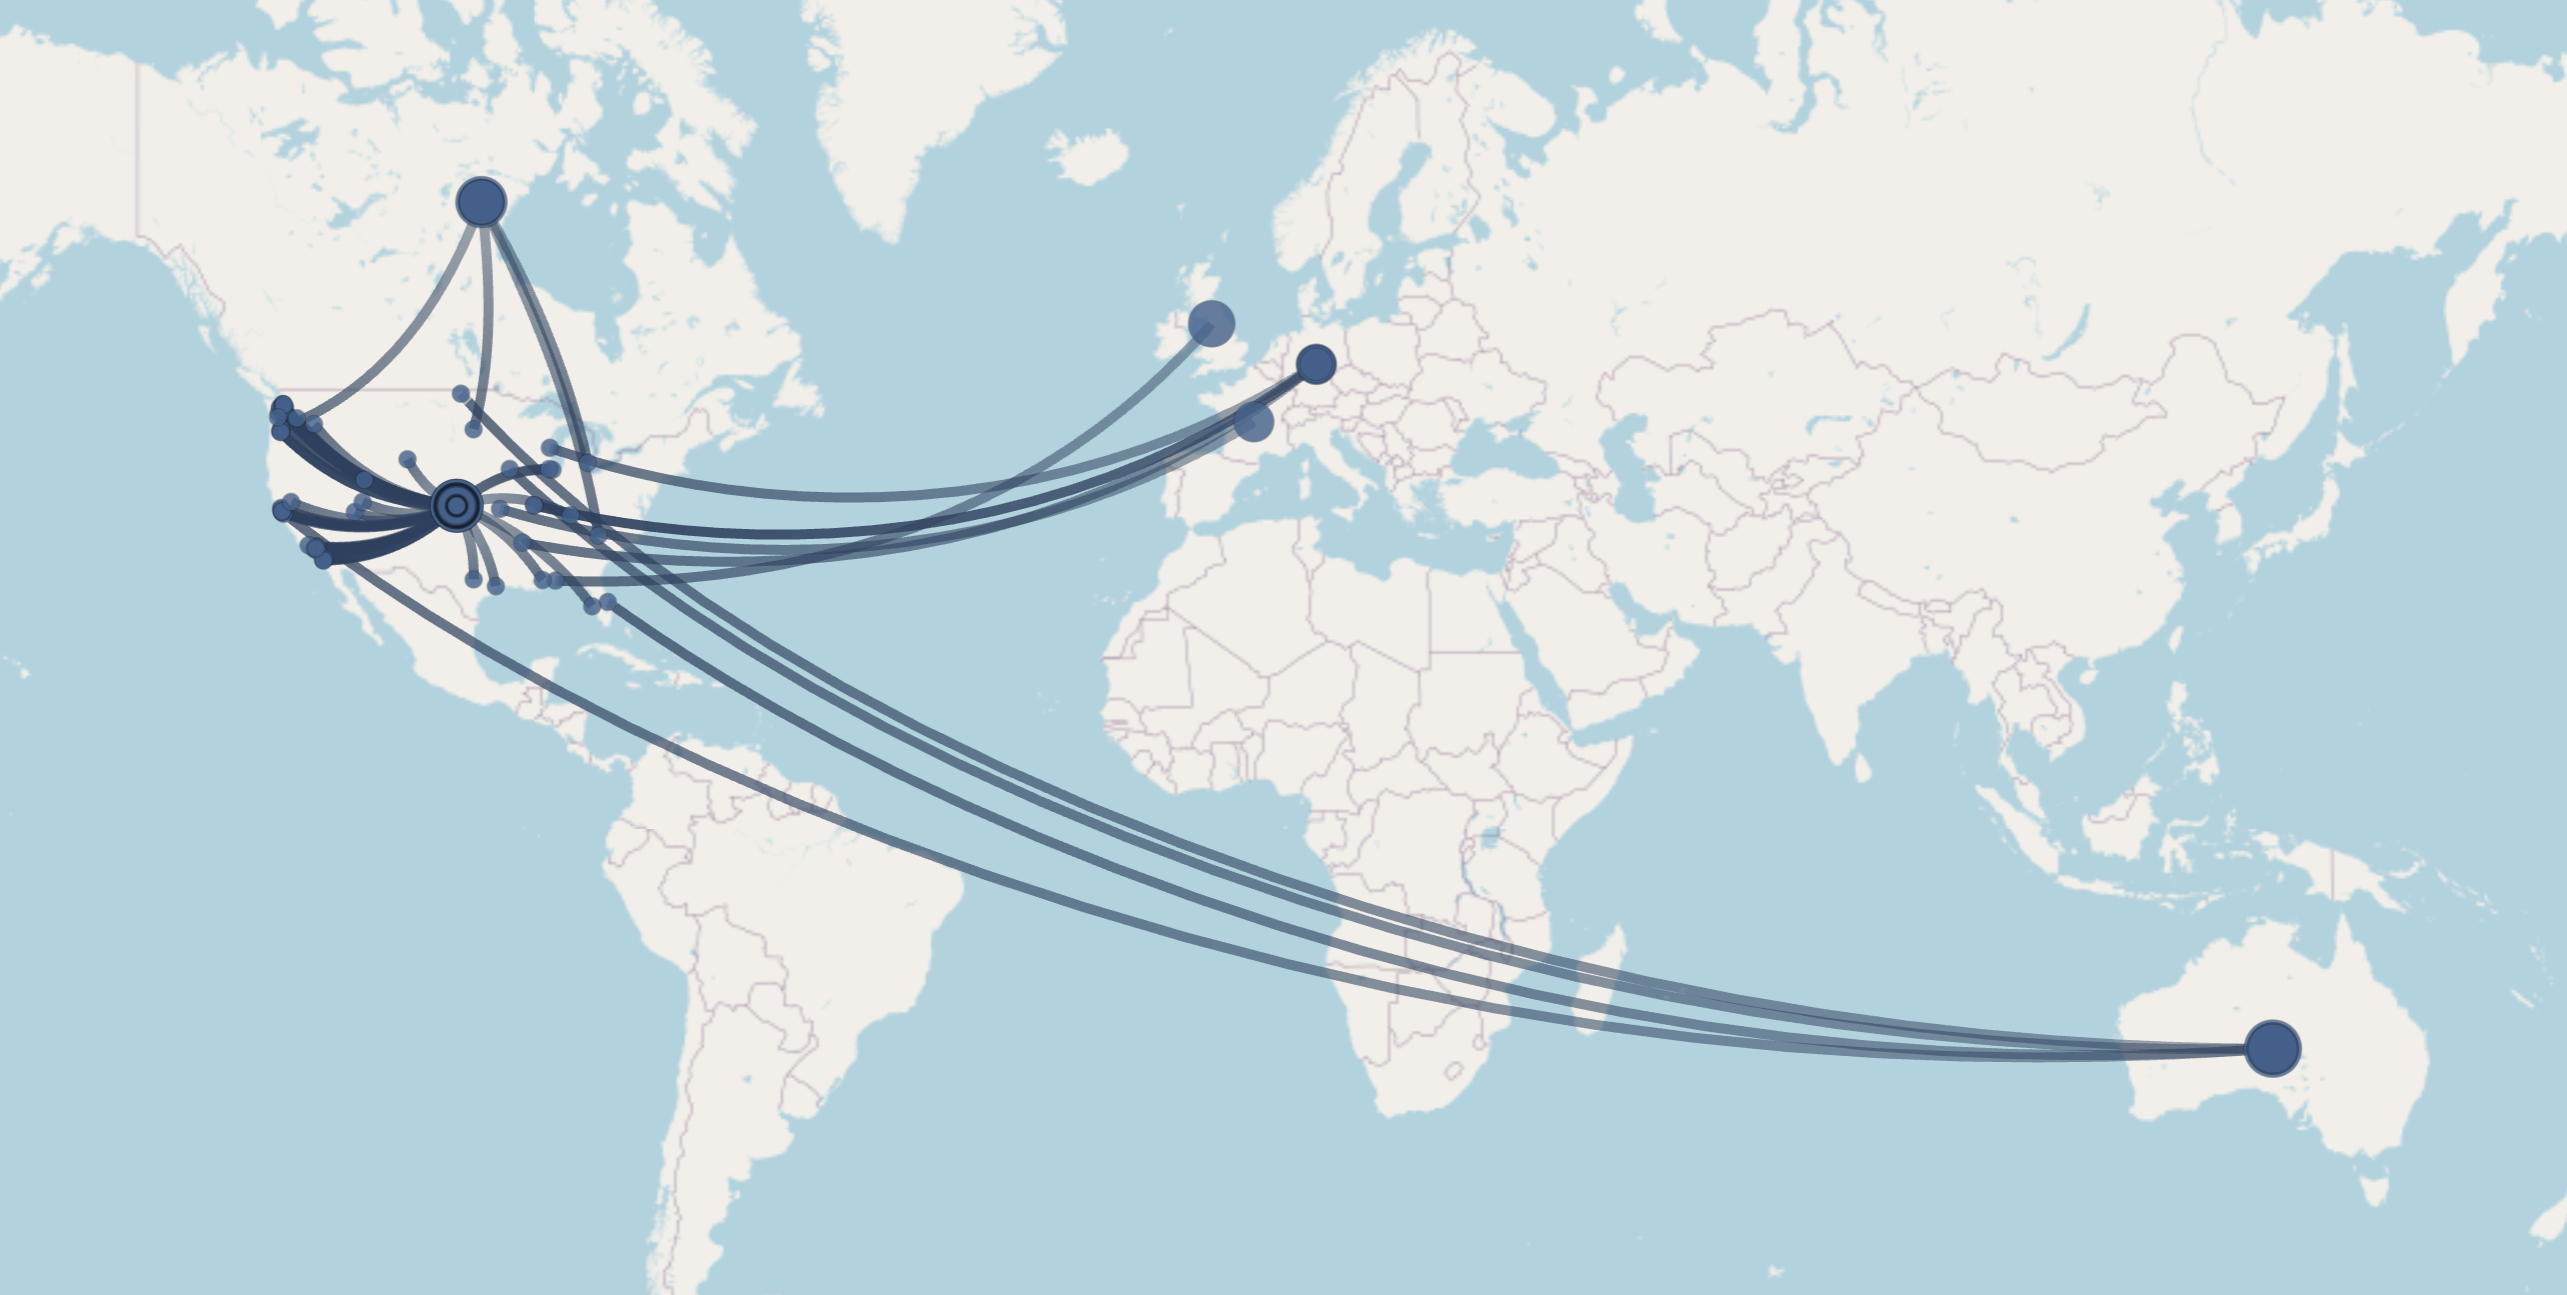
Data Binding
Data can be configured in the Data Binding Panel on the right side of the dashboard designer. At minimum, the Flow Line Map requires:
From Location and To Location (or alternatively From Latitude/Longitude and To Latitude/Longitude) to define the flow path.
Line Width to visualize the relative strength of each flow.
Other slots such as Line Color, Bubble Size, and Tooltip are optional but add detail and context.
From Location
Bind a geographic field (e.g., city, state, country) that represents the starting point of the flow.
From Latitude
Bind a numeric latitude value for the starting point when working with coordinate-based datasets.
From Longitude
Bind a numeric longitude value for the starting point when working with coordinate-based datasets.
From Long/Lat Label
Assign a label (such as city or site name) to identify the starting point when using Latitude/Longitude instead of a named location.
To Location
Bind a geographic field that represents the destination of the flow.
To Latitude
Bind a numeric latitude value for the destination when working with coordinate-based datasets.
To Longitude
Bind a numeric longitude value for the destination when working with coordinate-based datasets.
To Long/Lat Label
Assign a label (such as city or site name) to identify the destination when using Latitude/Longitude instead of a named location.
Line Color
Bind a measure or category to define the color of flow lines. For example, you could color flows by product type or by volume ranges.
Line Width
Bind a numeric field to determine the thickness of each flow line. Larger values produce thicker lines, visually emphasizing stronger flows.
Bubble Size
Bind a numeric field to display bubbles at the “From” or “To” points. The bubble size is proportional to the bound measure, highlighting the relative magnitude at each location.
Tooltip
Bind additional fields you want displayed when hovering over a line or point. This provides extra context without cluttering the map.
Property Reference
You can customize the appearance of the Flow Line Map using the Inspector Panel on the right side of the dashboard designer.
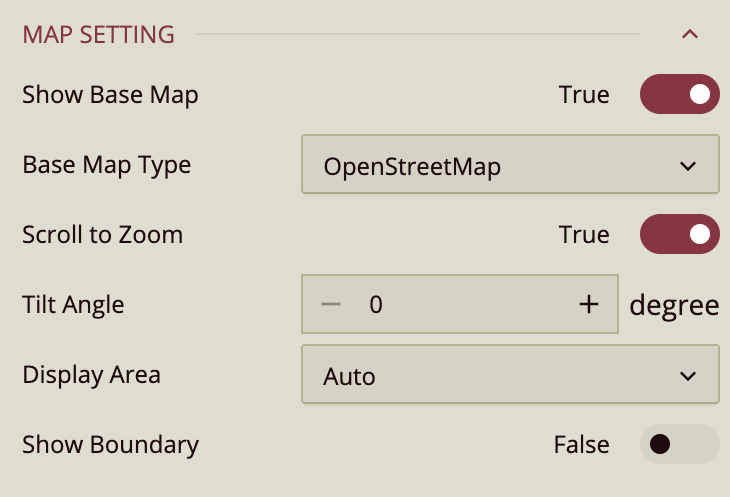
Map Settings
Show Base Map – Enable or disable the reference map. By default, set to True. Wyn uses Mapbox GIS as the base map.
Base Map Type – Choose between:
OpenStreetMap (default)
Mapbox – available only if Use Mapbox is enabled in the Admin portal. Allows choosing default Mapbox styles (Normal, Dark, Light) or custom Mapbox styles added in the Admin portal.
Custom – lets you configure Custom GIS Base Styles.
Scroll to Zoom – If set to True (default), users can zoom using the scroll wheel. If False, zooming is possible only by double-clicking.
Tilt Angle – Adjusts the tilt to view the map at an angle.
Display Area – Choose how the visible area of the map is set:
Auto – automatically fits all data points.
By Area – displays the area selector when clicking on a bubble.
By Longitude & Latitude – manually set the zoom level, longitude, and latitude.
Zoom Level: range 2–16.
Longitude: set via slider or input.
Latitude: set via slider or input.
Show Boundary – When True, adds boundary lines with customizable options:
Boundary Area – specify the area.
Boundary Color – choose the color.
Boundary Width – set thickness.
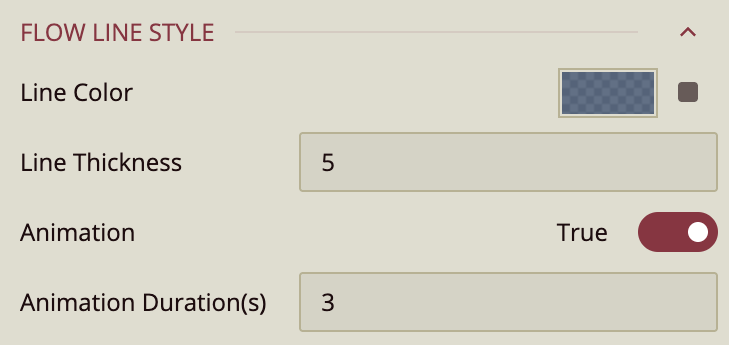
Flow Line Style
Fill Mode – Options: Continuous or Grouped.
Fill Color – Choose 2- or 3-color gradients for flow lines.
Thickness Range – Define the min/max thickness of flow lines.
Animation – Enable or disable line animation (default True).
Animation Duration – Set duration between 0–60 seconds.
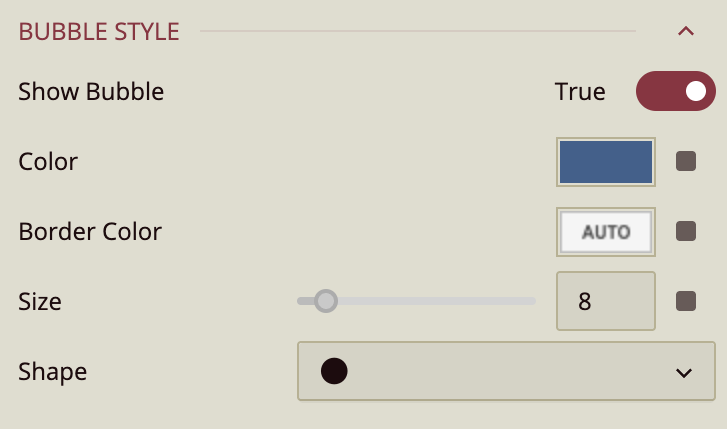
Bubble Style
Show Bubble – Enable/disable bubbles at line endpoints (default True).
Color – Select bubble fill color.
Border Color – Choose border color.
Size – Range: 2–60.
Shape – Select bubble shape from dropdown.