- Getting Started
- Administration Guide
-
User Guide
- An Introduction to Wyn Enterprise
- Document Portal for End Users
- Data Governance and Modeling
- Working-with-Resources
- Working with Reports
- Working with Dashboards
- View and Manage Documents
- Understanding Wyn Analytical Expressions
- Section 508 Compliance
- Developer Guide
Freeze Rows and Columns
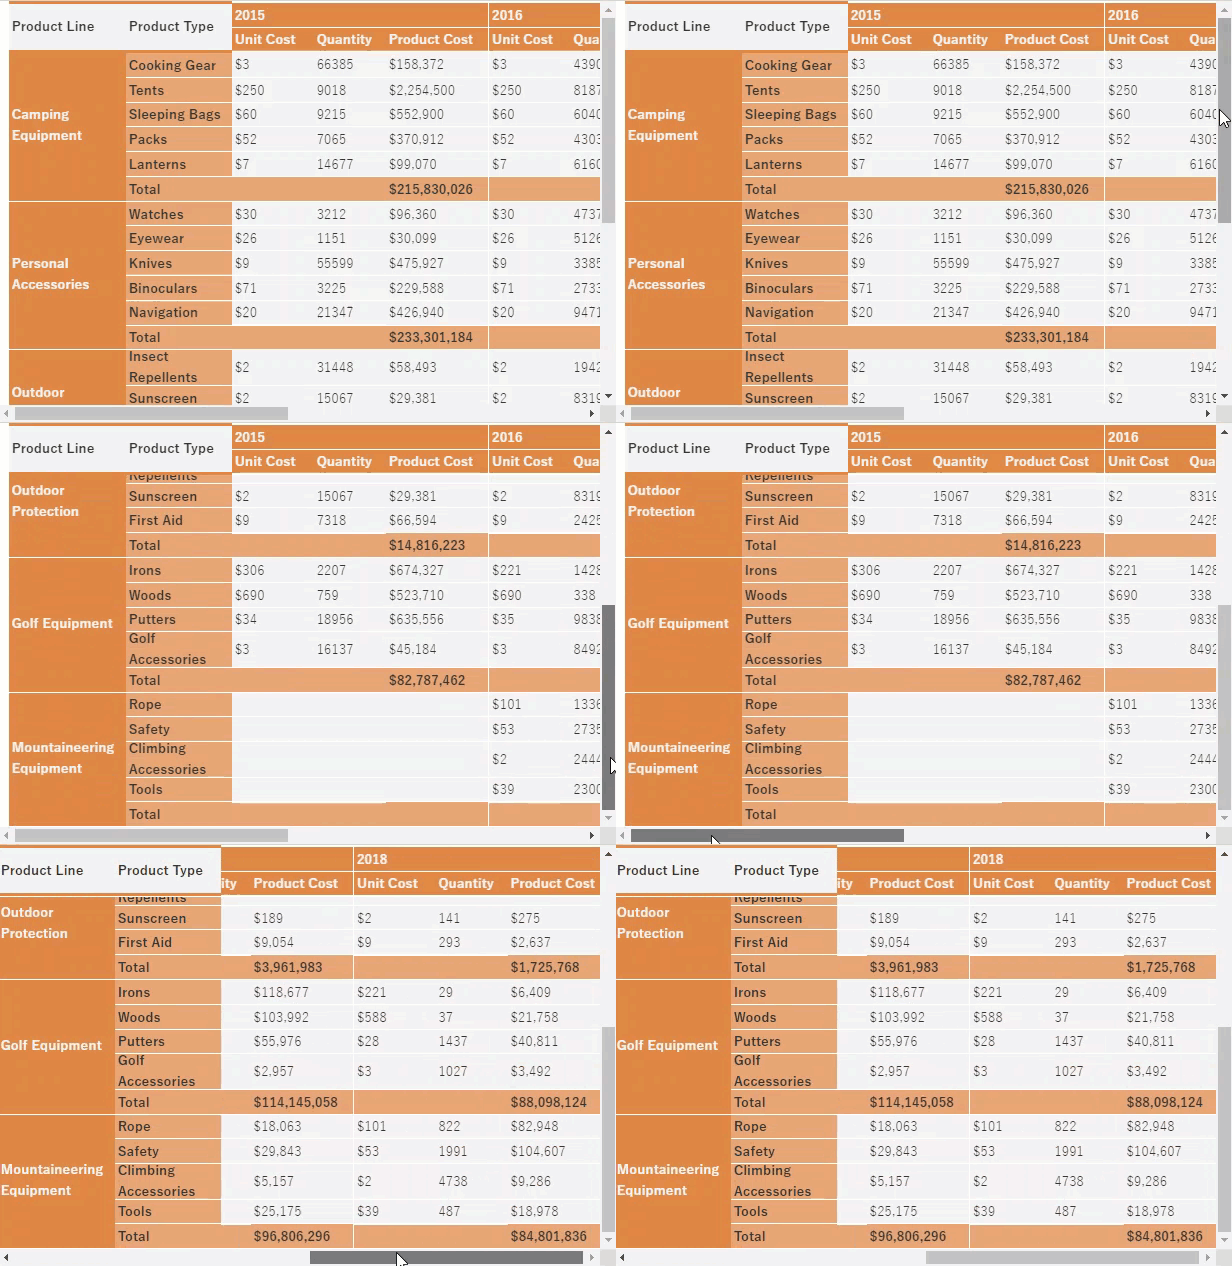
In an RDL report, when a user previews a Tablix data region containing a large amount of data in a Galley mode, he must scroll to see all of the data. However, on scrolling the row or column headers out of sight, the data becomes difficult to understand.
To overcome this problem, you can freeze the row(s) and column(s) so that they remain visible while the rest of the tablix scrolls. You can freeze as many header rows or columns as you have in the data region.

In Wyn Enterprise, the easiest way to freeze specific rows and columns in a Tablix data region is through the Frozen Rows and Columns option in the Tablix Wizard. For more information, see the Tablix article.
However, this can also be achieved by using the Frozen Rows and Frozen Columns properties as elaborated in the below section.
To Freeze Rows and Columns in a Tablix Data Region
Follow the below steps to freeze specific row(s) and column(s) in a tablix.
Select the entire tablix and go to the Properties panel on the right.
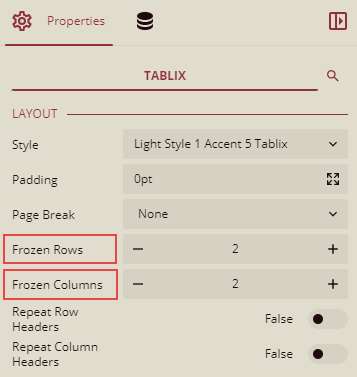
Scroll down the panel and find the Frozen Rows and Frozen Columns properties.
Use the Frozen Rows property to specify the numbers of row(s) you want to freeze in the tablix.
Use the Frozen Columns property to specify the number of column(s) you want to freeze in the tablix.

Note: The Frozen Rows and Frozen Columns properties are only applicable to the header row(s) and column(s) of the Tablix data region, which means the number of row(s) and column(s) you want to freeze should not exceed the actual number of header row(s) and column(s) in the tablix.
Preview the report.