- Getting Started
- Administration Guide
-
User Guide
- An Introduction to Wyn Enterprise
- Document Portal for End Users
- Data Governance and Modeling
- Working with Resources
- Working with Reports
-
Working with Dashboards
- Dashboard Designer
- Dashboard Templates
- Selecting a Dataset
- Data Attributes
- Dashboard Scenarios
- Component Templates
- 3D Scene
- Explorer
- Visualization Wizard
- Data Analysis and Interactivity
- Dashboard Appearance
- Preview Dashboard
- Export Dashboard
- Dashboard Lite Viewer
- Using Dashboard Designer
- Animating Dashboard Components
- View and Manage Documents
- Understanding Wyn Analytical Expressions
- Section 508 Compliance
- Subscribe to RSS Feed for Wyn Builds Site
- Developer Guide
Create an Income Statement Dashboard
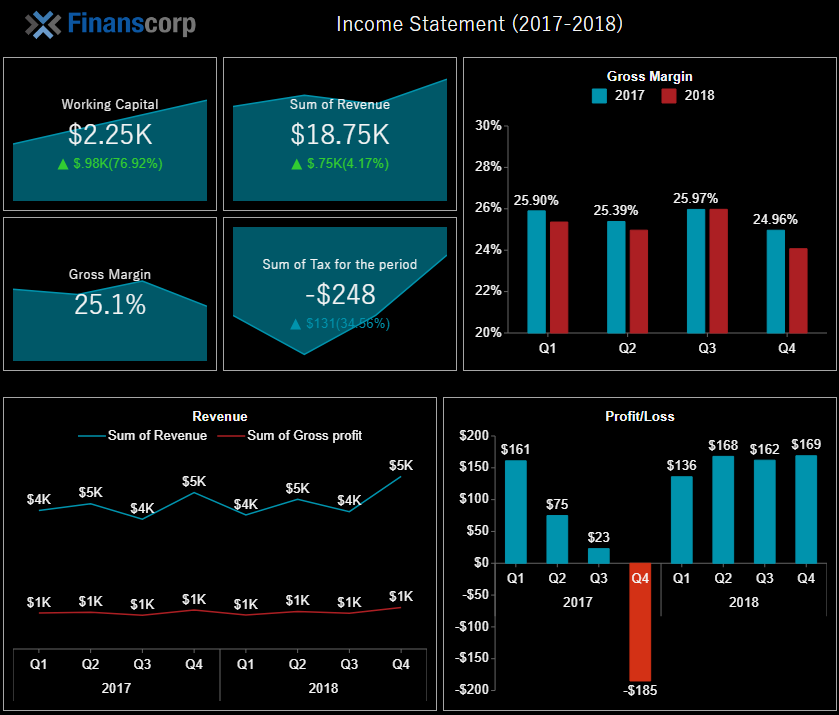
The Income Statement dashboard provides information about the financial KPIs to track and monitor the company's revenue sales, profits, and expenses in real-time and also lets you focus on the important areas that need immediate attention. Have a look at the following income statement dashboard showcasing the company insights on liquidity, sales revenue, costs, and expenses. This dashboard centers around the four important KPIs - working capital, sum of revenue vs planned revenue, gross margin, and sum of tax for the period. With the help of KPI charts, you get a quick glance over these company's insights. The gross margin indicates the financial health of the company; higher the gross margin more closer is a company to achieve a healthy net profit. While, the profit loss helps the user to evaluate the business's net profit.


