-
Interactive DashboardsCreate interactive BI dashboards with dynamic visuals.
-
End-User BI ReportsCreate and deploy enterprise BI reports for use in any vertical.
-
Wyn AlertsSet up always-on threshold notifications and alerts.
-
Localization SupportChange titles, labels, text explanations, and more.
-
Wyn ArchitectureA lightweight server offers flexible deployment.
-
 Wyn Enterprise 7.1 is ReleasedThis release emphasizes Wyn document embedding and enhanced analytical express...
 -
 Choosing an Embedded BI Solution for SaaS ProvidersAdding BI features to your applications will improve your products, better serve your customers, and more. But where to start? In this guide, we discuss the many options.
-
Visual GalleryInteractive sample dashboards and reports.
-
BlogExplore Wyn, BI trends, and more.
-
WebinarsDiscover live and on-demand webinars.
-
Customer SuccessVisualize operational efficiency and streamline manufacturing processes.
-
Knowledge BaseGet quick answers with articles and guides.
-
VideosVideo tutorials, trends and best practices.
-
WhitepapersDetailed reports on the latest trends in BI.
-
 Choosing an Embedded BI Solution for SaaS ProvidersAdding BI features to your applications will impr...
 -

- Getting Started
- Administration Guide
-
User Guide
- An Introduction to Wyn Enterprise
- Document Portal for End Users
- Data Governance and Modeling
- View and Manage Documents
- Working with Resources
- Working with Reports
- Working with Dashboards
- Working with Notebooks
- Wyn Analytical Expressions
- Section 508 Compliance
- Subscribe to RSS Feed for Wyn Builds Site
- Developer Guide
Symbol Map
The Symbol Map scenario is used to place symbols or markers on a map at geographic locations. Symbols can represent categories, measures, or other attributes, making it easy to compare values across different places.
Example
The following map has been created using this native query dataset from the AdventureWorks Data Warehouse:
SELECT
    st.SalesTerritoryCountry AS Country,
    st.SalesTerritoryRegion AS Region,
    CASE st.SalesTerritoryCountry
        WHEN 'United States' THEN 37.0902
        WHEN 'Canada' THEN 56.1304
        WHEN 'United Kingdom' THEN 55.3781
        WHEN 'Australia' THEN -25.2744
        WHEN 'France' THEN 46.2276
        ELSE NULL
    END AS Latitude,
    CASE st.SalesTerritoryCountry
        WHEN 'United States' THEN -95.7129
        WHEN 'Canada' THEN -106.3468
        WHEN 'United Kingdom' THEN -3.4360
        WHEN 'Australia' THEN 133.7751
        WHEN 'France' THEN 2.2137
        ELSE NULL
    END AS Longitude,
    SUM(fact.SalesAmount) AS TotalSales,
    CASE
        WHEN SUM(fact.SalesAmount) > 2000000 THEN 'High'
        WHEN SUM(fact.SalesAmount) BETWEEN 1000000 AND 2000000 THEN 'Medium'
        ELSE 'Low'
    END AS SymbolCategory
FROM
    dbo.FactInternetSales fact
INNER JOIN
    dbo.DimSalesTerritory st
    ON fact.SalesTerritoryKey = st.SalesTerritoryKey
GROUP BY
    st.SalesTerritoryCountry,
    st.SalesTerritoryRegion
ORDER BY
    TotalSales DESC;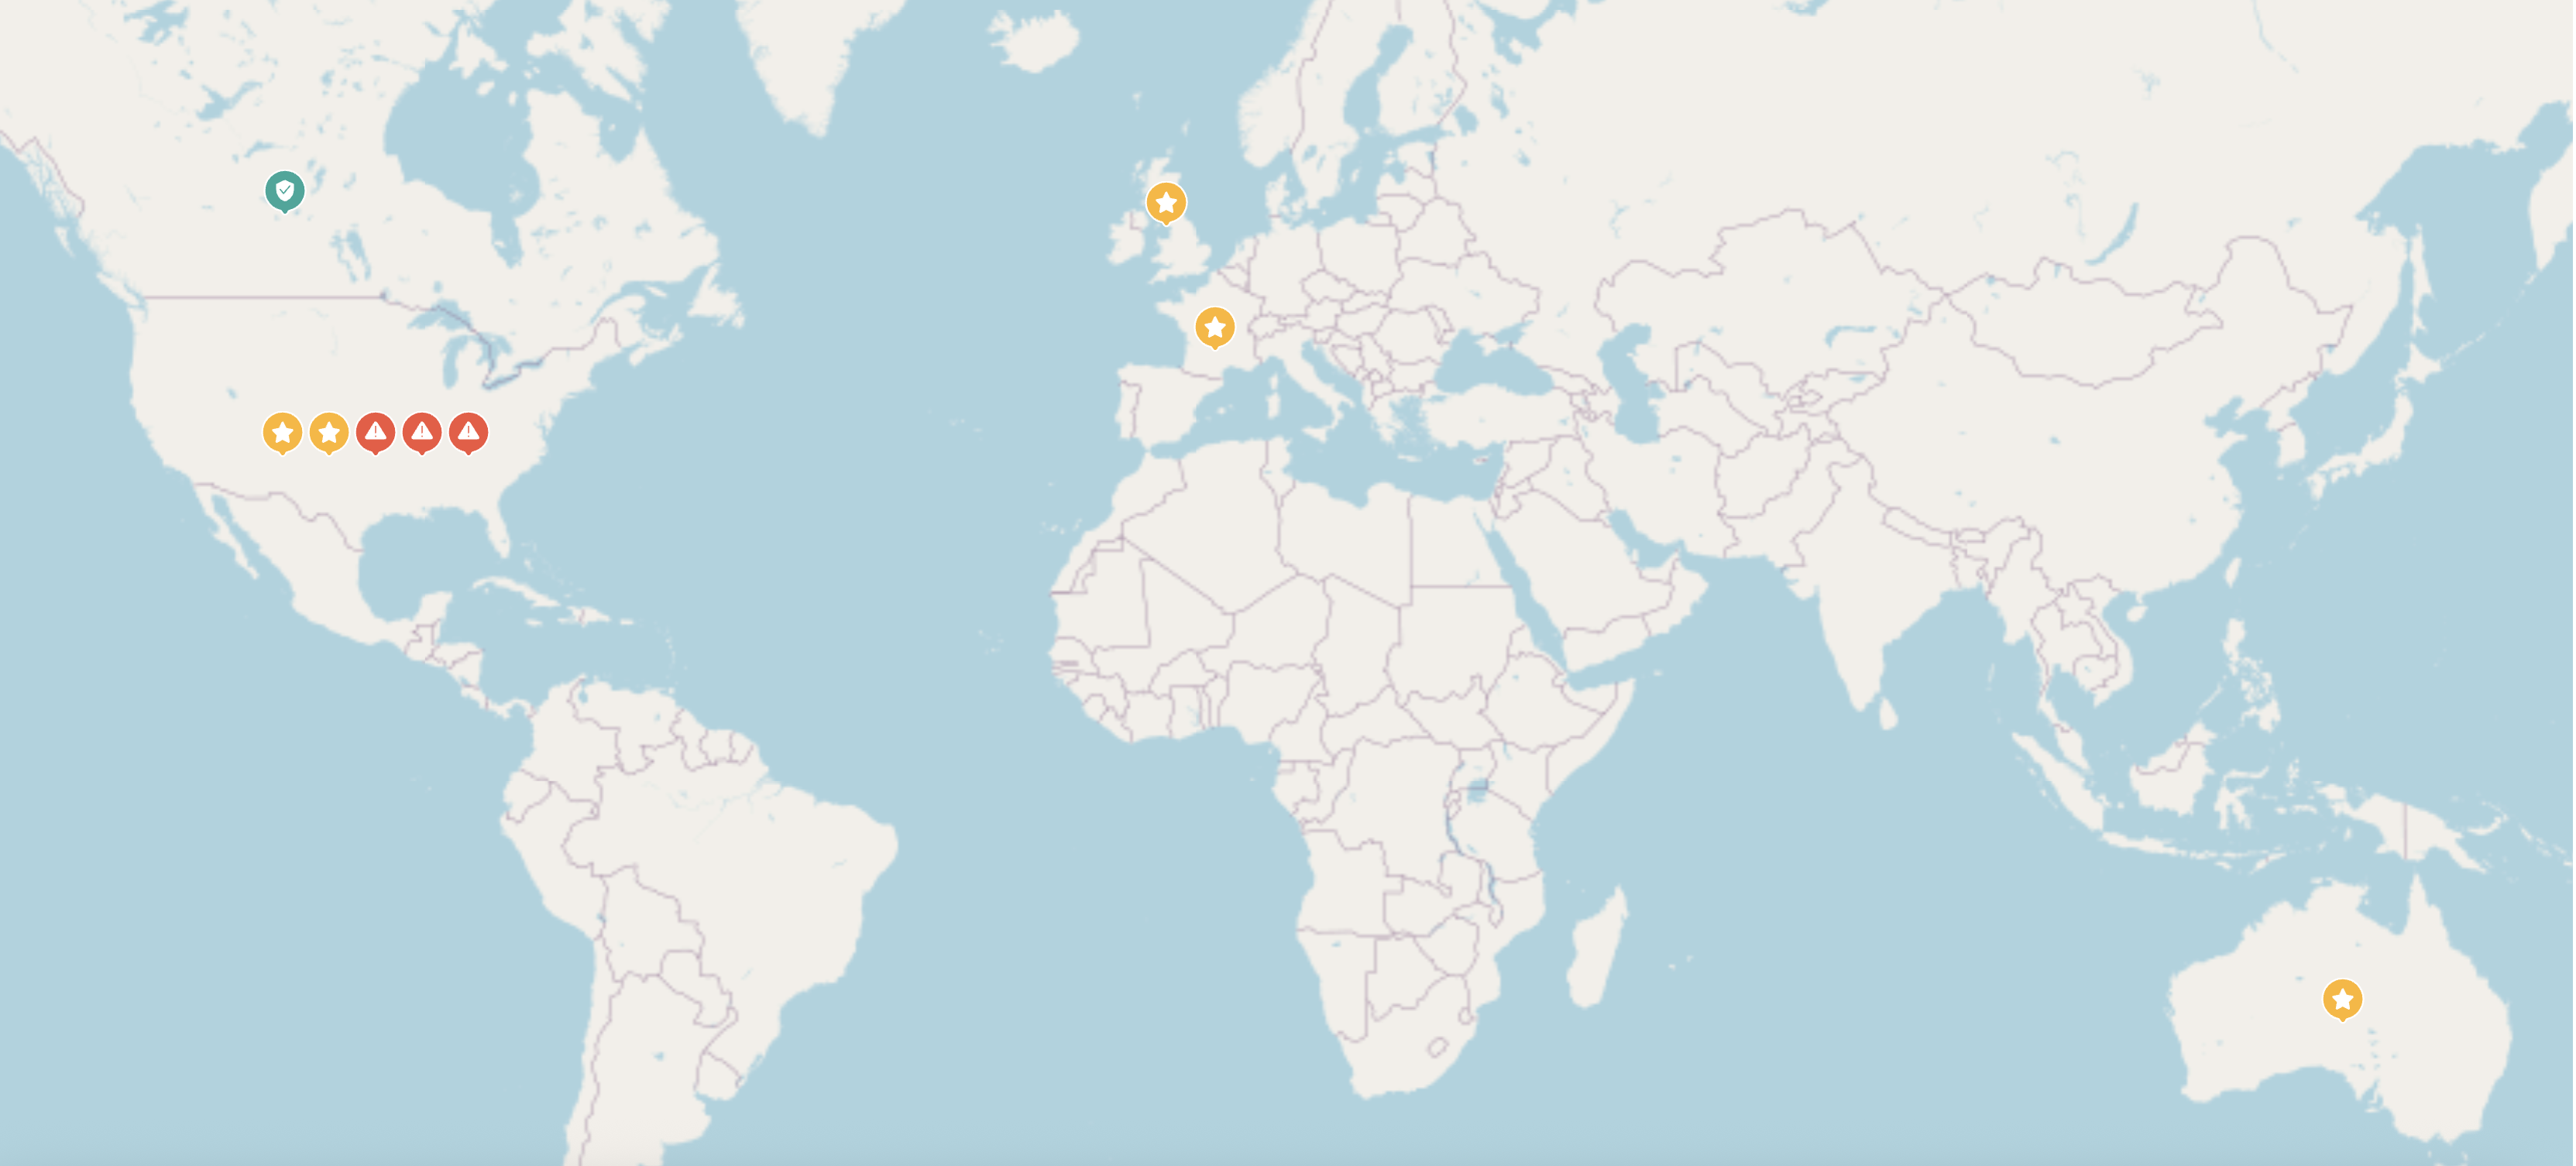
Data Binding
Data is configured in the Data Binding Panel on the right side of the dashboard designer.
Region
Bind a geographic field (e.g., city, state, country, or county) to automatically position symbols on the map.
Latitude
Bind a numeric latitude value when using coordinate-based datasets instead of named regions.
Longitude
Bind a numeric longitude value when using coordinate-based datasets instead of named regions.
Long/Lat Label
Assign a label (such as a city name or site identifier) to identify points when working with Latitude/Longitude instead of a region field.
Symbol
Bind a categorical field (e.g., product type, region category, status) or measure to control which symbol is displayed. Each distinct value is represented by a different symbol or marker style.
Tooltip
Bind additional fields you want displayed when hovering over a symbol. Tooltips provide extra context such as numeric values, categories, or descriptive text.
At minimum, the Symbol Map requires either:
Region, or
Latitude + Longitude
The Symbol binding is commonly used to distinguish categories or measures, while Tooltip is optional but recommended for added clarity.
Property Reference
You can customize the appearance of the Symbol Map scenario using the Inspector Panel properties on the right side of the dashboard designer window.
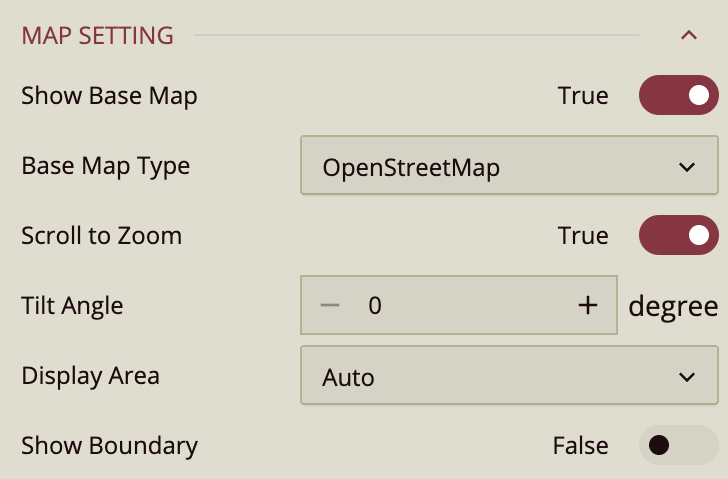
Map Settings
Show Base Map – Enable or disable the reference map. Wyn Enterprise uses Mapbox GIS as a base map. Default: True.
Base Map Type – Choose from:
OpenStreetMap (default)
Mapbox – Available if “Use Mapbox” is set to True in Admin Portal → Dashboard Settings. When selected, the Base Map Style property appears (choose Normal, Dark, Light, or a custom Mapbox style).
Custom – When selected, the Custom GIS Base Styles property appears.
Scroll to Zoom – Allows zooming in/out while scrolling. Default: True. If set to False, zooming works only with double-click.
Tilt Angle – Adjusts the map tilt for angled views.
Display Area – Options:
Auto – Automatically fits all data points.
By Area – Displays an area selector. Clicking a symbol adjusts the map boundary to that bubble.
By Longitude & Latitude – Manually set zoom level, longitude, and latitude.
Zoom Level: Range 2–16.
Longitude: Slider or input value.
Latitude: Slider or input value.
Show Boundary – Enable/disable map boundaries. Default: False. When enabled:
Boundary Area: Select from World, Country, State, or City (default: United States).
Boundary Color: Set line color.
Boundary Width: Set line thickness.
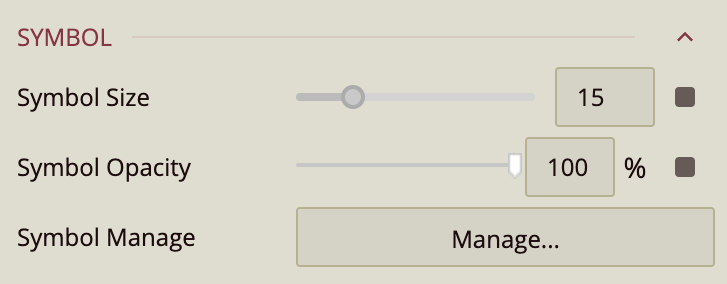
Symbol Settings
Symbol Size – Set symbol size (default: 20).
Symbol Opacity – Set opacity (default: 100%).
Symbol Manage –
If no data is bound to the Symbol container: select a symbol or image from dropdown.
If data is bound: use the Manage button to assign symbols per value via the Assign Symbol popup.