-
Interactive DashboardsCreate interactive BI dashboards with dynamic visuals.
-
End-User BI ReportsCreate and deploy enterprise BI reports for use in any vertical.
-
Wyn AlertsSet up always-on threshold notifications and alerts.
-
Localization SupportChange titles, labels, text explanations, and more.
-
Wyn ArchitectureA lightweight server offers flexible deployment.
-
 Wyn Enterprise 7.1 is ReleasedThis release emphasizes Wyn document embedding and enhanced analytical express...
 -
 Choosing an Embedded BI Solution for SaaS ProvidersAdding BI features to your applications will improve your products, better serve your customers, and more. But where to start? In this guide, we discuss the many options.
-
Visual GalleryInteractive sample dashboards and reports.
-
BlogExplore Wyn, BI trends, and more.
-
WebinarsDiscover live and on-demand webinars.
-
Customer SuccessVisualize operational efficiency and streamline manufacturing processes.
-
Knowledge BaseGet quick answers with articles and guides.
-
VideosVideo tutorials, trends and best practices.
-
WhitepapersDetailed reports on the latest trends in BI.
-
 Choosing an Embedded BI Solution for SaaS ProvidersAdding BI features to your applications will impr...
 -

- Getting Started
- Administration Guide
-
User Guide
- An Introduction to Wyn Enterprise
- Document Portal for End Users
- Data Governance and Modeling
- View and Manage Documents
- Working with Resources
- Working with Reports
- Working with Dashboards
- Working with Notebooks
- Wyn Analytical Expressions
- Section 508 Compliance
- Subscribe to RSS Feed for Wyn Builds Site
- Developer Guide
Heat Map
The Heat Map scenario allows you to bind data to specific slots in order to display geographical insights.
Example
The following map has been created using this native query dataset from the AdventureWorks Data Warehouse:
SELECT
    c.City,
    c.StateProvinceCode,
    c.CountryRegionCode,
    SUM(f.SalesAmount) AS TotalSales,
    AVG(f.SalesAmount) AS AvgSales,
    COUNT(*) AS OrderCount
FROM
    dbo.FactInternetSales f
JOIN
    dbo.DimCustomer cu ON f.CustomerKey = cu.CustomerKey
JOIN
    dbo.DimGeography c ON cu.GeographyKey = c.GeographyKey
GROUP BY
    c.City,
    c.StateProvinceCode,
    c.CountryRegionCode
ORDER BY
    TotalSales DESC;
Data Binding
You can configure these bindings in the Data Binding Panel on the right side of the dashboard designer.
Region
Use the Region slot to plot areas based on region names such as country, state, or city. When data is bound here, the Heat Map automatically determines and highlights the corresponding geographic boundaries.
Latitude
Bind numeric latitude values to position data points precisely on the map. This is typically used when working with coordinate-based datasets instead of named regions.
Longitude
Bind numeric longitude values to complement latitude for exact placement of data points on the map.
Long/Lat Label
Use this slot to assign a label to coordinates when Latitude and Longitude values are used. For example, you can display a city name or site name for easier identification of points.
Heat Color
Bind a measure (such as sales, population, or density) to this slot to drive the color intensity on the Heat Map. Higher or lower values are represented with corresponding gradients, allowing users to identify patterns and hotspots quickly.
Tooltip
Use the Tooltip slot to add additional context when hovering over a data point or region. Any field bound here will be displayed in the tooltip, providing more information without cluttering the map.
Property Reference
You can customize the appearance of a Heat Map scenario using the Inspector Panel on the right side of the dashboard designer. The available settings are organized into different categories:
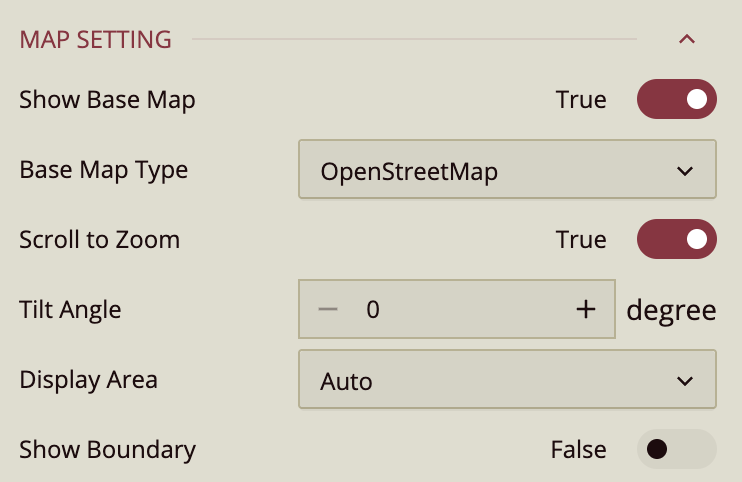
Map Settings
Show Base Map Enable or disable the reference map. Wyn uses Mapbox GIS as the base map. Default: True.
Base Map Type Choose between OpenStreetMap, Mapbox, or Custom.
If Mapbox is selected, you’ll also see Base Map Style (Normal, Dark, Light, or custom Mapbox styles defined in the Admin Portal).
If Custom is selected, you’ll see Custom GIS Base Styles.
Scroll to Zoom Allow zooming in/out with scrolling. Default: True. If set to False, zooming is only possible with double-click.
Tilt Angle Apply a tilt to view the map from a different angle.
Display Area Control how the map zoom and range are set:
Auto: Adjusts automatically to fit all data points.
By Area: Displays an area selector on the map.
By Longitude & Latitude: Manually set Zoom Level, Longitude, and Latitude.
Zoom Level: Range 2–16.
Longitude / Latitude: Define the exact map position.
Show Boundary Enable to display map boundaries. Additional options appear:
Boundary Area Define the boundary area.
Boundary Color Select the boundary line color.
Boundary Width Adjust the boundary line thickness.
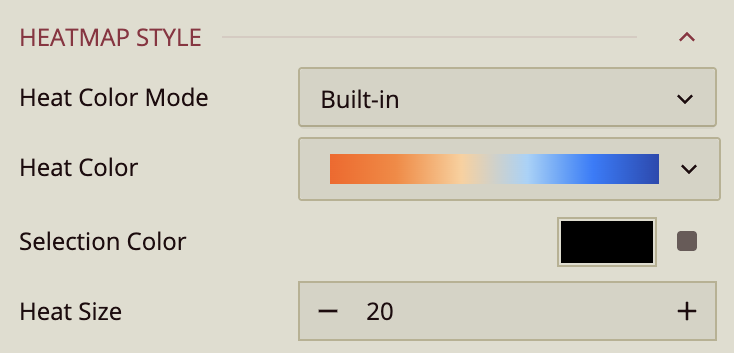
Heat Map Style
Heat Color Mode Choose between:
Built-in (predefined color scheme).
Custom (configure up to 6 gradient point colors).
Heat Color Select the heat map gradient.
Selection Color Set the circle color that highlights selected map items.
Heat Size Control the heat radius (0–100). Larger numbers create bigger radii.