


- Getting Started
- Administration Guide
-
User Guide
- An Introduction to Wyn Enterprise
- Document Portal for End Users
- Data Governance and Modeling
- Working-with-Resources
- Working with Reports
- Working with Dashboards
- View and Manage Documents
- Understanding Wyn Analytical Expressions
- Section 508 Compliance
- Developer Guide
Customize Scenario Tooltip
Wyn Enterprise: Customize Scenario Tooltip
Tooltips allow users to display the selected data information for plots by hovering over the dashboard scenario.
In Wyn Application, you can customize the tooltip based on the data binding items and the appearance. By default, the tooltip displays all data roles in the dashboard scenarios. You can customize the tooltip by removing some binding items using the Data Binding tab and customize the appearance using the Inspector tab. Follow the steps below to customize the tooltip.
You can customize the tooltip while creating a dashboard or you can open the existing one where you want to add the customized tooltip and edit it. We are creating a Line Chart scenario and customizing the tooltip in this example.
On the Document Portal, go to Create (+) > Create Dashboard.
Add Line Chart Scenario
From the Data Visualization tab on the left of the dashboard designer, drag and drop a Line Chart on the design area.
From the Data Binding tab on the right, select Retail Dataset, which is already available to us. We will use this chart to analyze the revenue generated vs year.
Drag and drop the data fields as follows and see how the chart title is automatically generated.
Data Binding Property | Field |
|---|---|
Values | Revenue |
Axis (Category) | Year |
Legend (Series) | Order method type |
Customize Tooltip using the Data Binding tab
Click the Ellipsis icon
 next to the Tooltip and then click the Setting icon
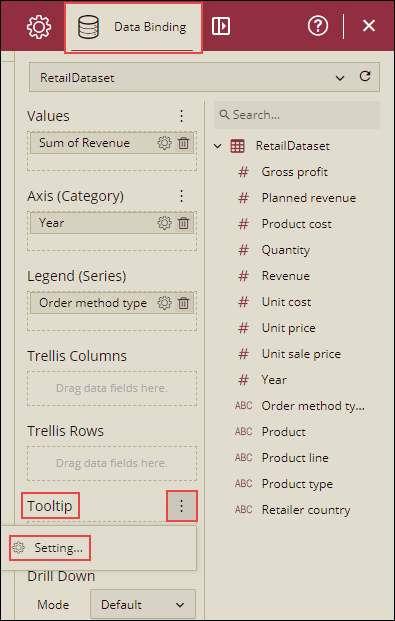
Tooltip Setting dialog box is displayed.
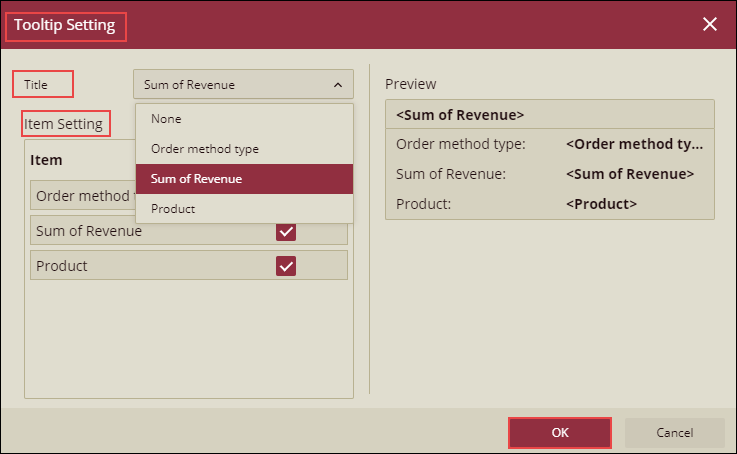
This dialog will list all the tooltip items.
Set Title to any field by selecting from the Title dropdown list. Select None, to hide the title.
You can control the display order of all the items by dragging the items under the Item Setting section. You can remove any item by unchecking the corresponding checkbox; this item will not be visible on the tooltip.
Click the Ok button to save the tooltip settings.
Customize the default tooltip appearance using the Inspector tab
On the Inspector tab, you can see the TOOLTIP section.
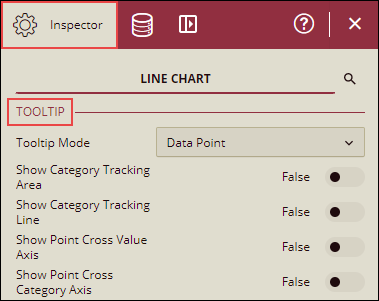
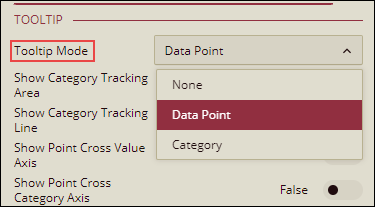
Under the TOOLTIP section, select the Tooltip Mode from the dropdown list.
Set the Show Category Tracking Area to True. The Tracking Area Color field is displayed.
Select the Tracking Area Color and click Ok.
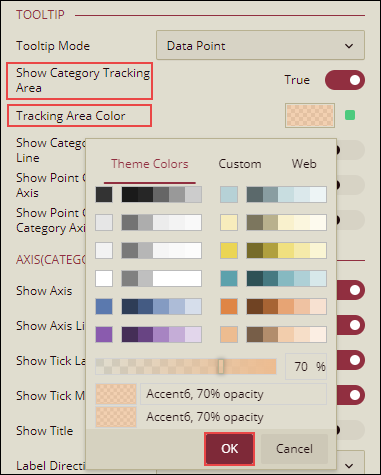
Similarly, you can customize the Category Tracking Line, Point Cross Value Axis, and Point Cross Category Axis as per your requirement.
Note: Based on the scenario selected, the fields displayed under the TOOLTIP section may vary.
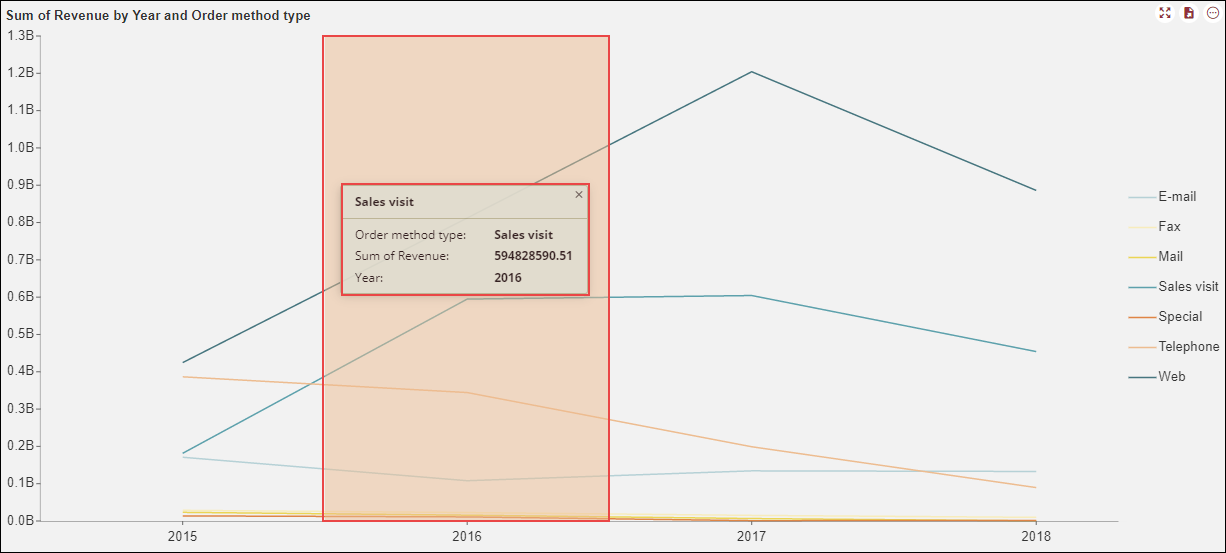
Click Preview, to view the dashboard with the tooltip.
Click Save to save the dashboard.
Note: For the charts having a Tooltip data role panel, you can customize the tooltip.
But scenarios like KPI, Gauge, Indicator, and KPI Matrix do not have a Tooltip data role panel. So, in these cases, you cannot customize the tooltip.
Tooltip for Data Tables and Pivot Tables
For Data Tables and Pivot Tables, go to the Inspector tab. Under the TOOLTIP section, there is a property 'Tooltip Mode', with the following two options:
None
Show
None is the default option.
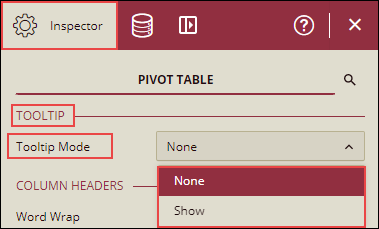
You can select the Tooltip Mode as "Show", to view the tooltip after a short pause of the mouse hovering over the cell, else select Tooltip Mode as "None", if you do not want to display the tooltip.
If you select the Tooltip Mode as "None" and Click Action under the INTERACTION section as "Show Tooltip", then the tooltip will be displayed only when you click on any cell in the table and not on hovering over the cell.
Note: When both Click Action and Tooltip Mode are set to ‘Show Tooltip’, then on a click gesture to one cell, the tooltip will not display with a short pause of hovering over other cells. When you close the tooltip dialog that is triggered by the click action, hovering over other cells will still display the tooltip.