-
Interactive DashboardsCreate interactive BI dashboards with dynamic visuals.
-
End-User BI ReportsCreate and deploy enterprise BI reports for use in any vertical.
-
Wyn AlertsSet up always-on threshold notifications and alerts.
-
Localization SupportChange titles, labels, text explanations, and more.
-
Wyn ArchitectureA lightweight server offers flexible deployment.
-
 Wyn Enterprise 7.1 is ReleasedThis release emphasizes Wyn document embedding and enhanced analytical express...
 -
 Choosing an Embedded BI Solution for SaaS ProvidersAdding BI features to your applications will improve your products, better serve your customers, and more. But where to start? In this guide, we discuss the many options.
-
Visual GalleryInteractive sample dashboards and reports.
-
BlogExplore Wyn, BI trends, and more.
-
WebinarsDiscover live and on-demand webinars.
-
Customer SuccessVisualize operational efficiency and streamline manufacturing processes.
-
Knowledge BaseGet quick answers with articles and guides.
-
VideosVideo tutorials, trends and best practices.
-
WhitepapersDetailed reports on the latest trends in BI.
-
 Choosing an Embedded BI Solution for SaaS ProvidersAdding BI features to your applications will impr...
 -

- Getting Started
- Administration Guide
-
User Guide
- An Introduction to Wyn Enterprise
- Document Portal for End Users
- Data Governance and Modeling
- View and Manage Documents
- Working with Resources
- Working with Reports
-
Working with Dashboards
- Tour the Dashboard Designer
- Create a Dashboard
- Configure Dashboard
- Dashboard Data Binding
- Scenarios
- Appearance
- Component Management
- Parameters
- Interactions
- Finalize Your Dashboard
- Using AI in Wyn
- Working with Notebooks
- Wyn Analytical Expressions
- Section 508 Compliance
- Subscribe to RSS Feed for Wyn Builds Site
- Developer Guide
Aggregation Query Information
The Aggregation Query Information button is a data exploration tool that provides visibility into the SQL generated and executed by a dashboard scenario. It is designed primarily for performance analysis when using a Direct Querydata model.
When enabled, this feature allows dashboard users and administrators to:
View the exact SQL query executed for a visualization or aggregation.
Review the time required to build and execute the SQL.
Determine whether backend cache data was used.
Copy the SQL query for external analysis and optimization.
This capability is especially useful for diagnosing performance bottlenecks and optimizing database execution plans.
Purpose and Performance Optimization
The primary purpose of Aggregation Query Information is performance analysis.
When working with direct query datasets, dashboards generate SQL dynamically based on the data bindings, aggregations, filters, and sorting rules applied to a scenario. In cases where performance needs to be improved, developers or database administrators may need to:
Identify the SQL statement that was executed.
Run the query directly in the database.
Review the execution plan.
Create indexes or optimize database structures to improve performance.
By exposing the executed SQL and its timing metrics, this feature enables precise database-level tuning.
Enabling Aggregation Query Information
Aggregation Query Information is not enabled by default. It must be manually configured in the Admin Portal.
To enable this feature:
Open the Admin Portal.
Navigate to Configuration.
Select Dashboards.
Open the Designer panel (Configure Dashboards).
In the Data section, set Enable Query Metrics to True.
Click Save Changes.
Once enabled, the Aggregation Query Information icon becomes available in supported dashboard scenarios.
For additional configuration details, see the Designer article.
Using Aggregation Query Information in a Scenario
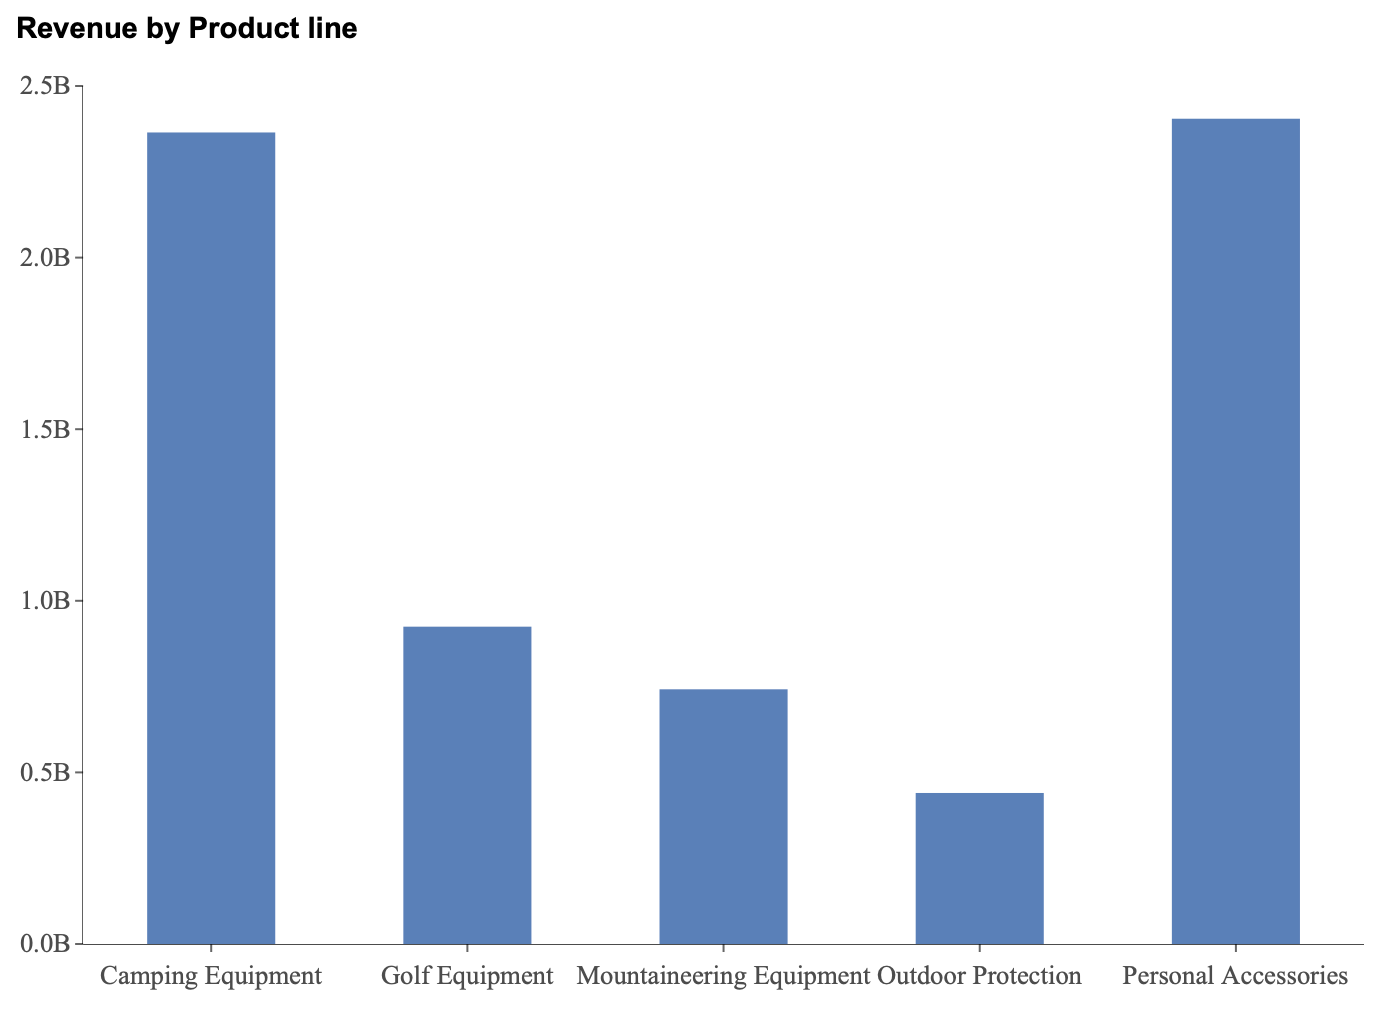
To better understand how this feature works, consider a simple column chart.
Note
The dataset used in the following examples is an Excel is a sample dataset in Wyn named RetailDataset.
Example: Column Chart
In this example, a column chart has been created using a retail sales dataset.
The Revenue field is bound to the Values data binding slot.
The Product Line field is bound to the Axis (Category) slot.
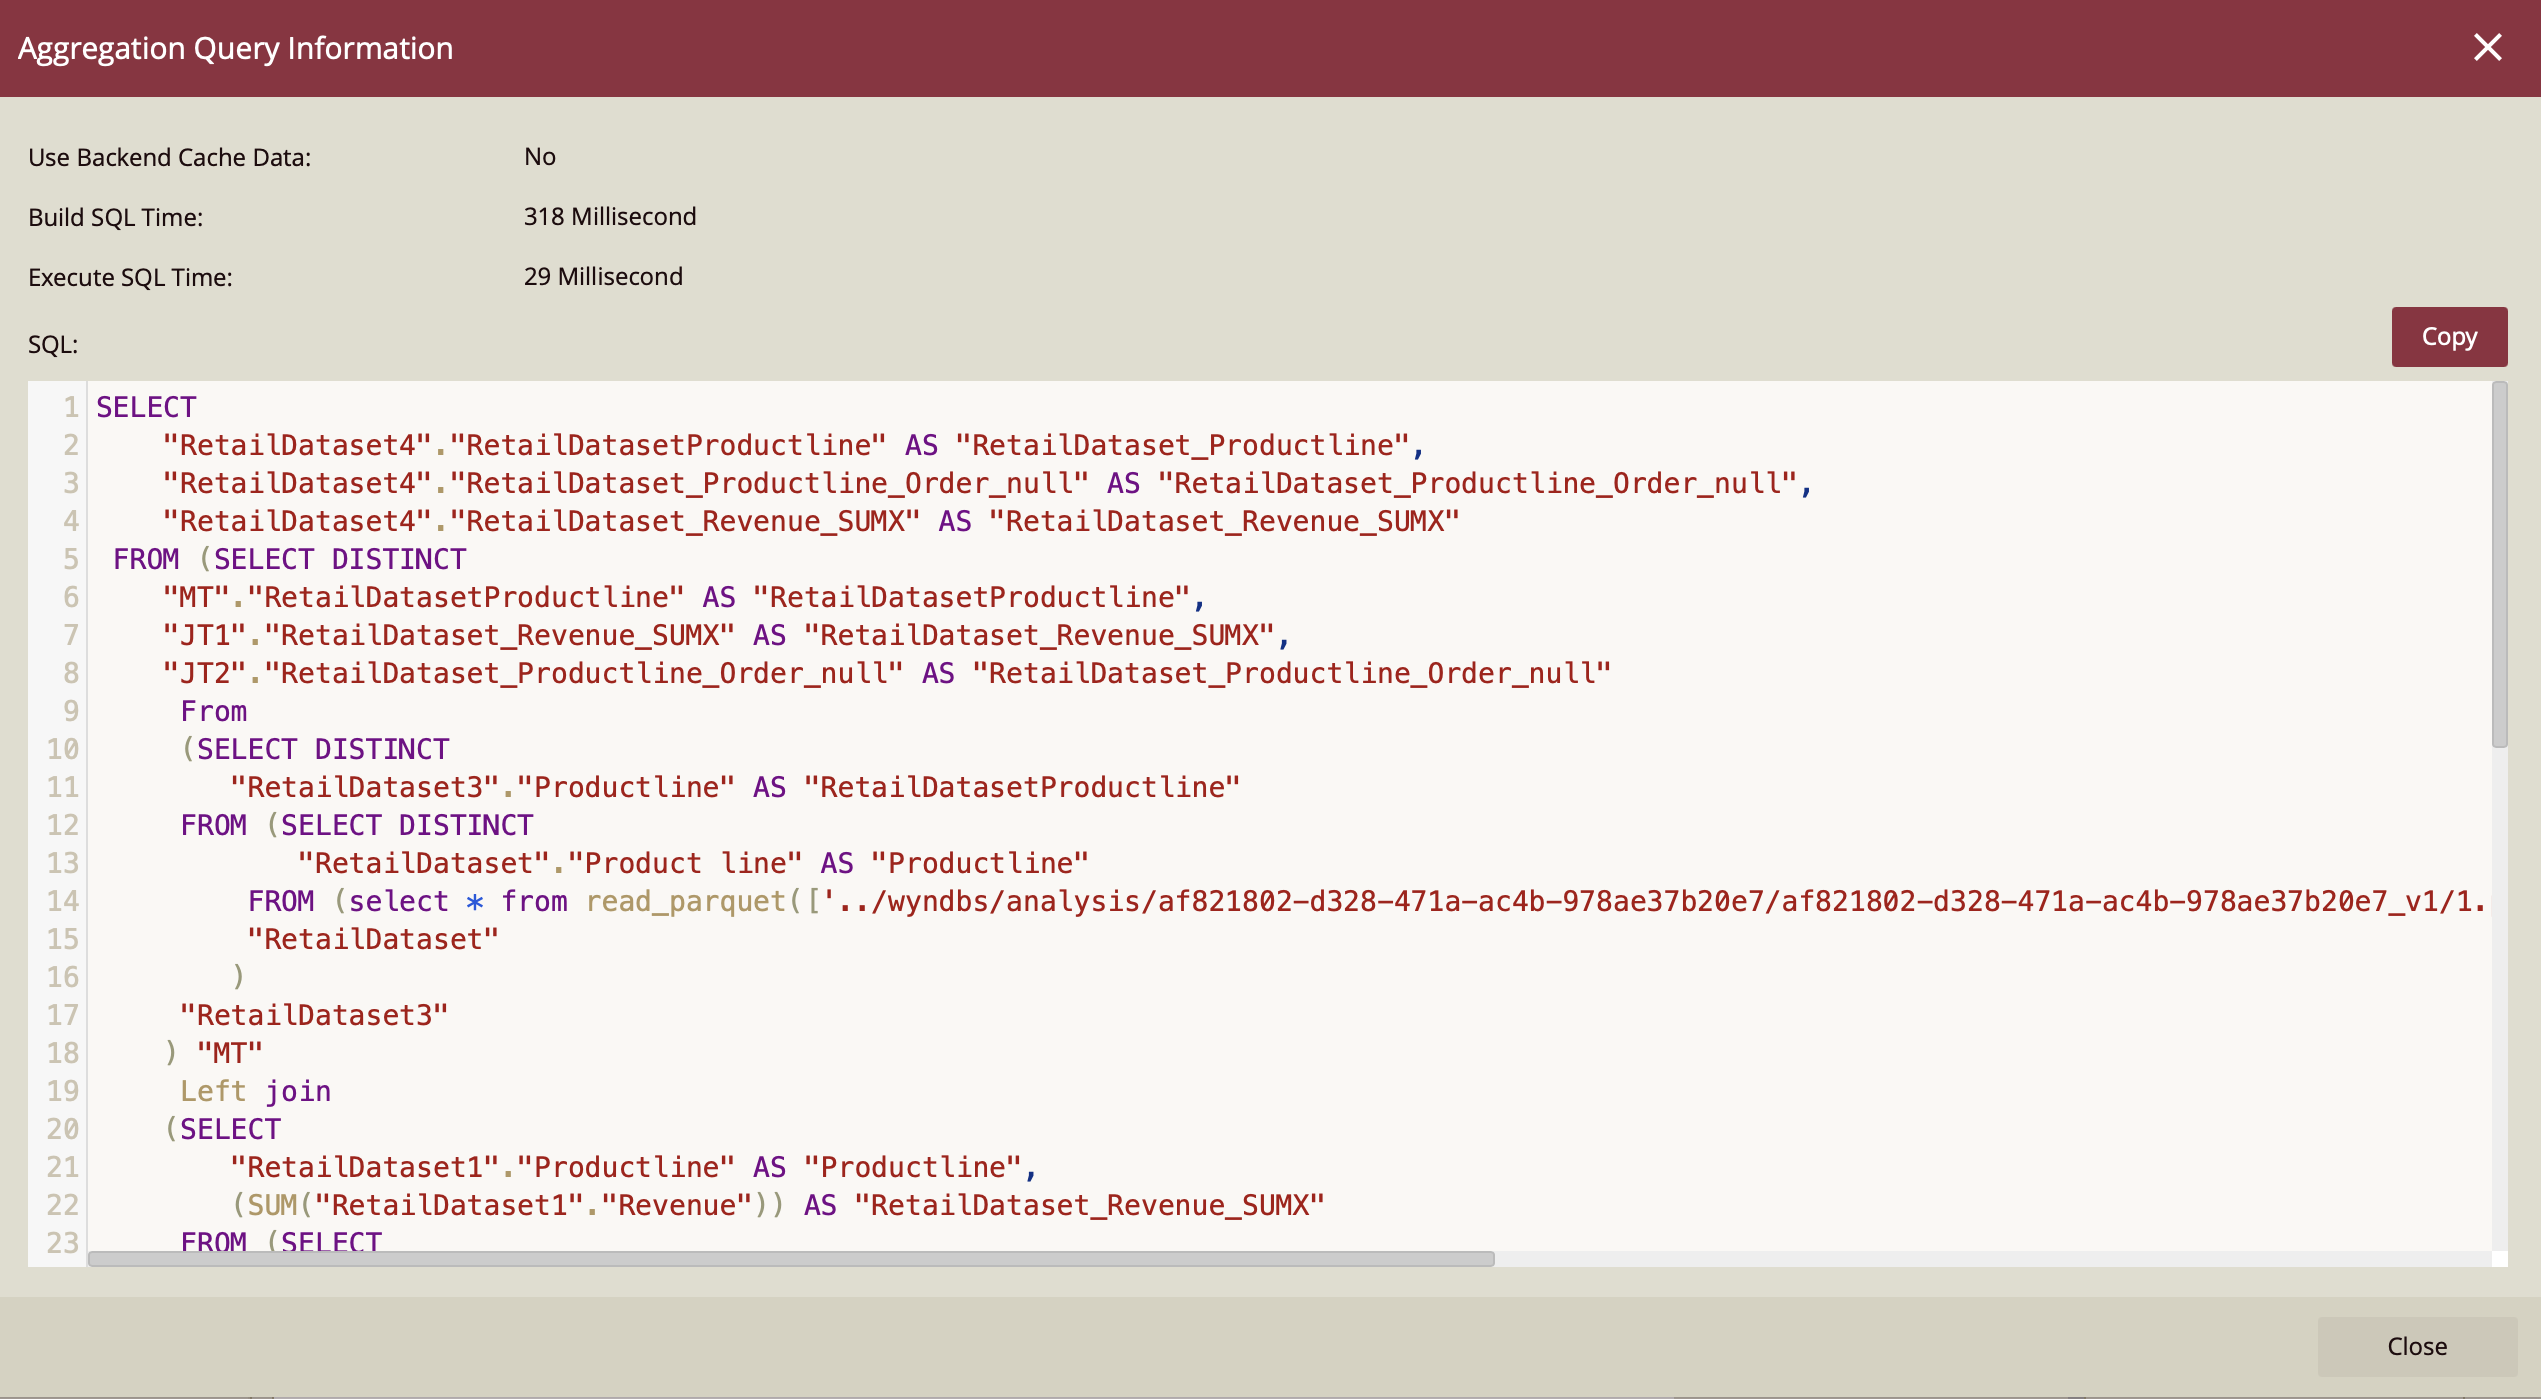
After the scenario is configured, an icon appears in the data exploration toolbar. The Aggregation Query Information icon is represented by a page containing the text “SQL” with a magnifying glass.

Selecting this icon opens the Aggregation Query Information window.
What the Window Displays
The window contains four key elements:
Use Backend Cache Data
Indicates whether the query result was retrieved from backend cache rather than fully executed against the data source.
In this example, the value is Yes, meaning cached data was used. Backend caching helps improve performance by reducing repeated execution of identical queries.
Build SQL Time
The time required to generate the SQL statement dynamically based on the scenario configuration.
In this case: 318 milliseconds.
Execute SQL Time
The time required for the database to execute the generated SQL statement.
In this case: 29 milliseconds.
SQL
The full SQL query executed for the visualization. This query can be copied and executed directly in the database for further analysis and optimization.
Example SQL (Column Chart)
The SQL generated for this column chart scenario includes joins, aggregations, grouping, ordering, and limit constraints based on the data bindings and visualization requirements.
SELECT
    "RetailDataset4"."RetailDatasetProductline" AS "RetailDataset_Productline",
    "RetailDataset4"."RetailDataset_Productline_Order_null" AS "RetailDataset_Productline_Order_null",
    "RetailDataset4"."RetailDataset_Revenue_SUMX" AS "RetailDataset_Revenue_SUMX"
...
ORDER BY  "RetailDataset_Productline" ASC NULLS FIRST
LIMIT 10000001
This query reflects:
Aggregation of revenue using
SUMGrouping by product line
Sorting logic applied to the axis
Null-handling logic
Data shaping required for the column chart
The complexity of the SQL demonstrates how the dashboard translates visual configuration into executable database logic.
Using Aggregation Query Information in a Rich Text Box
Aggregation Query Information is also available when using data aggregations inside a Rich Text Box.
Inserting a Data Aggregation
To insert a data aggregation:
Select the rich text box editor.
Click the pencil icon to edit.
From the toolbar, select the ∑ (Sigma) icon.
Configure the aggregation settings.
Click OK.
For more information about inserting aggregations, see the Rich Text Box Examples article, specifically the section on Dynamic Data Options.
Example: Aggregation in Rich Text Box
Using the same retail dataset:
Field: Year
Aggregation Method: Sum
Display Unit: Auto
Format: General
After confirming the configuration, the editor displays:
{Sum of Year}When the rich text box is selected, the Aggregation Query Information icon becomes available.
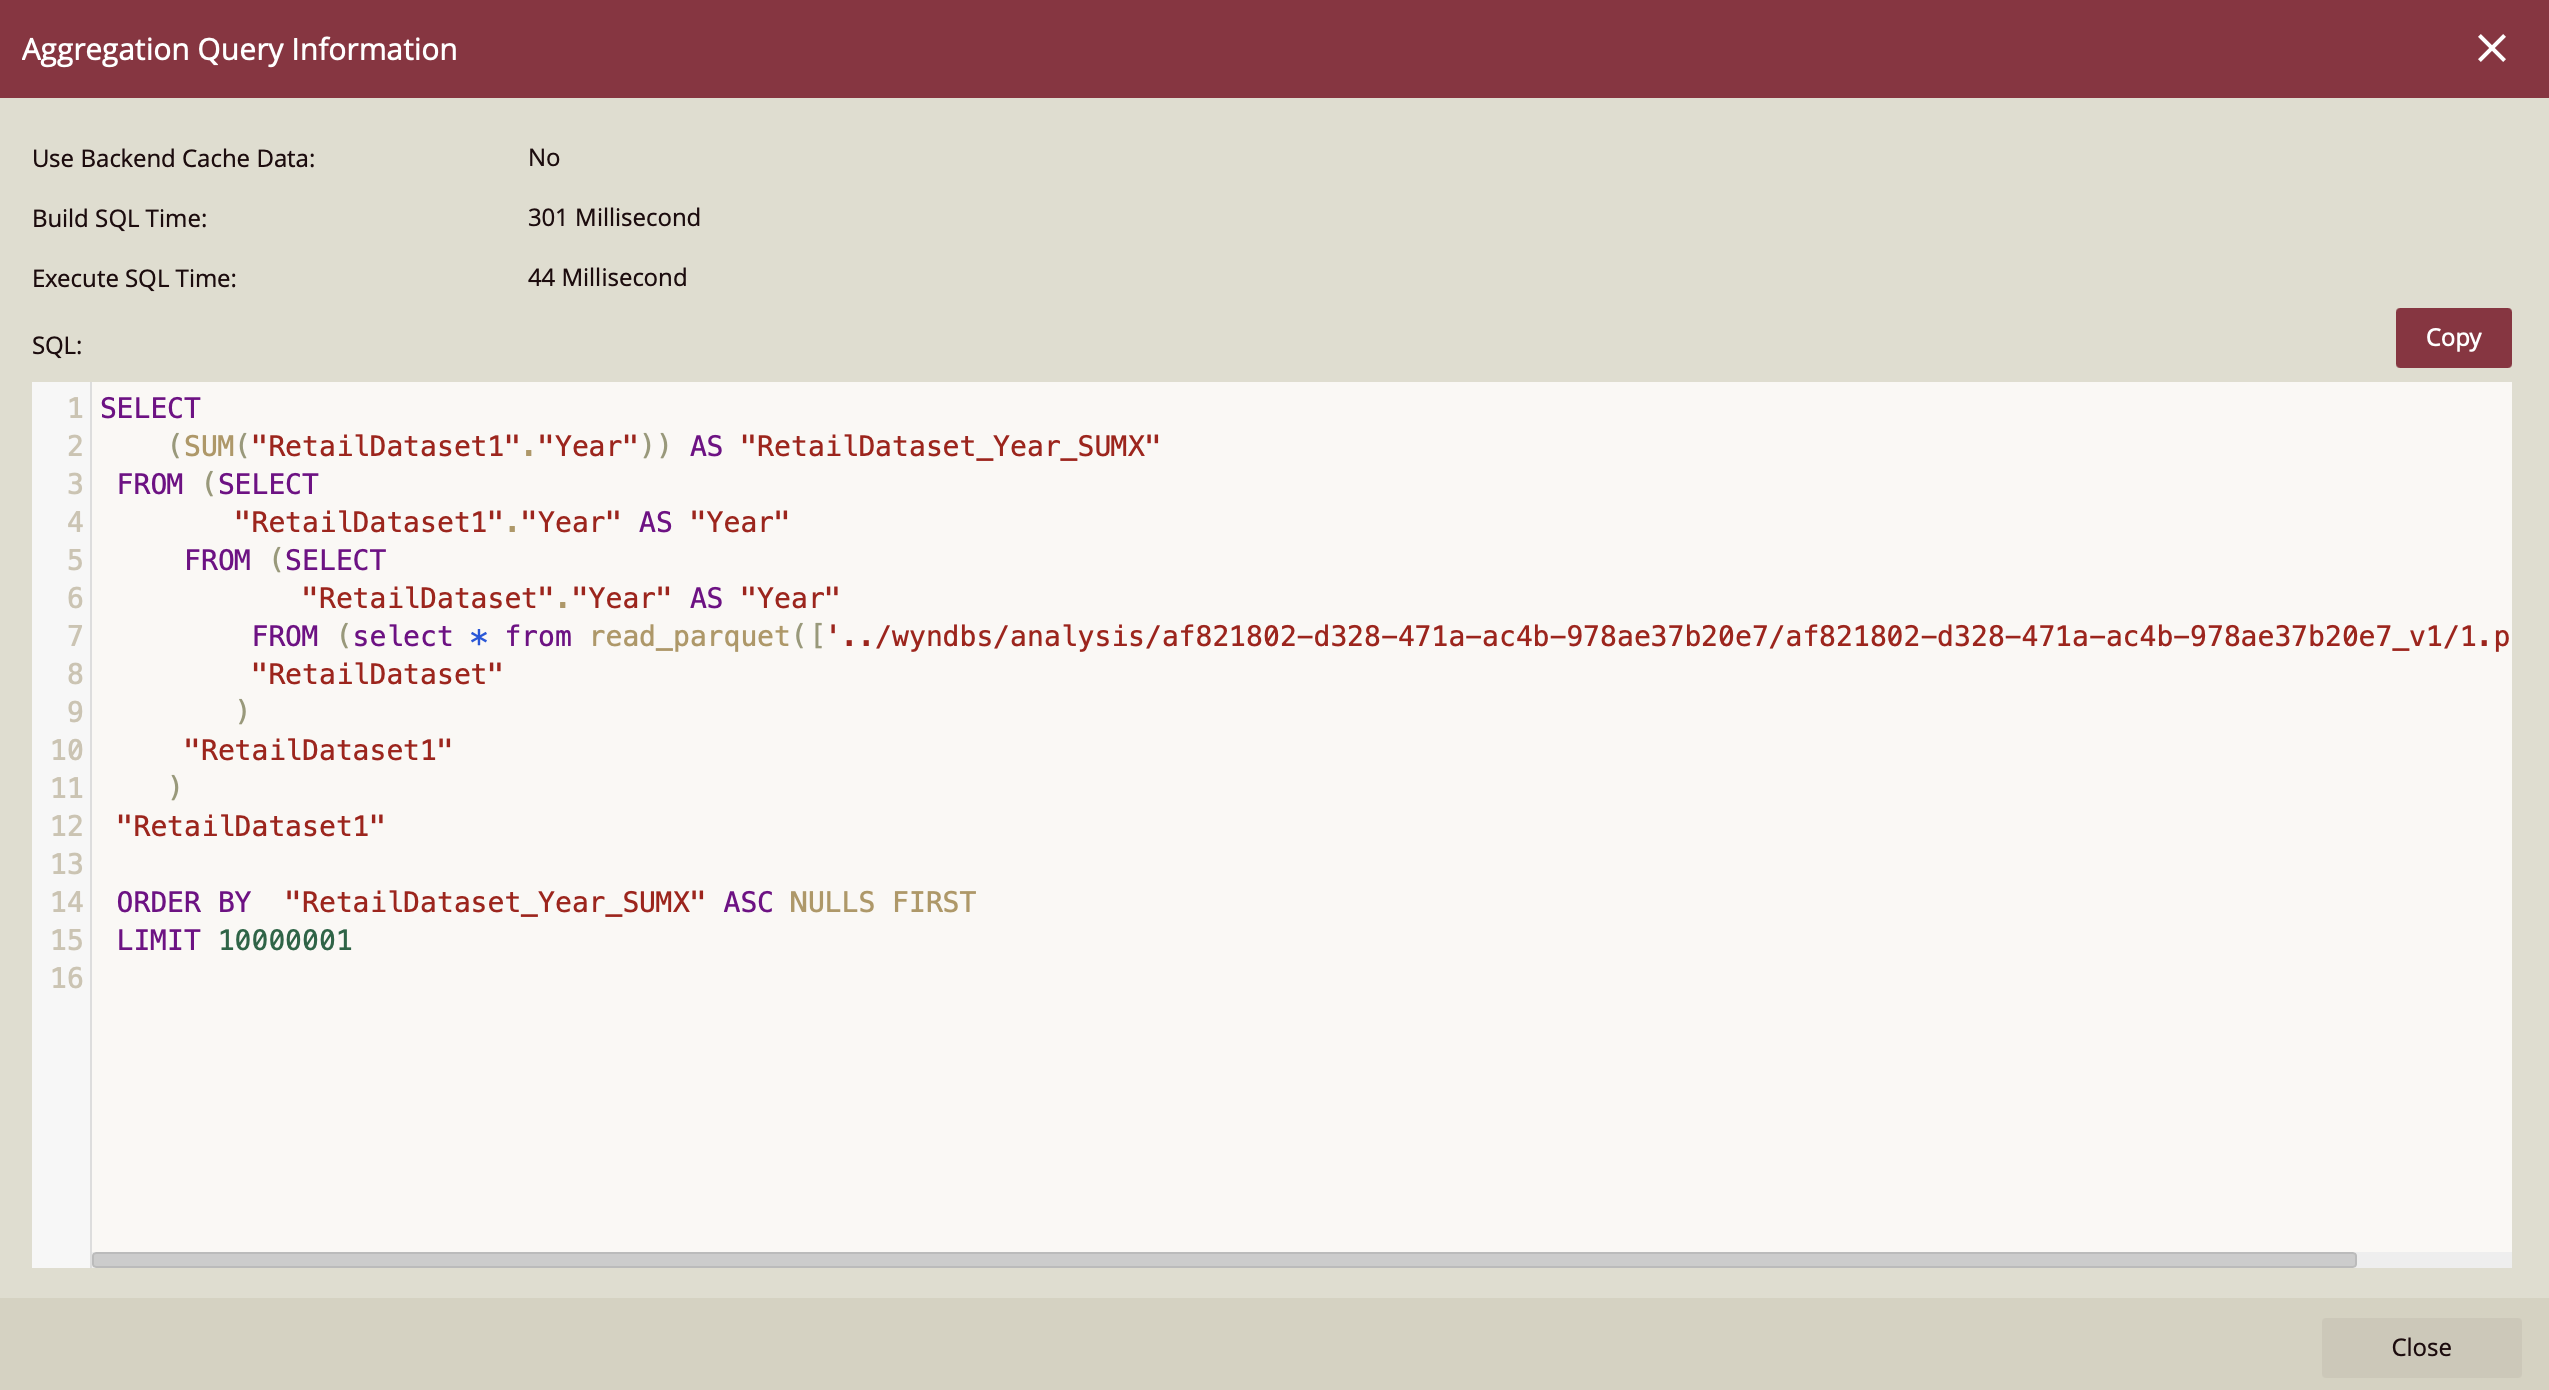
Opening the window displays:
Use Backend Cache Data: No
Build SQL Time: 301 milliseconds
Execute SQL Time: 44 milliseconds
SQL Expression: The generated query
Example SQL (Rich Text Box)
SELECT
    (SUM("RetailDataset1"."Year")) AS "RetailDataset_Year_SUMX"
 FROM (SELECT
        "RetailDataset1"."Year" AS "Year"
     FROM (SELECT
            "RetailDataset"."Year" AS "Year"
         FROM (select * from read_parquet(['../wyndbs/analysis/af821802-d328-471a-ac4b-978ae37b20e7/af821802-d328-471a-ac4b-978ae37b20e7_v1/1.parquet']))
         "RetailDataset"
        )
     "RetailDataset1"
    )
 "RetailDataset1"

 ORDER BY  "RetailDataset_Year_SUMX" ASC NULLS FIRST
 LIMIT 10000001
This SQL is simpler than the column chart example because:
No grouping is required.
No joins are required.
Only a single aggregation is performed.
Understanding Backend Cache Data
The Use Backend Cache Data indicator shows whether the system retrieved results from cached query output rather than re-executing the full SQL statement against the data source.
Yes means the query result was served from cache.
No means the query was executed directly against the data source.
Caching improves performance by reducing redundant query execution, especially in dashboards with repeated or identical queries.