-
Interactive DashboardsCreate interactive BI dashboards with dynamic visuals.
-
End-User BI ReportsCreate and deploy enterprise BI reports for use in any vertical.
-
Wyn AlertsSet up always-on threshold notifications and alerts.
-
Localization SupportChange titles, labels, text explanations, and more.
-
Wyn ArchitectureA lightweight server offers flexible deployment.
-
 Wyn Enterprise 7.1 is ReleasedThis release emphasizes Wyn document embedding and enhanced analytical express...
 -
 Choosing an Embedded BI Solution for SaaS ProvidersAdding BI features to your applications will improve your products, better serve your customers, and more. But where to start? In this guide, we discuss the many options.
-
Visual GalleryInteractive sample dashboards and reports.
-
BlogExplore Wyn, BI trends, and more.
-
WebinarsDiscover live and on-demand webinars.
-
Customer SuccessVisualize operational efficiency and streamline manufacturing processes.
-
Knowledge BaseGet quick answers with articles and guides.
-
VideosVideo tutorials, trends and best practices.
-
WhitepapersDetailed reports on the latest trends in BI.
-
 Choosing an Embedded BI Solution for SaaS ProvidersAdding BI features to your applications will impr...
 -

- Getting Started
- Administration Guide
-
User Guide
- An Introduction to Wyn Enterprise
- Document Portal for End Users
- Data Governance and Modeling
- View and Manage Documents
- Working with Resources
- Working with Reports
-
Working with Dashboards
- Tour the Dashboard Designer
- Create a Dashboard
- Configure Dashboard
- Dashboard Data Binding
- Scenarios
- Appearance
- Component Management
- Parameters
- Interactions
- Finalize Your Dashboard
- Using AI in Wyn
- Working with Notebooks
- Wyn Analytical Expressions
- Section 508 Compliance
- Subscribe to RSS Feed for Wyn Builds Site
- Developer Guide
Show Data
The Show Data button allows dashboard users to view the underlying dataset behind a scenario without leaving the dashboard canvas. It provides a structured, tabular view of the data currently bound to the visualization, making it easier to validate values, review detailed records, and better understand how the visual representation is constructed.
How to Access Show Data
The Show Data button is part of the vertical Data Exploration Action Bar located on the right side of a scenario. However, it is not immediately visible by default.
To access Show Data, you must first click Focus from the horizontal action bar at the top of the scenario. When a scenario is placed in Focus mode, it expands to fill the dashboard canvas and enables additional exploration capabilities. At this point, the Show Data button becomes available on the right-hand side.
This contextual behavior ensures that detailed data inspection is performed intentionally and within an expanded, distraction-free view of the scenario.
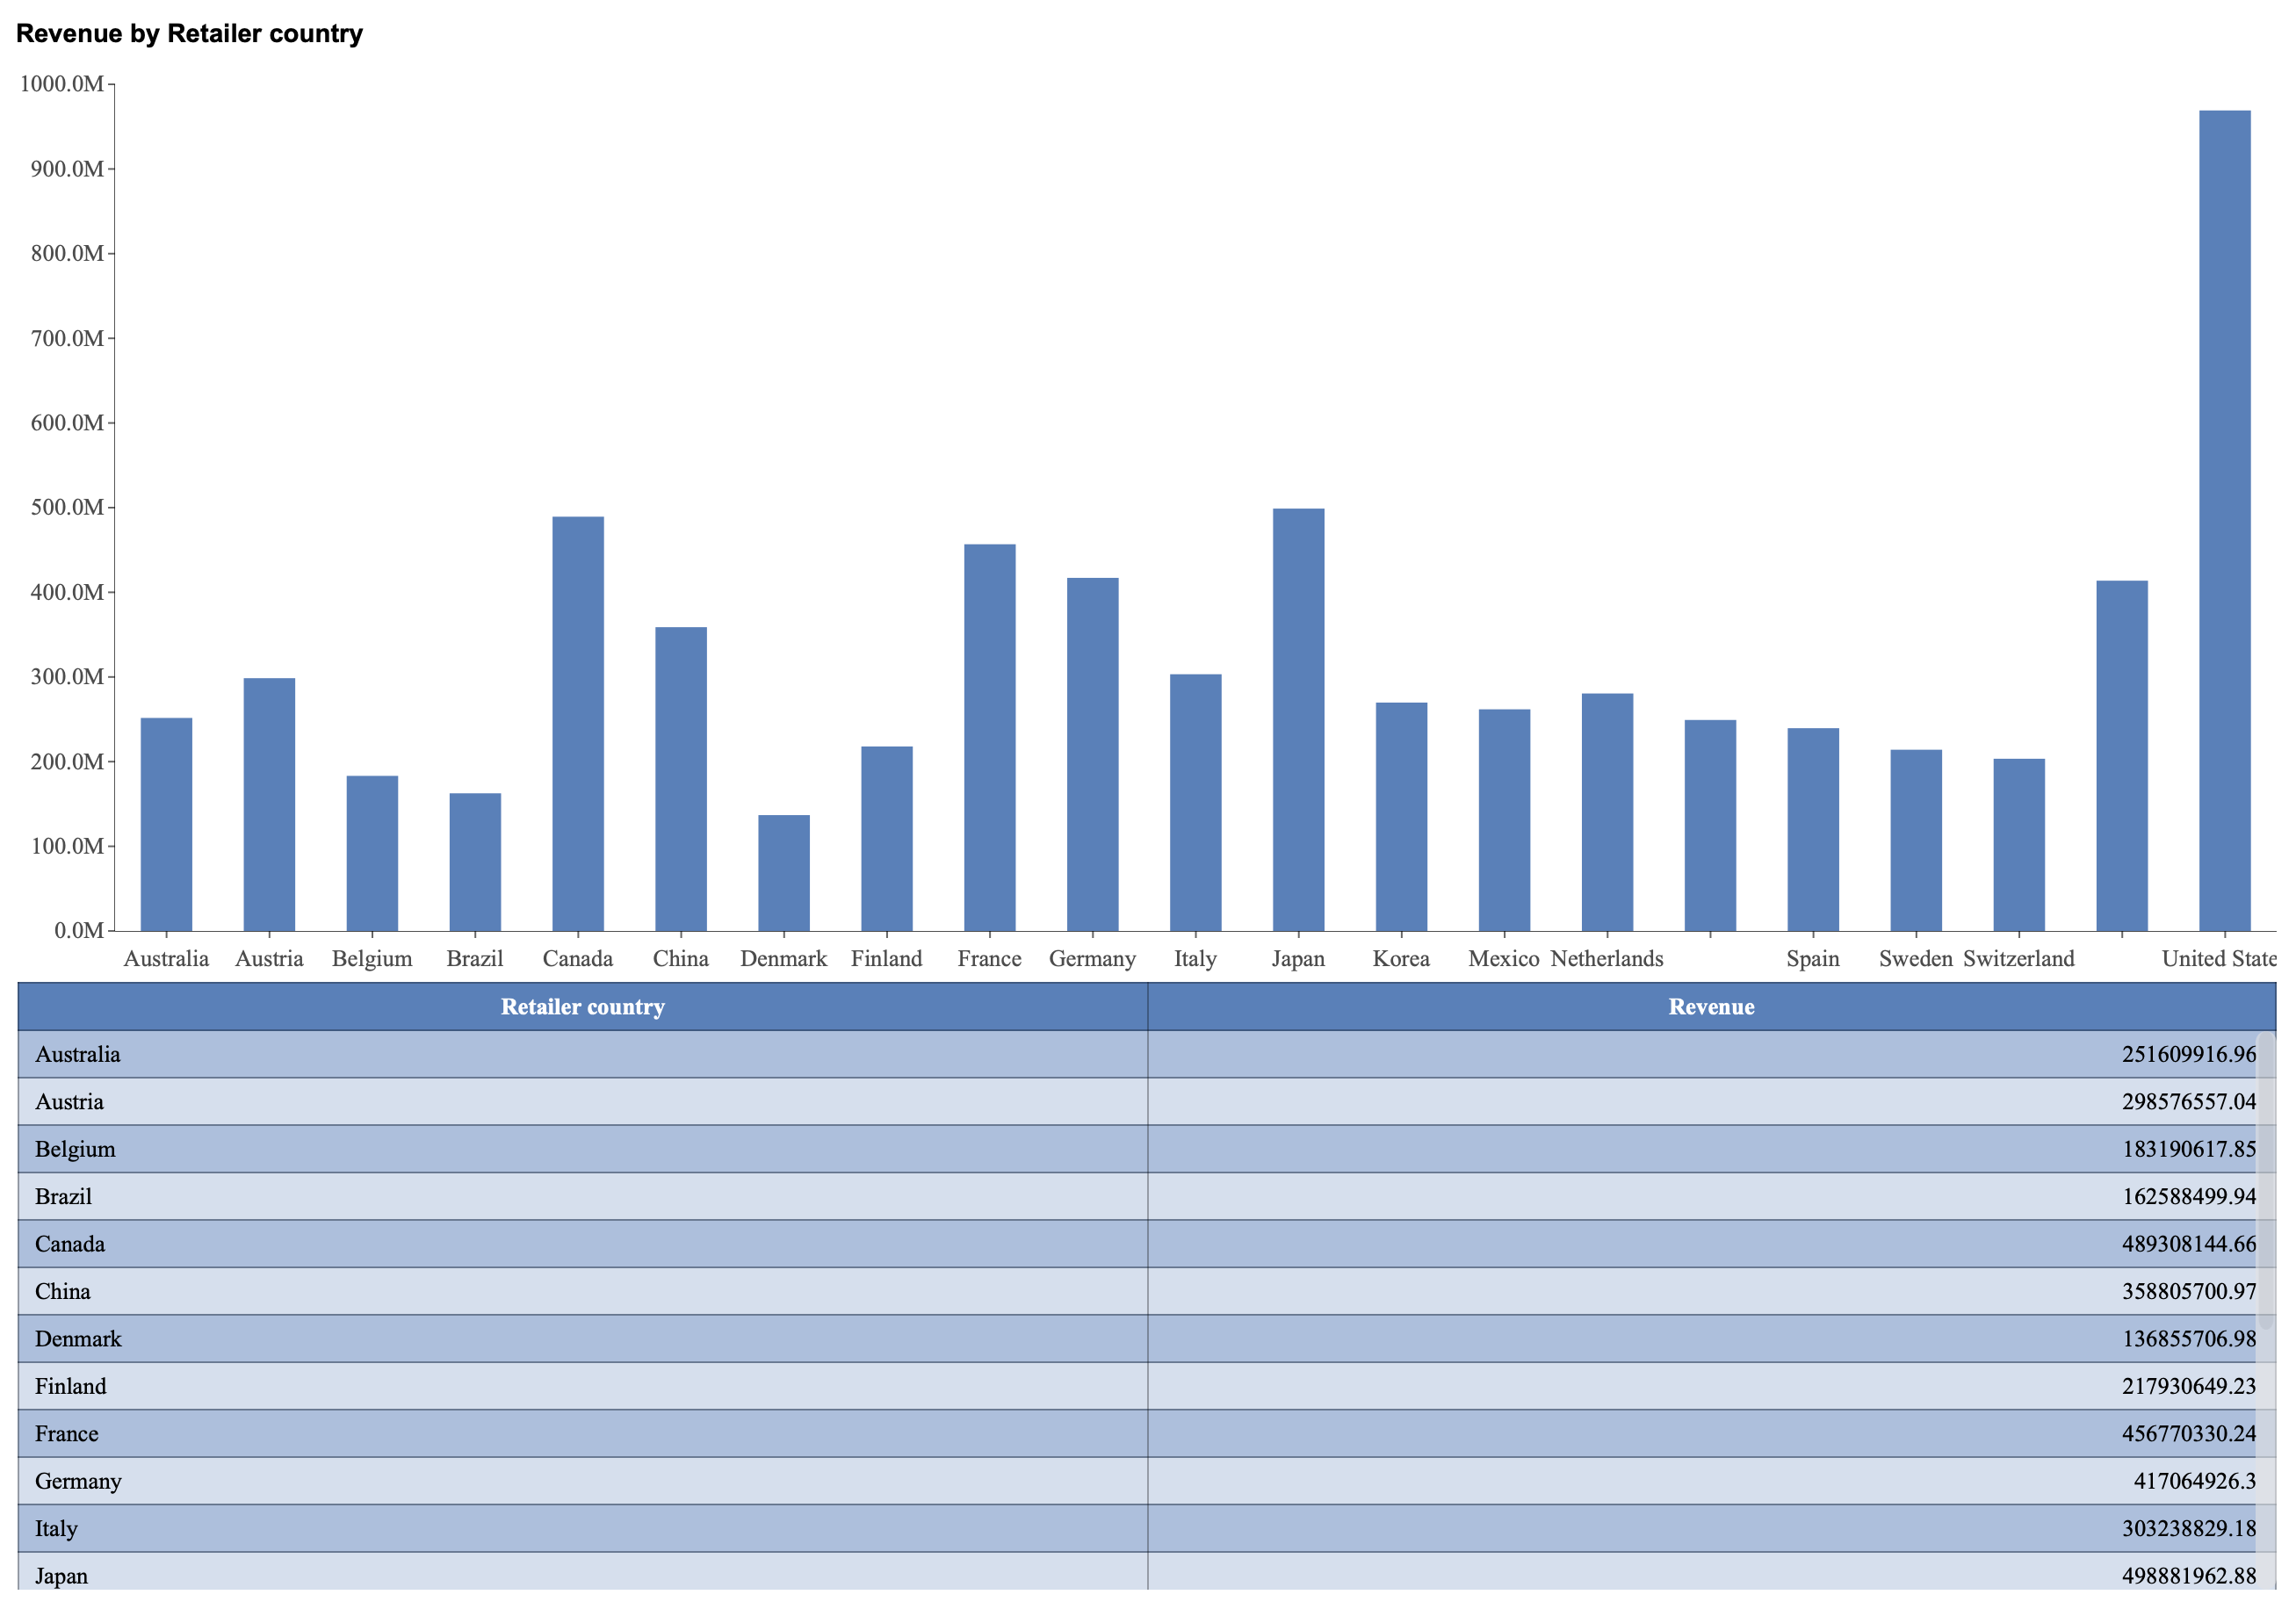
Viewing the Data Table
When you click Show Data, a data table appears displaying all data currently bound to the visualization. The table reflects the fields used in the scenario, including:
Dimension fields (such as Retailer Country)
Measure fields (such as Revenue)
Any applied filters, sorting, or aggregations
The displayed table represents the exact dataset powering the chart, allowing users to cross-reference visual elements with their corresponding data values. This makes it especially useful for verification, deeper analysis, or exporting insights to external workflows.
If you want to change the style of the data table, see the article on Show Data Table Style.