-
Interactive DashboardsCreate interactive BI dashboards with dynamic visuals.
-
End-User BI ReportsCreate and deploy enterprise BI reports for use in any vertical.
-
Wyn AlertsSet up always-on threshold notifications and alerts.
-
Localization SupportChange titles, labels, text explanations, and more.
-
Wyn ArchitectureA lightweight server offers flexible deployment.
-
 Wyn Enterprise 7.1 is ReleasedThis release emphasizes Wyn document embedding and enhanced analytical express...
 -
 Choosing an Embedded BI Solution for SaaS ProvidersAdding BI features to your applications will improve your products, better serve your customers, and more. But where to start? In this guide, we discuss the many options.
-
Visual GalleryInteractive sample dashboards and reports.
-
BlogExplore Wyn, BI trends, and more.
-
WebinarsDiscover live and on-demand webinars.
-
Customer SuccessVisualize operational efficiency and streamline manufacturing processes.
-
Knowledge BaseGet quick answers with articles and guides.
-
VideosVideo tutorials, trends and best practices.
-
WhitepapersDetailed reports on the latest trends in BI.
-
 Choosing an Embedded BI Solution for SaaS ProvidersAdding BI features to your applications will impr...
 -

- Getting Started
- Administration Guide
-
User Guide
- An Introduction to Wyn Enterprise
- Document Portal for End Users
- Data Governance and Modeling
- View and Manage Documents
- Working with Resources
- Working with Reports
-
Working with Dashboards
- Tour the Dashboard Designer
- Create a Dashboard
- Configure Dashboard
-
Dashboard Data Binding
- Data Attributes
- Scenarios
- Appearance
- Component Management
- Parameters
- Interactions
- Finalize Your Dashboard
- Using AI in Wyn
- Working with Notebooks
- Wyn Analytical Expressions
- Section 508 Compliance
- Subscribe to RSS Feed for Wyn Builds Site
- Developer Guide
% Change Over Time Calculation
% Change Over Time calculations compare the current value with a value from a previous period and display the percentage increase or decrease between them. Rather than showing the original value or the numeric difference, the chart shows how much the value changed relative to the earlier value.
% Change Over Time calculations are useful when you want to compare performance across periods with different scales. For example, a sales increase of 10,000 may be significant for one category but minor for another. Displaying the percentage change makes it easier to compare relative growth and decline across different values.
% Change Over Time is only available when a date attribute is bound to the Axis (Category) data binding slot. It can also be used when a date attribute is bound to the Legend (Series) data binding slot, although that scenario is less common and typically more complex.
Applying a % Change Over Time calculation fundamentally changes how the chart is interpreted. The value axis no longer represents the original measure. Instead, it represents the percentage difference between the current value and a previous value.
Understanding % Change Over Time Calculation Settings
When you select % Change Over Time from the Quick Functions menu, several predefined options are available.
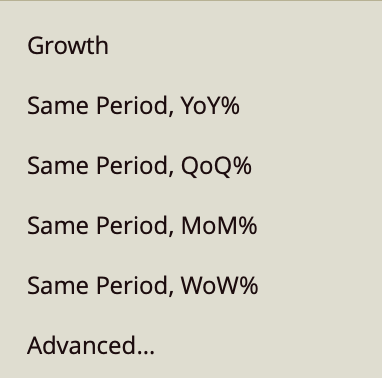
Growth
Growth shows the relative rate of increase or decrease between the current period and the previous period. Unlike a simple numeric difference, growth rate focuses on how much larger or smaller the current value is compared to the earlier value.
From Previous Period
From Previous Period compares each value to the immediately preceding period in the sequence.
For example:
Years are compared to the previous year.
Quarters are compared to the previous quarter.
Months are compared to the previous month.
Weeks are compared to the previous week.
Same Period, YoY%
Same Period, YoY% stands for year-over-year percentage comparison. It compares each value to the same period in the previous year and displays the percentage difference.
For example, Q2 2026 is compared to Q2 2025.
Same Period, QoQ%
Same Period, QoQ% stands for quarter-over-quarter percentage comparison. It compares each value to the same period in the previous quarter and displays the percentage difference.
Same Period, MoM%
Same Period, MoM% stands for month-over-month percentage comparison. It compares each value to the same period in the previous month and displays the percentage difference.
Same Period, WoW%
Same Period, WoW% stands for week-over-week percentage comparison. It compares each value to the same period in the previous week and displays the percentage difference.
Advanced
The Advanced option provides more control over how the comparison is calculated. It is also shared by related Quick Functions such as Past Value and Change Over Time.
The Advanced configuration panel includes the following settings:
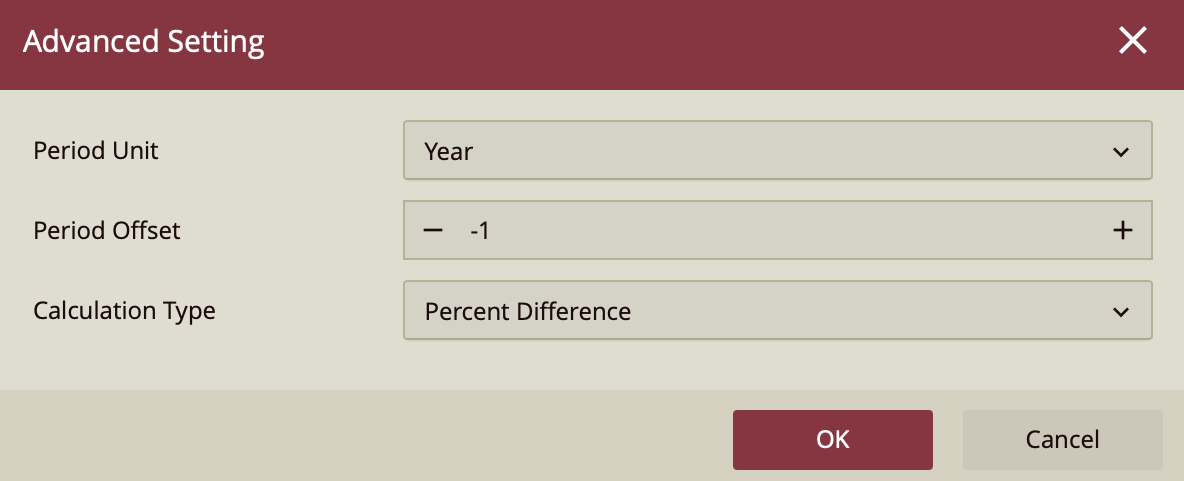
Period Unit
The Period Unit determines the time interval used for the comparison.
Available options are:
Year
Quarter
Month
Week
Day
Hour
Minute
Second
Period Offset
The Period Offset determines how far backward or forward the comparison should look.
A value of -1 compares the current value to the immediately previous period. For example:
Year with an offset of -1 compares to the previous year.
Quarter with an offset of -1 compares to the previous quarter.
Month with an offset of -1 compares to the previous month.
You can also use larger offsets. For example, an offset of -2 compares to two periods earlier, while an offset of 1compares to the next period.
Calculation Type
The Calculation Type determines how the current value and the previous value are compared.
Value returns the actual value from the previous period.
Ratio returns the ratio between the current value and the previous value.
Difference returns the numeric difference between the current value and the previous value.
Percent Difference returns the percentage change between the current value and the previous value.
The selected calculation type can also affect which Quick Function appears selected in the menu:
If Calculation Type is set to Value, the Quick Function remains under Past Value.
If Calculation Type is set to Ratio or Difference, the Quick Function appears under Change Over Time.
If Calculation Type is set to Percent Difference, the Quick Function appears under % Change Over Time.
Similarly, when the Advanced settings match one of the predefined options, the predefined option appears selected in the Quick Functions menu. For example, if the configuration uses:
Period Unit: Month
Period Offset: -1
Calculation Type: Percent Difference
then the Quick Functions menu displays Same Period, MoM% rather than Advanced. The Advanced label typically only appears when the configuration does not match one of the predefined options.
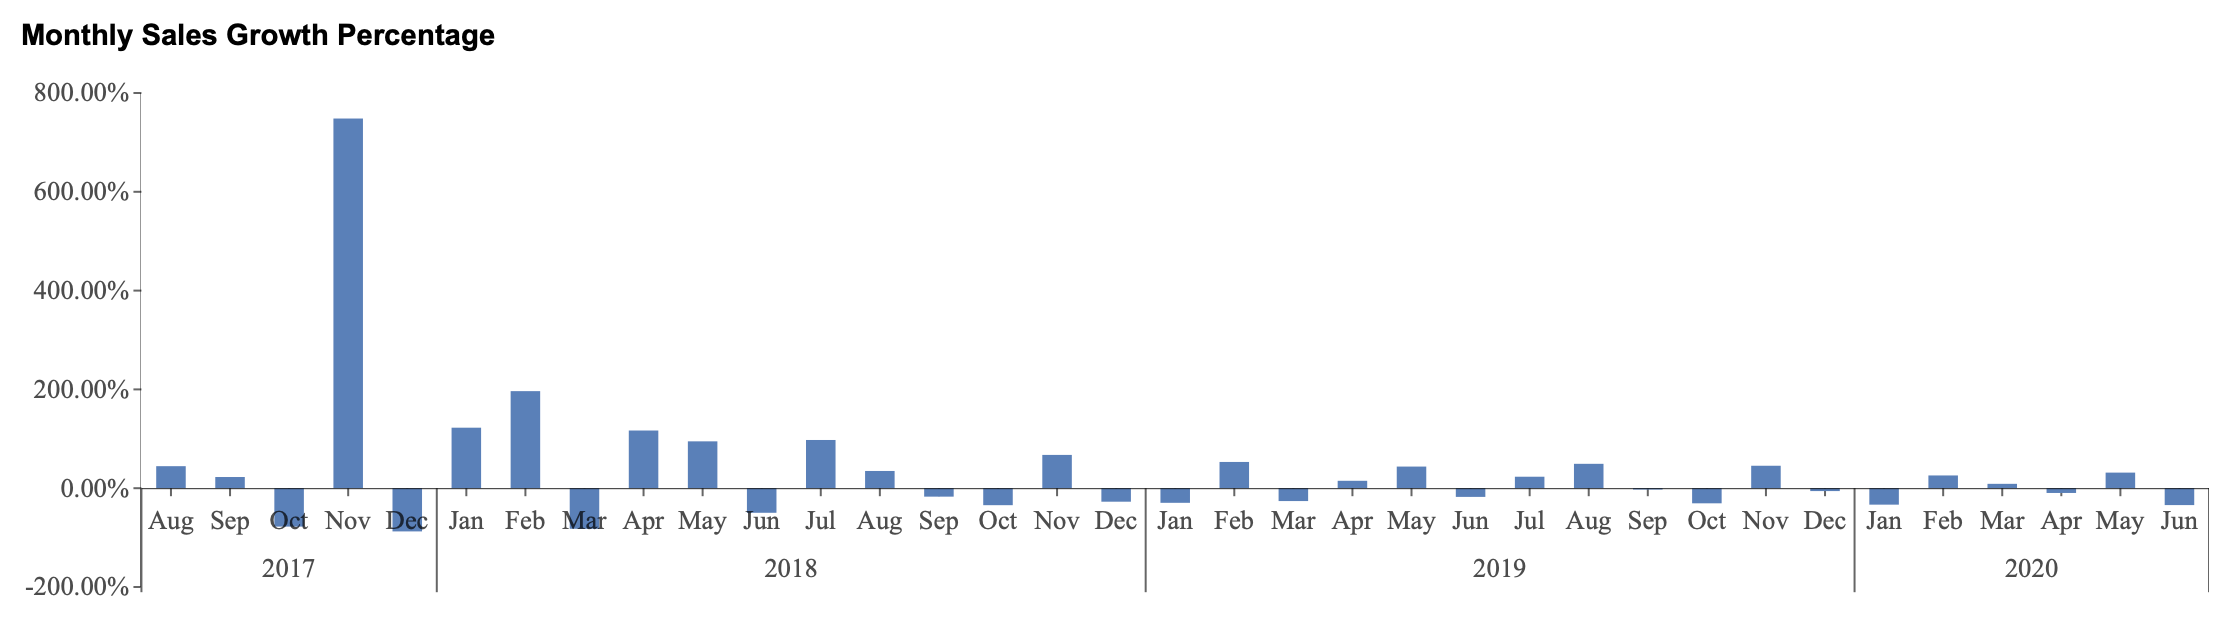
% Change Over Time on a Column Chart
In this example, a % Change Over Time calculation is applied across the dataset to show month-over-month sales growth percentages.

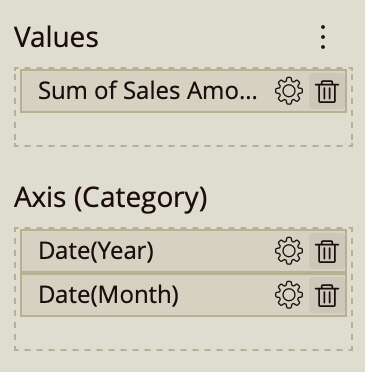
Create a column chart and bind Sales Amount to the Values data binding slot.
Bind Date (Year) and Date (Month) to the Axis (Category) data binding slot, in that order, using the existing date hierarchy from the data model.
Open the Quick Functions menu for Sales Amount (gear icon) and select Same Period, MoM%.
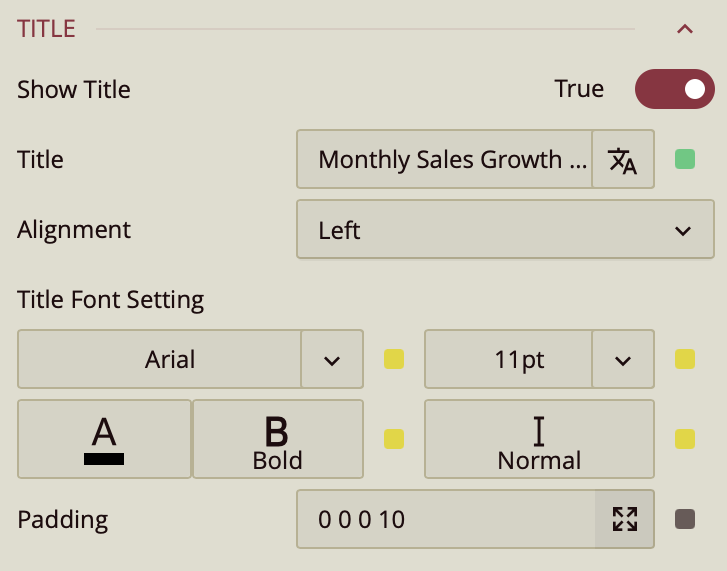
In the Inspector panel, expand the Title section and set the title to Monthly Sales Growth Percentage.
In this configuration, the chart displays the percentage change between each month and the previous month. Rather than showing the original sales amount for each month, each column represents how much sales increased or decreased relative to the previous month.