-
Interactive DashboardsCreate interactive BI dashboards with dynamic visuals.
-
End-User BI ReportsCreate and deploy enterprise BI reports for use in any vertical.
-
Wyn AlertsSet up always-on threshold notifications and alerts.
-
Localization SupportChange titles, labels, text explanations, and more.
-
Wyn ArchitectureA lightweight server offers flexible deployment.
-
 Wyn Enterprise 7.1 is ReleasedThis release emphasizes Wyn document embedding and enhanced analytical express...
 -
 Choosing an Embedded BI Solution for SaaS ProvidersAdding BI features to your applications will improve your products, better serve your customers, and more. But where to start? In this guide, we discuss the many options.
-
Visual GalleryInteractive sample dashboards and reports.
-
BlogExplore Wyn, BI trends, and more.
-
WebinarsDiscover live and on-demand webinars.
-
Customer SuccessVisualize operational efficiency and streamline manufacturing processes.
-
Knowledge BaseGet quick answers with articles and guides.
-
VideosVideo tutorials, trends and best practices.
-
WhitepapersDetailed reports on the latest trends in BI.
-
 Choosing an Embedded BI Solution for SaaS ProvidersAdding BI features to your applications will impr...
 -

- Getting Started
- Administration Guide
-
User Guide
- An Introduction to Wyn Enterprise
- Document Portal for End Users
- Data Governance and Modeling
- View and Manage Documents
- Working with Resources
- Working with Reports
-
Working with Dashboards
- Tour the Dashboard Designer
- Create a Dashboard
- Configure Dashboard
- Dashboard Data Binding
- Scenarios
- Appearance
- Component Management
- Parameters
- Interactions
- Finalize Your Dashboard
- Using AI in Wyn
- Working with Notebooks
- Wyn Analytical Expressions
- Section 508 Compliance
- Subscribe to RSS Feed for Wyn Builds Site
- Developer Guide
Rich Text Box Editor
Formatting Options
You can adjust text formatting in the Rich Text editor to control font, style, and emphasis.
Font and Text Styles
Font – Select a font family for the text.
Font Size – Choose from supported sizes: 8px, 9px, 10px, 11px, 12px, 13px, 14px, 16px, 18px, 20px, 22px, 24px, 26px, 28px, 30px, 32px, 34px, 36px, 38px, 40px, 64px, and 128px.
Bold – Make the text darker and heavier for emphasis.
Italics – Slant the text to the right, typically used for emphasis.
Underline – Add a line beneath the text to highlight it.
Strikethrough – Draw a line through the text to indicate that it is invalid or no longer relevant.
Background Color – Apply a highlight color to the background of selected text.
Font Color – Change the text color to emphasize specific words or phrases.
Lists
Numbered List – Create an ordered list where items are numbered.
Bulleted List – Create an unordered list where items are marked with bullet points.
Positioning
Text Align – Align text horizontally to the left, center, or right.
Text Indent – Add spacing between the margin and the start of a line. You can increase or decrease indentation as needed.
Superscript – Display text slightly above the baseline (commonly used in footnotes or exponents).
Subscript – Display text slightly below the baseline (commonly used in chemical formulas or mathematical notation).
Dynamic Data Options in the Rich Text Component
The Rich Text component in Wyn Dashboards supports Dynamic Data Options, which allow you to insert live, data-driven values directly into your text. This makes it possible to display context-aware KPIs, metrics, or summaries within narrative text, such as embedding a total sales figure in a paragraph.
To access Dynamic Data Options:
Add or select a Rich Text component on the dashboard canvas.
Click Edit to open the rich text editor.
From the editor toolbar, click the Σ (Insert Data Aggregation) icon.
A configuration window opens where you can define how data is inserted into your text.
Configuration Options
Dataset
Use the + button to add a dataset or select one from the dropdown list. The chosen dataset provides the fields you can aggregate and display in text.
Field
Choose the data field (column) you want to insert. For example, TotalSales or OrderCount.
Aggregation Method
Specify how the field values should be summarized, such as Sum, Average, Count, Min, Max, etc.
Display Unit
Define the unit format for large values (e.g., None, Thousands, Millions, Billions). This is helpful for readability when displaying large numbers.
Format
Set the display format, such as number precision, currency, or percentage. This ensures the value appears in the desired style within your text.
Quick Functions
Apply pre-built calculations, such as Year-to-Date, Rank, or other common transformations, without writing complex expressions.
Filter
Apply filters to restrict the aggregation to a subset of data (e.g., only sales for 2024, or only orders from Region = "North America").
Conditional Formatting
Add rules to format the dynamic data value based on conditions. For example, display the number in red if sales fall below target.
Finalizing the Insertion
Apply / OK → Inserts the configured data field into the text editor. The dynamic value appears inline with your narrative and will update as the dataset refreshes.
Cancel → Closes the dialog without inserting any data.
Example Use Cases
Embedding a live total sales figure into a dashboard title:
“The total sales this quarter are $5.2M.”
Displaying a KPI comparison inline with supporting commentary:
“Customer satisfaction is at 89%, which is above our yearly goal.”
Insert Variable in the Rich Text Component
The Insert Variable option allows you to embed user-defined variables or system context values directly in your text. This is useful for making your narrative text dynamic, for example, displaying the current user’s name, or the last time a dataset was refreshed.
To insert a variable:
In the Rich Text editor, click the {} (Insert Variable) icon on the toolbar.
In the input box, type the variable you want to use.
Supported Variables
User Variables
Access information about the logged-in user. For example:
user["name"]→ Displays the current user’s name.user["email"]→ Displays the user’s email.
Dataset Variables
Access information about datasets referenced in the dashboard. For example:
datasets["SalesData"].lastUpdated→ Displays the last refresh time of the SalesData dataset.
Syntax Notes
In other parts of Wyn, variables are wrapped inside
#{}(for example:#{user["name"]}).In the Rich Text editor, the
#{}wrapper is not required. You can type the variable directly (e.g.,user["name"]).
Example Use Cases
Adding a personalized greeting:
“Welcome back, user["name"]!”
Showing dataset freshness:
“This report was last updated on datasets["SalesData"].lastUpdated.”
Insert Jump To in the Rich Text Component
The Insert Jump To option allows you to create interactive links within the Rich Text editor. These links can redirect users to another location, such as a different dashboard, a report, an external URL, or even another section of the same dashboard. This is useful when you want to guide users through a narrative or provide quick access to related content.
To insert a Jump To link:
In the Rich Text editor, highlight the text you want to turn into a link.
Click the 🔗 Jump To icon on the toolbar.
In the configuration window, choose the type of link you want to create.
Supported Jump To Targets
Dashboard → Redirects the user to another dashboard within Wyn.
Report → Opens a Wyn Report.
URL → Opens an external website link.
Dashboard Section → Navigates to a different section (or tab) of the same dashboard.
Additional Options
Parameters: You can pass field values or variables as parameters when linking, so the target dashboard or report can filter automatically based on the context.
Open Behavior: Choose whether the target opens in the same tab, a new tab, or embedded inside a panel.
Example Use Cases
Adding a help link:
“For more details, see the full Sales Report.” (links to a Wyn Report).
Creating guided navigation:
*“Click **here *to drill into the Regional Dashboard.”
Linking to external resources:
*“Visit the **company site *for documentation.”
Further Customize Rich Text Box Editor
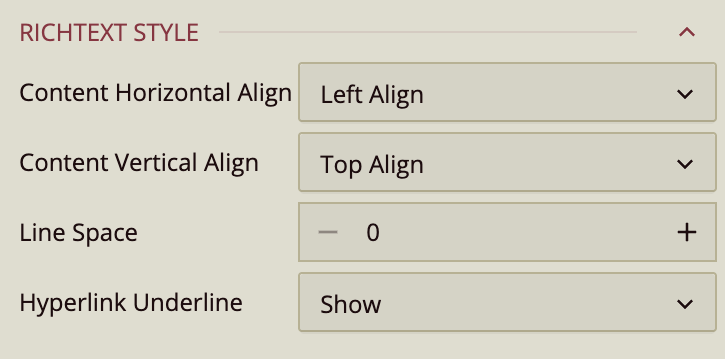
Content Horizontal Alignment
Use this property to control the horizontal alignment of content.
Left – Aligns content to the left.
Center – Aligns content to the center.
Right – Aligns content to the right.
Content Vertical Alignment
Use this property to control the vertical alignment of content.
Top – Aligns content to the top.
Middle – Aligns content to the middle.
Bottom – Aligns content to the bottom.
Line Spacing
Defines the amount of space between lines of text. The default value is 0.
Hyperlink Underline
Controls how hyperlinks are underlined in the content.
Show – Always display underlines.
Hide – Never display underlines.
Show on Hover – Display underlines only when the user hovers over the link.
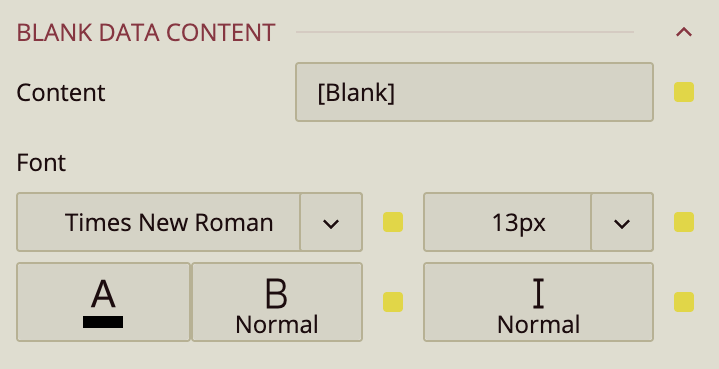
Blank Data Content
Controls how blank values from the dataset are displayed.
Content – Defines the text to display when data is blank.
Font – Configures the font family, size, weight, and style of the blank data text.
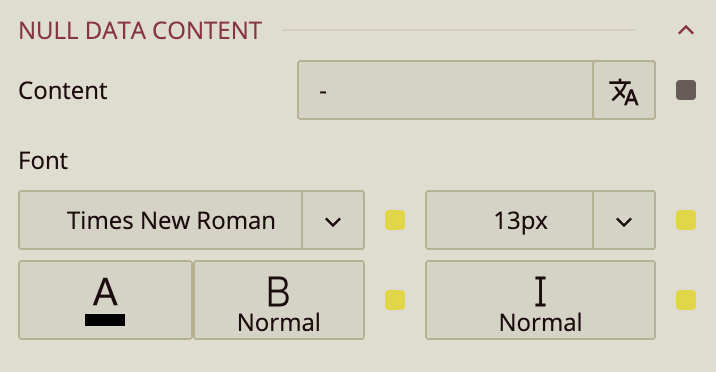
Null Data Content
Controls how null values from the dataset are displayed.
Content – Defines the text to display when data is null.
Font – Configures the font family, size, weight, and style of the null data text.