-
Interactive DashboardsCreate interactive BI dashboards with dynamic visuals.
-
End-User BI ReportsCreate and deploy enterprise BI reports for use in any vertical.
-
Wyn AlertsSet up always-on threshold notifications and alerts.
-
Localization SupportChange titles, labels, text explanations, and more.
-
Wyn ArchitectureA lightweight server offers flexible deployment.
-
 Wyn Enterprise 7.1 is ReleasedThis release emphasizes Wyn document embedding and enhanced analytical express...
 -
 Choosing an Embedded BI Solution for SaaS ProvidersAdding BI features to your applications will improve your products, better serve your customers, and more. But where to start? In this guide, we discuss the many options.
-
Visual GalleryInteractive sample dashboards and reports.
-
BlogExplore Wyn, BI trends, and more.
-
WebinarsDiscover live and on-demand webinars.
-
Customer SuccessVisualize operational efficiency and streamline manufacturing processes.
-
Knowledge BaseGet quick answers with articles and guides.
-
VideosVideo tutorials, trends and best practices.
-
WhitepapersDetailed reports on the latest trends in BI.
-
 Choosing an Embedded BI Solution for SaaS ProvidersAdding BI features to your applications will impr...
 -

- Getting Started
- Administration Guide
-
User Guide
- An Introduction to Wyn Enterprise
- Document Portal for End Users
- Data Governance and Modeling
- View and Manage Documents
- Working with Resources
-
Working with Reports
- Report Designer
- Data Binding in Reports
- Master Reports
- Report Controls
- Data Analysis and Interactivity
- Expression Editor
- Page Layout
- Styles and Themes
- Preview Report
- Export Report
- Report Templates
- Using Report Designer
- Report Render Mode
- Time Zone Setting
- Working with Dashboards
- Working with Notebooks
- Wyn Analytical Expressions
- Section 508 Compliance
- Subscribe to RSS Feed for Wyn Builds Site
- Developer Guide
Chart
All Report Charts share a set of property groups. These properties control positioning, appearance, handling of special data conditions, and interactivity. By adjusting these groups, you can determine how a chart connects to data, how it looks within the report, and how it behaves when interacted with by viewers.
The property groups provide a consistent framework across all chart types, making it easier to apply formatting standards and ensure reports remain both visually clear and functionally rich.
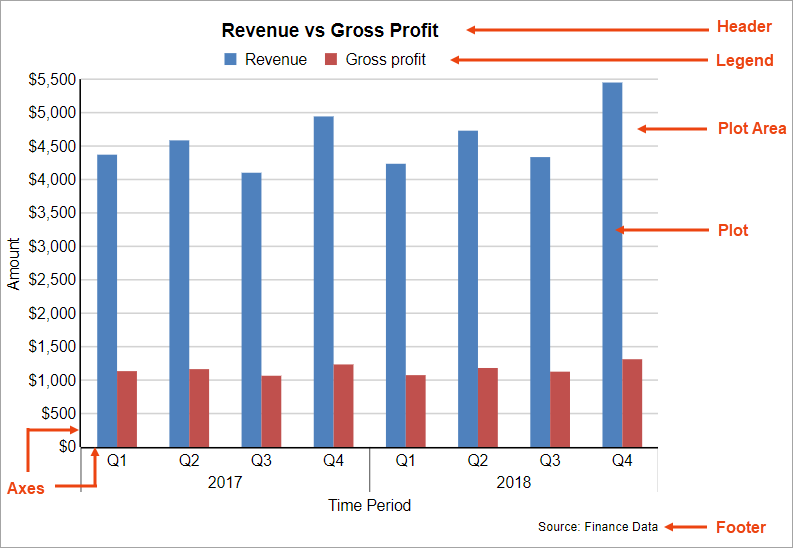
Chart Elements
The image below illustrates the elements that make up the Chart data region.
Click Explorer
 from the Report Toolbox located on the left to navigate and edit through all the parts of the Chart.
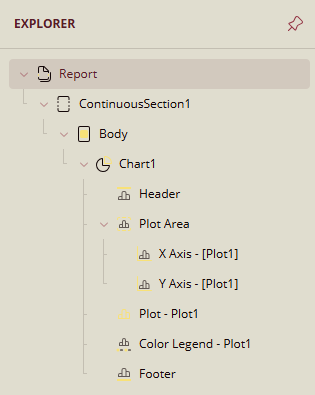
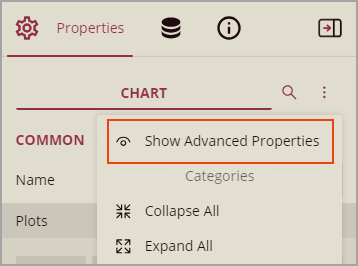
Enable Advanced Properties from the Properties and Data Panel located on the right to navigate and edit through all the parts.